Genetic Diversity of Maize Genotypes with Variable Resistance to Striga asiatica Based on SSR Markers
A.I.T. ShAyAnowAko*, h. ShImelIS, m.D. lAIng and l. mwADzIngenI School of Agricultural, Earth and Environmental Sciences, University of KwaZulu-Natal,
Pietermaritzburg, South Africa (Received 10 March 2018; Accepted 22 May 2018;
Communicated by S. Gottwald)
Genetic diversity among breeding populations is key in plant breeding programs. This study aimed to determine the extent of genetic diversity among 37 diverse maize genotypes using simple sequence repeat (SSR) markers. The maize genotypes were selected based on their variable resistance to Striga asiatica. Maize genotypes were fingerprinted using 18 polymorphic SSR markers. Marker and population diversity parameters were computed.
A total of 191 alleles were detected and the number of effective alleles varied from 2 to 21 per locus with a mean of 11. The polymorphic information content (PIC) of the SSR markers varied from 0.59 to 0.96, with a mean of 0.80. Significant differences were observed among populations, individuals and within individuals. Within and among individual variances accounted for 85% and 13% of the total gene diversity. The genotypes were grouped into three main genetic clusters, which were not influenced by genotype origin. Mean genetic distance (0.43) and low geneflow (0.18) were observed among the populations. High mean genetic identity (0.65) was recorded, indicating potential genetic ‘bottleneck’ among the selected germplasm. The following open pollinated varieties; Border King, Colorado, CIMMYT’s ZM OPVs, Mac Pearl, Shesha, Nel Choice, Natal 8Lines, Nel Choice QPM, Hickory King, Kep Select, Obatanpa and the Striga resistant synthetic variety DSTR- YSYN15 were selected from different clusters for breeding.
Keywords: FOS, genetic variation, microsatellites, southern Africa, Striga, Zea mays
Introduction
Maize (Zea mays. L., 2x = 2n = 20) is a key staple food crop providing 15–50% of the daily energy requirements of over a billion people in sub-Saharan Africa (SSA) and Latin America (Ranum et al. 2014). Farmers in SSA prefer maize cultivation to other relatively drought tolerant crops such as sorghum and millets. Although southern Africa has the highest maize consumption, maize productivity in the region is still very low (Ranum et al. 2014). The low maize yields can be attributed to a plethora of causes including the parasitic weed Striga asiatica (Shayanowako et al. 2017). Striga parasitizes the crop to extract photosynthetic assimilates from the host, causing stunted growth and poor yields.
Complete crop failures under high infestation levels is common (Amusan et al. 2008).
*Corresponding author; E-mail: mwadzingenil@yahoo.com
Host resistance has been a key component in developing an integrated approach towards securing reasonable crop yields from the Striga parasites. There are limited studies on S. asiatica resistance in southern African maize germplasm.
Plant breeders strive to develop cultivars with low production of strigalactones, root barriers for Striga incompatibility, as well as hypersensitive and antibiosis reactions, all serving as key components of Striga resistance. Strigalactones are chemical compounds in maize’s root exudates that trigger emergence of the parasite’s germ tube and its subse- quent attachment to nearby host roots. Low strigolactone producing genotypes reduce Striga germination and subsequent parasitism. Genetic variation is a precondition to se- lect for low strigalactone producing maize genotypes with favourable agronomic traits (Karaya et al. 2012). Striga resistance traits have been identified from Z. diploperennis and successfully introgressed into inbred lines and synthetics of cultivated maize (Amu- san et al. 2008). There is need to explore and exploit available genetic resources including from gene banks and breeding populations.
Genetic diversity analysis is essential to assess the levels of variability present among genetic resources and to assign genotypes into heterotic groups. DNA based markers are widely used in genetic analysis as well as in marker-assisted and genomic selection. Se- lection accuracy can be improved in conventional breeding through integrating molecular markers, which are independent of the environmental effects. Selection efficiency can be enhanced, and costs of phenotyping can be reduced through complementary uses of mo- lecular markers since they are detectable at all stages of plant growth. Simple sequence repeats (SSR) are highly variable markers comprising of tandemly repeated oligonucleo- tides of two to six base pair long DNA sequences (Govindaraj et al. 2015). SSRs are highly polymorphic even among closely related genotypes due to mutational events causing variation in the number of repeat units (Gonzaga et al. 2015). SSRs are co-dom- inant markers with Mendelian inheritance, hence are effective in genetic diversity assess- ment (Smith et al. 1997). Diverse maize genotypes with variable resistance to S. asiatica were acquired from southern and west Africa for resistance breeding. The genotypes were assayed for Striga resistance using their strigalactone biosynthesis activities. These ge- netic resources should be well characterised with SSR markers to identify unique parents and base populations to guide effective hybridisation and for breeding population devel- opment. Therefore, this study aimed to determine the extent of genetic diversity among 37 maize genotypes collected from southern and western Africa using SSR markers.
Materials and Methods Plant materials and genotyping
Thirty-seven genetically diverse maize genotypes obtained from the African Centre for Crop Improvement (ACCI)/South Africa, International Maize and Wheat Improvement Centre (CIMMYT)/Zimbabwe, Crop Breeding Institute (CBI)/Zimbabwe, International Institute of Tropical Agriculture (IITA)/Nigeria, National Plant Genetic Resources Centre (NPGRC)/South Africa and University of Zimbabwe (UZ) were used in this study. These
Table 1. List, sources of maize genotypes used in the study and their Striga germination stimulant reactions
Entry number
GenotypeSourceDescriptionGC (%)
MGD (mm) Entry number
GenotypeSourceDescriptionGC (%)
MGD (mm)
1Zm1623CIMMYT/ ZimOPV20.514.0120Nel Choice QPMNPGRC/SA QPM OPV26.515.89 2Zm1523CIMMYT/ ZimOPV18.515.5721Mac PearlNPGRC/SAOPV18.514.87 3Zm1421CIMMYT/ ZimOPV13.511.1422Kep SelectNPGRC/SAOPV2316.22 4Zm1423CIMMYT/ ZimOPV2618.3423SheshaNPGRC/SAOPV32.523.78 5CML312CIMMYT/ ZimInbred line1514.8524Pan 67NPGRC/SAHybrid27.521.36 68338-1IITA/NigeriaHybrid4121.8125HP326-2NPGRC/SAHybrid23.518.47 7T2B-SR IITA/NigeriaOPV30.522.426Pan 6611NPGRC/SAHybrid3121.16 89022-13 IITA/NigeriaHybrid2517.6227Cap 9001NPGRC/SAHybrid23.7832.5 9ObatanpaIITA/NigeriaOPV3023.8728AX 23UZHybrid5725.22 10SAMM216IITA/NigeriaOPV18.513.8829AX 32UZHybrid2116.31 11
DSTR- YSYN15
IITA/NigeriaOPV7.58.0930AX13UZHybrid1614.82 12HA04A- 2107-109CBI/ZimInbred line2821.7331AX31UZHybrid2921.21 13R201CBI/ZimHybrid2116.2232AX11UZHybrid23.518.61 14SR 52CBI/ZimHybrid14.513.6533AX5UZHybrid3021.53 15HA04A- 2007-36CBI/ZimInbred line4418.2534AX27UZHybrid2720.56 16Hickory KingCBI/ZimOPV15.512.0035MZ03B-2207-44ACCI/SAInbred line21.1631.00 17ColoradoNPGRC/SAOPV2416.6436MZ0313B-2205-90ACCI/SAInbred line3820.12 18Border KingNPGRC/SAOPV32.525.4537Natal 8 linesACCI/SALandrace21.516.25 19Nel ChoiceNPGRC/SAOPV1714.71 GC, Striga germination counts; MGD, Maximum Striga germination distance; OPV, open pollinated variety; QPM, quality protein maize; ACCI/SA, African Centre for Crop Improvement South Africa; CIMMYT/Zim, International Maize and Wheat Improvement Centre/Zimbabwe; CBI/Zim, Crop Breeding Institute of Zimbabwe; IITA/Nigeria, International Institute of Tropical Agriculture Nigeria; NPGRC/SA, National Plant Genetic Resources Centre South Africa; UZ, University of Zimbabwe.
genotypes were evaluated for S. asiatica resistance in a preliminary study using the Agar gel assay described by Mohamed et al. (2010) to determine germination counts (GC) and maximum germination distances (MGD). Table 1 presents a list and sources of the 37 maize genotypes used in the study and their GC and MGD. The seedlings were raised in seeding trays at the University of KwaZulu-Natal Controlled Environment Facilities (UKZN-CEF). Leaf tissues were sampled from four-week-old seedlings and genomic DNA was extracted using the CTAB protocol (Porebski et al. 1997). Genotyping was done following a standard PCR procedure for maize SSR markers (CIMMYT 2005) using 18 microsatellites selected based on their high level of polymorphism. The list of makers used and their primer sequences are presented in Table 2. DNA samples were then elec- trophoresed on an ABI-3730 automatic DNA sequencer. The amplified DNA fragments were recorded as fragment sizes in base pairs (bp).
Data analysis
Genetic diversity analyses was performed using GenAlex version 6.5 (Peakall and Smouse 2012). The following genetic diversity parameters were estimated; total number of alleles per locus (Na), number of effective alleles per locus (Ne), observed heterozygo-
Table2. 18 SSR markers with forward and reverse primer combinations used in the study (Andorf et al. 2015)
Locus Forward Reverse
BNLG2190 TCCTCCTTCATCCCCTTCTT CCCAGTATCATTGCCCAATC
BNLG238 CTTATTGCTTTCGTCATACACACACATTCAT GAGCATGAGCTTGCATATTTCTTGTGG
BNLG602 CCCGATAGCCAAGCTCTCGCCAA AGCTCGTGGACCGAACAAGCCCA
NC003 ACCCTTGCCTTTACTGAAACACAACAGG GCACACCGTGTGGCTGGTTC
phi037 CCCAGCTCCTGTTGTCGGCTCAGAC TCCAGATCCGCCGCACCTCACGTCA
umc1153 CAGCATCTATAGCTTGCTTGCATT TGGGTTTTGTTTGTTTGTTTGTTG
phi085 AGCAGAACGGCAAGGGCTACT TTTGGCACACCACGACGA
phi083 CAAACATCAGCCAGAGACAAGGAC ATTCATCGACGCGTCACAGTCTACT
phi127 ATATGCATTGCCTGGAACTGGAAGGA AATTCAAACACGCCTCCCGAGTGT
umc1136 CTGCATACAGACATCCAACCAAAG CTCTCGTCTCATCACCTTTCCCT
phi064 CCGAATTGAAATAGCTGCGAGAACCT ACAATGAACGGTGGTTATCAACACGC
phi054 AGAAAAGAGAGTGTGCAATTGTGATAGAG AATGGGTGCCTCGCACCAAG
BNLG619 ACCCATCCCACTTTCCACCTCCTCCT GCTTTCAGCGAATACTGAATAACGCGGA
phi022 TGCGCACCAGCGACTGACC GCGGGCGACGCTTCCAAAC
phi109188 AAGCTCAGAAGCCGGAGC GGTCATCAAGCTCTCTGATCG
phi112 TGCCCTGCAGGTTCACATTGAGT AGGAGTACGCTTGGATGCTCTTC
umc1304 GCCAACTAGAACTACTGCTGCTCC CATGCAGCTCTCCAAATTAAATCC
umc2038 ACAGAAACCAATGCATGTGATGAG TGCATGGTTGCTTCAGCAGT
sity (Ho), expected heterozygosity (He) and fixation index (FIS) (Nei 1978). The polymor- phic information content (PIC) was estimated according to Smith et al. (1997) as;
where, Pi is the frequency of the ith allele. The genetic distance matrix was used to create a dendrogram based on the neighbour-joining method using the software Darwin 6.0.5 (Perrier and Jacquemoud-Collet 2006) to visualize the relationships among accessions and the pattern of clusters within and among populations. The genotypes were then grouped according to their sources and analysis of molecular variance (AMOVA) was performed.
Results Polymorphism and allelic diversity of SSR markers
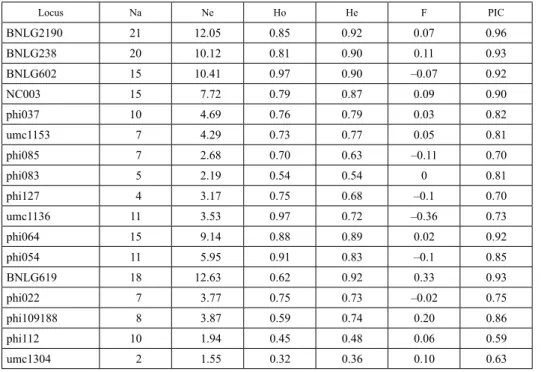
The 18 SSR markers used detected 191 polymorphic alleles. Ten markers generated 2 to 10 alleles, while eight markers identified 11 to 21 alleles. An average of 10.61 alleles were generated per locus. The number effective alleles detected ranged from 1.55 for marker umc 1304 to 12.63 for marker BNLG619, with a mean of 5.683 alleles per locus (Table 3).
PIC Pi
i
= n
∑
= 12
Table 3. Genetic parameters of the 18 SSR markers used in the study of 37 maize populations collected from five sources
Locus Na Ne Ho He F PIC
BNLG2190 21 12.05 0.85 0.92 0.07 0.96
BNLG238 20 10.12 0.81 0.90 0.11 0.93
BNLG602 15 10.41 0.97 0.90 –0.07 0.92
NC003 15 7.72 0.79 0.87 0.09 0.90
phi037 10 4.69 0.76 0.79 0.03 0.82
umc1153 7 4.29 0.73 0.77 0.05 0.81
phi085 7 2.68 0.70 0.63 –0.11 0.70
phi083 5 2.19 0.54 0.54 0 0.81
phi127 4 3.17 0.75 0.68 –0.1 0.70
umc1136 11 3.53 0.97 0.72 –0.36 0.73
phi064 15 9.14 0.88 0.89 0.02 0.92
phi054 11 5.95 0.91 0.83 –0.1 0.85
BNLG619 18 12.63 0.62 0.92 0.33 0.93
phi022 7 3.77 0.75 0.73 –0.02 0.75
phi109188 8 3.87 0.59 0.74 0.20 0.86
phi112 10 1.94 0.45 0.48 0.06 0.59
umc1304 2 1.55 0.32 0.36 0.10 0.63
Na, Number of observed alleles; Ne, Number of effective alleles; Ho, Observed heterozygosity; He, Average gene diversity within genotypes; F, Fixation index; PIC, Polymorphic information content.
Half of the total numbers of observed alleles in this study was revealed by 7 (39%) mark- ers. Observed heterozygosity ranged from 0.32 (umc1304) to 0.97 (BNLG602, umc 1136) with a mean of 0.73. Gene diversity (expected heterozygosity) followed a similar trend with values ranging from 0.35 (umc1304) to 0.92 (BNLG 619). All the SSR mark- ers used in this study showed high level of polymorphism with PIC values ranging from 0.59 to 0.96 with a mean of 0.80. SSR marker BNLG2190 was the most informative with a PIC value of 0.95, while the least polymorphic marker (phi112) had a PIC value of 0.59.
The fixation index showed that six markers (BNLG602, phi085, phi127, umc1136, phi054, phi022 and umc2038) exhibited heterozygosity excess with values ranging from –0.36 to –0.02. Heterozygosity deficiency was only observed on locus BNLG619 (0.33), while it was far less accentuated in the remaining eleven makers.
Cluster analysis
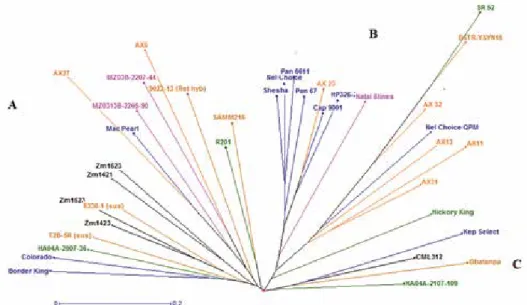
The neighbour joining tree computed from the 18 SSR makers grouped the genotypes into three main clusters A, B and C (Figure 1). Group A was divided into 3 sub-clusters (A1, A2 and A3). Sub-group A1 was dominated by CIMMYT bred OPVs including the mod- erately strigalactone producing genotypes ZM1421, ZM1623 and an inbred line from CBI. Two other genotypes in this group were from NPGRC. Sub-group A2 contained 6 genotypes which originated from ACCI, UZ, NPGRC and IITA with varying levels of strigalactone biosynthesis such as MZ03B-2207-44, MZ0313B-2205-9, AX5 and AX25 with high stimulant production (MGD > 20 mm) as well as Mac Pearl and 9022-13 with moderate stimulation. Sub-cluster A3 had two genotypes from Zimbabwe (R201) and
Figure 1. Dendrogram showing the genetic relationship of 37 maize genotypes genotyped using 18 SSR markers
Nigeria (SAMM216), which are moderate in strigalactone production. Sub-group B com- posed of three sub-clusters (B1, B2 and B3). Sub-cluster B1 contained most genotypes sourced from South Africa with an exception of one hybrid from UZ. In this group, the OPV Nel Choice and landrace Natal 8 Lines were important for their low MGD scores, which may be important in enhancing field resistance. Hybrids from UZ dominated the second sub-cluster (B2) together with an outstandingly low strigalactone producing IITA synthetic DSTR-YSYN15 (MGD < 10 mm; GC, 7.5%). Notably, sub-cluster B3 had one genotype, Hickory King, with moderate MGD and GC values. Cluster C was composed of only 4 genotypes, namely inbred line CML312 from CIMMYT, inbred line HA04A-2107-109 from CBI and open pollinated genotypes Kep-Select from NPGRC and variety Obatanpa from IITA.
Genetic variability within and among populations
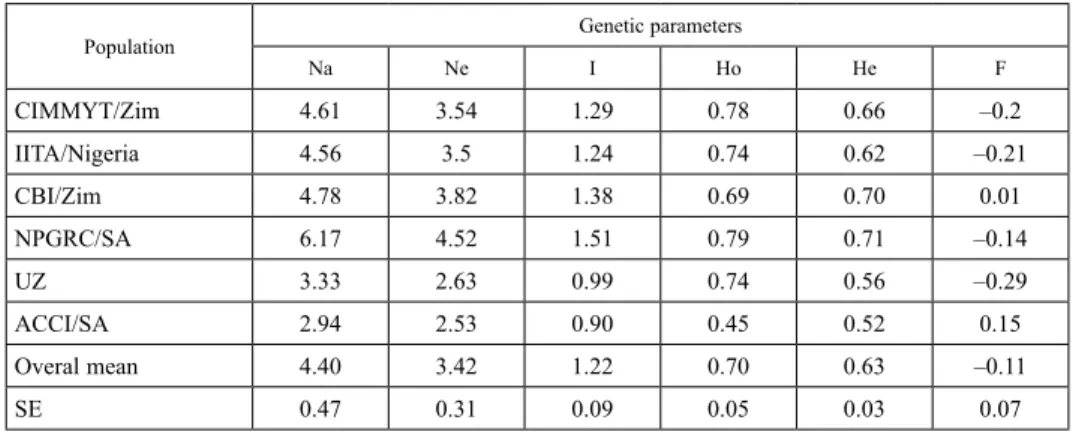
Genetic diversity parameters were also determined among populations of different sourc- es. Genotypes sourced from NPGRC and CBI had the highest Na values of 6.17 and 4.78, and Ne values of 4.52 and 3.82, respectively. Similarly, the lowest Na values of 3.33 and 2.94 and Ne of 2.63 and 2.53 were recorded from UZ and CBI populations, respectively (Table 5). The mean values of Na and Ne in all the six populations were 4.40 and 3.42, respectively. Mean observed and expected heterozygosity across the genotype groups were 0.7 and 0.63, respectively. Highest values for Ho (0.79) and He (0.71) were found on NPGRC genotypes, while lowest values were found from ACCI genotypes. Among the six populations, the Shannon’s Information Index of Diversity (I) ranged from 0.9 (ACCI genotypes) to 1.51 (NPGRC genotypes) with a mean of 1.22. High heterozygosity values recorded were associated with F values ranging from –0.29 (UZ) to 0.15 (ACCI), having a mean of –0.11 at population level.
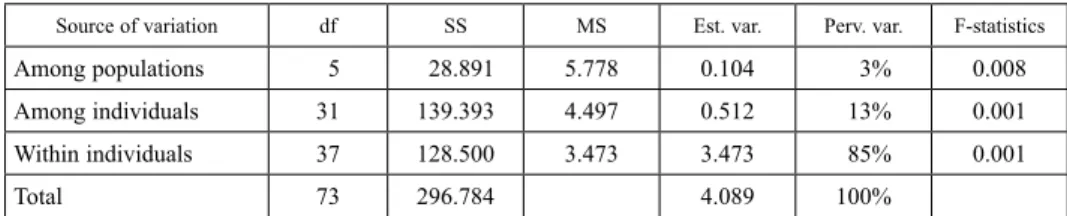
Analysis of molecular variances (AMOVA) partitioned the total molecular variances into within and among the sets of maize genotypes, populated based on their sources of collection. Significant molecular differences (P < 0.01) were observed among popula- tions, among genotypes and within genotypes (Table 5). Only a minor proportion of the total genetic variance (3%) existed among populations. However, variation within indi- viduals accounted for the largest proportion of genetic variation (85%), while 13% of the variation was explained by among individuals’ variability.
Table 4. Analysis of molecular variance (AMOVA) among 37 maize cultivars collected from five centres
Source of variation df SS MS Est. var. Perv. var. F-statistics
Among populations 5 28.891 5.778 0.104 3% 0.008
Among individuals 31 139.393 4.497 0.512 13% 0.001
Within individuals 37 128.500 3.473 3.473 85% 0.001
Total 73 296.784 4.089 100%
DF, Degree of freedom; SS, sum of squares; MS, mean sum of squares; Est. var., estimated variance; Perv. var., Percentage variation.
Population differentiation based on source of collection
Population parameters are summarised in Table 6. Genetic distance estimates between populations ranged from 0.25 (CIMMYT vs NPGRC) to 0.59 (CBI vs ACCI) with a mean GD of 0.43. Genetic identity among the cultivars varied between 0.55 (CBI vs ACCI) and 0.78 (CIMMYT vs NPGRC) with a mean GI value of 0.65. There were larger genetic distances among populations derived from diverse heterotic groups. The gene flow (Nm) among genotypes within sources of collection ranged from 0.12 (ACCI vs CBI) to 0.3 (ACCI vs UZ), and Nm values were less than 1. Genetic differentiation (Fst) among the sources varied from 0.05 to 0.15.
Table 5. Genetic parameters based on diversity assessment of 37 maize genotypes originated from six sources
Population Genetic parameters
Na Ne I Ho He F
CIMMYT/Zim 4.61 3.54 1.29 0.78 0.66 –0.2
IITA/Nigeria 4.56 3.5 1.24 0.74 0.62 –0.21
CBI/Zim 4.78 3.82 1.38 0.69 0.70 0.01
NPGRC/SA 6.17 4.52 1.51 0.79 0.71 –0.14
UZ 3.33 2.63 0.99 0.74 0.56 –0.29
ACCI/SA 2.94 2.53 0.90 0.45 0.52 0.15
Overal mean 4.40 3.42 1.22 0.70 0.63 –0.11
SE 0.47 0.31 0.09 0.05 0.03 0.07
ACCI/SA, African Centre For Crop Improvement South Africa; CIMMYT/Zim, International Maize and Wheat Improvement Centre Zimbabwe, Crop Breeding Institute of Zimbabwe; IITA, International Institute of Tropical Agriculture;
NPGRC/SA, National Plant Genetic Resources Centre South Africa; UZ, University of Zimbabwe; Na, Number of observed alleles; Ne, Number of effective alleles; I, Shannon information index, Ho, Observed heterozygosity; He, Average gene diver- sity within genotypes; F, Fixation index.
Table 6. Genetic distance (above diagonal off brackets), genetic identity (above diagonal within brackets and gene flow (lower diagonal off brackets) and genetic differentiation (lower diagonal within brackets)
Source CIMMYT/Zim IITA/Nigeria CBI/Zim NPGRC/SA UZ ACCI/SA
CIMMYT/Zim 0.30(0.74) 0.40(0.67) 0.25(0.78) 0.45(0.64) 0.49(0.62) IITA/Nigeria 0.23(0.07) 0.46(0.63) 0.29(0.75) 0.44(0.64) 0.48(0.62) CBI/Zim 0.13(0.07) 0.14(0.09) 0.26(0.77) 0.58(0.56) 0.59(0.55) NPGRC/SA 0.18(0.05) 0.23(0.07) 0.17(0.05) 0.43(0.65) 0.49(0.61)
UZ 0.19(0.10) 0.21(0.10) 0.14(0.12) 0.19(0.10) 0.55(0.58)
ACCI/SA 0.17(0.12) 0.13(0.13) 0.12(0.14) 0.14(0.12) 0.30(0.15)
ACCI/SA, African Centre for Crop Improvement/South Africa; CIMMYT/Zim, International Maize and Wheat Improvement Centre/Zimbabwe; CBI/Zim, Crop Breeding Institute/ Zimbabwe; IITA, International Institute of Tropical Agriculture/Nigeria; NPGRC/SA, National Plant Genetic Resources Centre/South Africa; UZ, University of Zimbabwe.
Discussion
SSRs are valuable genomic resources which have been widely used in genetic diversity analysis in maize (Prasanna et al. 2014). In this study, SSR markers were used to make inferences about the genetic diversity within and among diverse maize populations rela- tive to their origins. A mean He value of 0.74 was recorded (Table 3) which is comparable to that reported by Enoki et al. (2002), who found a mean He of 0.72. This was probably attributed to high mean number of alleles per loci. The high level of heterozygosity de- tected in the present population suggests that recurrent selection procedure can be effec- tive in the development of OPVs to realise considerable genetic gains per breeding cycle (Menkir et al. 2007). Similar to the present findings, a mean FIS of 0.1 was reported by Barcaccia et al. (2003) in a genetic variability analysis of landraces and synthetic varieties of maize. Nyaligwa et al. (2015) observed a mean fixation index of 0.72 using 30 SSR markers when evaluating 79 maize inbred lines. Minimum heterozygosity is desired in inbred line development. The high PIC values observed among the SSR markers used (Table 3) indicates their informativeness as well as their potential to detect polymorphism among the selected genotypes. PIC values can be influenced by the nature of germplasm tested and the level of genetic diversity (Bantte and Prasanna 2003).
Cluster analysis grouped the genotypes into three main clusters (Fig. 1), which may probably relate to distinct heterotic groups from which selections for hybridisation and population development can be done. However, this grouping was independent from nei- ther strigalactone biosynthesis activity nor source of collection. This is because the SSR markers used were not linked to QTL for strigalactone production. In addition, clustering could have been influenced by extensive sharing of germplasm across the region. This is in agreement with the findings of Akinwale et al. (2014), which failed to discriminate inbred lines on the basis of their tolerance or resistance to S. hermonthica. Instead geno- types from different sources were allocated across clusters, indicating a higher number of common alleles, which could be attributed to gene flow due to cross pollination and germplasm sharing. Noteworthy is the divergence of the Striga resistant IITA synthetic DSTR-YSNI5 (MGD < 10 mm) from the rest of the CIMMYT and NPGRC OPVs, which can be a potential source of heterosis in the expression of field resistance to Striga.
Analysis of molecular variance revealed 3, 13 and 85% of the genetic variation attrib- utable to among populations, among individuals and within individuals, respectively (Table 4). The effect of low population sizes evaluated could have contributed to reduced genetic variation among and within populations. The mean observed and expected hete- rozygosity were 0.70 and 0.63 (Table 5), which are comparatively higher than those re- ported in previous studies (Aci et al. 2013; Noldin Almiron 2008; Patto et al. 2004). The present study found Shannon’s Information Index of 1.22 showing high genetic differen- tiation between population sampled from six geographic origins. Barcaccia et al. (2003) reported low index (0.26) among landraces and synthetics. Conversely, Kashiani et al.
(2012) reported comparatively low indices ranging from 0.037 to 0.05 using SSR markers on sweet corn inbred lines. Barcaccia et al. (2003) reported mean genetic similarity coef- ficients of 0.217 between landrace populations with SSR markers, and 0.564 using I-SSR markers. The low gene flow values (Nm < 1), which in part could have been influenced by
small sample sizes, may imply that there is high genetic differentiation among the geno- types. Results from the pairwise FST analysis (Table 6) revealed a high level of genetic differentiation between the genotype sources, which may indicate genetic isolation of the test genotypes due to active involvement of the private sector in maize breeding program in southern Africa.
Low genetic diversity may translate to an increase in genetic vulnerability to abiotic and biotic stresses including Striga infestation. High genetic variability is usually found among broad-based open pollinated and synthetic varieties (Warburton et al. 2008). Re- sults from the present study reveals considerable genetic diversity among the evaluated genotypes that could be utilised in Striga resistance breeding. Striga resistance and toler- ance are derived from a linkage of mechanisms including low germination stimulant activities, mechanical root barriers, post attachment hypersensitive reactions and insensi- tivity to Striga toxins, all of which are dependent on a large reservoir of genetic variation (Ejeta 2005; Haussmann et al. 2001). Hence, these results will assist in the selection and identification of potential sources of valuable genetic diversity for Striga resistance.
Generally, the test genotypes had considerable genetic diversity. However, a great pro- portion of the genetic diversity is conserved within each source of collection. Based on genotypic clustering and preliminary agar-gel assay, selection and breeding for horizontal Striga resistance may target some of the locally adaptable OPVs. Therefore, this study selected genotypes Border King, Colorado, ZM1423, ZM1523, ZM1421, ZM1623, Mac Pearl, Shesha, Nel Choice, Natal 8Lines, Nel Choice QPM, Hickory King, Kep Select and Obtanpa for breeding.
Acknowledgements
The authors thank the National Research Foundation (NRF) of South Africa and the World Academy of Science (TWAS) for financial support of the study. The International Institute of Tropical Agriculture (IITA) is acknowledged for providing some of the germ- plasm used in this study.
References
Aci, M.M., Revilla, P., Morsli, A., Djemel, A., Belalia, N., Kadri, Y., Khelifi-Saloui, M., Ordás, B., Khelifi, L.
2013. Genetic diversity in Algerian maize (Zea mays L.) landraces using SSR markers. Maydica 58:304–310.
Akinwale, R., Badu-Apraku, B., Fakorede, M., Vroh-Bi, I. 2014. Heterotic grouping of tropical early-maturing maize inbred lines based on combining ability in Striga-infested and Striga-free environments and the use of SSR markers for genotyping. Field Crop. Res. 156:48–62.
Amusan, I.O., Rich, P.J., Menkir, A., Housley, T., Ejeta, G. 2008. Resistance to Striga hermonthica in a maize inbred line derived from Zea diploperennis. New Phytol. 178:157–166.
Andorf, C.M., Cannon, E.K., Portwood, J.L., Gardiner, J.M., Harper, L.C., Schaeffer, M.L., Braun, B.L., Campbell, D.A., Vinnakota, A.G., Sribalusu, V.V. 2015. MaizeGDB update: new tools, data and interface for the maize model organism database. Nucleic Acids Res. 44:D1195–D1201.
Bantte, K., Prasanna, B. 2003. Simple sequence repeat polymorphism in Quality Protein Maize (QPM) lines.
Euphytica 129:337–344.
Barcaccia, G., Lucchin, M., Parrini, P. 2003. Characterization of a flint maize (Zea mays var. indurata) Italian landrace, II. Genetic diversity and relatedness assessed by SSR and Inter-SSR molecular markers. Genet.
Resour. Crop Ev. 50:253–271.
CIMMYT. 2005. Laboratory Protocols: CIMMYT Applied Molecular Genetics Laboratory Mexico, D.F.:
CIMMYT.
Ejeta, G. 2005. Integrating biotechnology, breeding, and agronomy in the control of the parasitic weed Striga spp in sorghum. In the Wake of the Double Helix: From the Green Revolution to the Gene Revolution Tuberosa, R., Phillips, R.L., Gale. M. (eds) Bologna, Italy. pp. 239–251.
Enoki, H., Sato, H., Koinuma, K. 2002. SSR analysis of genetic diversity among maize inbred lines adapted to cold regions of Japan. Theor. Appl. Genet. 104:1270–1277.
Gonzaga, Z.J., Aslam, K., Septiningsih, E.M., Collard, B.C. 2015. Evaluation of SSR and SNP markers for molecular breeding in rice. Plant breeding and biotechnology 3:139–152.
Govindaraj, M., Vetriventhan, M., Srinivasan, M. 2015. Importance of genetic diversity assessment in crop plants and its recent advances: an overview of its analytical perspectives. Genetics research international 2015.
Haussmann, B., Hess, D., Reddy, B., Mukuru, S., Kayentao, M., Welz, H., Geiger, H. 2001. Pattern analysis of genotype× environment interaction for striga resistance and grain yield in African sorghum trials. Euphytica 122:297–308.
Karaya, H., Njoroge, K., Mugo, S., Ariga, E., Kanampiu, F., Nderitu, J. 2012. Determination of levels of Striga germination stimulants for maize gene bank accessions and elite inbred lines. International Journal of Plant Production. 6:209–224.
Kashiani, P., Saleh, G., Panandam, J.M., Abdullah, N.A.P., Selamat, A. 2012. Molecular characterization of tropical sweet corn inbred lines using microsatellite markers. Maydica 57:154–163.
Menkir, A., Badu-Apraku, B., Yallou, C.G., Kamara, A.Y., Ejeta, G. 2007. Breeding maize for broad-based resistance to Striga hermonthica Singapore: World Scientific Publishing.
Mohamed, A.H., Housley, T., Ejeta, G. 2010. An in vitro technique for studying specific Striga resistance mechanisms in sorghum. Afr. J. Agr. Res. 5:1868–1875.
Nei, M. 1978. Estimation of average heterozygosity and genetic distance from a small number of individuals.
Genetics 89:583–590.
Noldin Almiron, O.J. 2008. Análisis multivariante de la colección nuclear de la raza Avati Morotî de Paraguay.
DEA en agronomía Universidad de Vigo, España.
Nyaligwa, L., Hussein, S., Amelework, B., Ghebrehiwot, H. 2015. Genetic diversity analysis of elite maize inbred lines of diverse sources using SSR markers. Maydica 60:M29.
Patto, M.V., Satovic, Z., Pego, S., Fevereiro, P. 2004. Assessing the genetic diversity of Portuguese maize germplasm using microsatellite markers. Euphytica 137:63–72.
Peakall, P., Smouse, R. 2012. GenAlEx 6.5: genetic analysis in Excel. Population genetic software for teaching and research–an update. Bioinformatics 28:2537–2539.
Perrier, X., Jacquemoud-Collet, J.P. 2006. DARwin software. http://www.darwin.cirad.fr/darwin.html.
Accessed 8 March 2018.
Porebski, S., Bailey, L.G., Baum, B.R. 1997. Modification of a CTAB DNA extraction protocol for plants containing high polysaccharide and polyphenol components. Plant Mol. Biol. Rep. 15:8–15.
Prasanna, B., Babu, R., Nair, S., Semagn, K., Chaikam, V., Cairns, J., Zhang, X., Xu, Y., Olsen, M. 2014.
Molecular marker-assisted breeding for tropical maize improvement. Genetics, genomics and breeding of maize CRC Press. United Kingdom, London. pp. 89–119.
Ranum, P., Peña-Rosas, J.P., Garcia-Casal, M.N. 2014. Global maize production, utilization, and consumption.
Ann. NY. Acad. Sci. 1312:105–112.
Shayanowako, A.T., Laing, M., Shimelis, H., Mwadzingeni, L. 2017. Resistance breeding and biocontrol of Striga asiatica (L.) Kuntze in maize: a review. Acta. Agric. Scand. Sect. B. Soil Plant Sci. 67:1–11.
Smith, J., Chin, E., Shu, H., Smith, O., Wall, S., Senior, M., Mitchell, S., Kresovich, S., Ziegle, J. 1997. An evaluation of the utility of SSR loci as molecular markers in maize (Zea mays L.): comparisons with data from RFLPs and pedigree. Theor. Appl. Genet. 95:163–173.
Warburton, M., Reif, J., Frisch, M., Bohn, M., Bedoya, C., Xia, X., Crossa, J., Franco, J., Hoisington, D., Pixley, K. 2008. Genetic diversity in CIMMYT nontemperate maize germplasm: landraces, open pollinated varieties, and inbred lines. Crop Sci. 48:617–624.