https://doi.org/10.1007/s42976-019-00005-z ORIGINAL PAPER
SNP‑based genetic diversity assessment among hungarian bread wheat (Triticum aestivum L.) genotypes
P. Körmöczi1 · B. Tóth1 · A. Nagy‑György1 · K. Kocsis1 · J. Óvári2 · B. P. Szabó3 · A. Véha3 · L. Cseuz2
Received: 2 August 2019 / Accepted: 9 October 2019 / Published online: 19 December 2019
© The Author(s) 2019
Abstract
World’s food supply will be a great challenge due to the rapid growth of human population. Therefore, wheat breeders are facing a great task to improve further the crop quality and quantity. Genetic improvement could be the key in this progres- sion, which is based on the exploitation of genetic resources. So it is important to hold exact information about the wheat population structure, especially the genetic diversity of elite crop germplasm. Here, we provide the characterisation of 85 Hungarian wheat varieties from 3 different Hungarian breeding programmes (Szeged, Martonvásár and Karcag) trough Com- petitive Allele-Specific PCR (KASP) technique. Population structure of these accessions were examined by STRU CTU RE software and the ΔK values were calculating by the STRU CTU RE HARVESTER. These investigations revealed 3 subgroups in our wheat population with 21, 19 and 45 genotypes in GrI, GrII and GrIII, respectively. We could conclude that the GrI and GrIII subgroups contained genotypes from all three origins while GrII contained genotypes only from Szeged. We also examined the allele distribution of the Xgwm261 locus since the 192 bp allele is reported to be linked to semi-dwarfing gene Rht8, which has important role in the breeding process. Altogether we could observe 5 size variant products, but the 174 bp (22.35%), 192 bp (55.29%), and 198 bp (12.94%) long fragments could be found the most frequently. The present study confirms that population structure and genotype relatedness, based on molecular data, are consistent with the geography origin and available pedigree data. Moreover, this study could be the starting point of a following association mapping work.
Keywords Wheat · Population structure · KASP · Xgwm261
Introduction
Some estimates suggest that the World population will be reach the ten billion people to 2050. This is a great chal- lenge for the future to solve the problem of food supply.
Wheat (Triticum aestivum L.) is one of the most important crop plant and staple food source, so breeders are also fac- ing a great task to improve the crop quality and quantity.
According to the 2017′s data of the Food and Agricultural
Organization of the United Nation, wheat is grown on about 218 million hectares. In Hungary this area covers one million hectares with a total grain production of five mil- lion tons (http://www.fao.org/faost at/en/#data/QC). How- ever, further increase in yields is essential and the genetic improvement which is based on the exploitation of genetic resources could be the key for this [19].
In the recent decades, due to the strong efforts of the breeders, grain yield, quality, agronomic traits and disease resistance has improved successfully. The appropriate usage of elite germplasm as parental stocks also contributed this [10]. But the continuous application of this elite germplasm lines has led to the decrease of genetic diversity and nar- rowed the genetic background of wheat improvement [8, 9, 15, 23]. Roussel et al. [23] proved an increase in the genetic similarity of European varieties. They also demonstrated that the qualitative variation of allelic composition increased as well. These changes could be related with the different geographic regions and the different practices that were used by the breeding programmes. Intensive selection pressure is
Communicated by M. Molnár-Láng.
* P. Körmöczi
kormoczi.peter@noko.naik.hu
1 NAIK Department of Field Crops Production, Alsó kikötő sor 9, 6726 Szeged, Hungary
2 Cereal Research Non-profit Ltd., Alsó kikötő sor 9, 6726 Szeged, Hungary
3 University of Szeged, Faculty of Engineering, Moszkvai krt. 5-7, 6725 Szeged, Hungary
appeared earlier in Northern and Western Europe and it has also an effect of winter wheat breeding [23].
In earlier genetic investigations the locus of Xgwm261 had special respect because of the 192 bp allele [1]. This allele is reported to be linked to semi-dwarfing gene Rht8, which was used in Southern European cultivars in order to reduce the plant height without any adverse effect on yield [30–32]. It has other two alleles (174 bp and 165 bp) which are also reported to be frequent but did not bring about height reduction as much as the 192 bp allele [28, 29]. As a marker of Rht8 gene the 192 bp allele has been widely used [18, 35]. The investigation of Rht8 gene could provide infor- mation about genetic structure of wheat population because it appears that Rht8 contributed to subgroup separation [19].
Assessing the relationships between genotypes is an important prerequisite for the identification of core popula- tion, which are suitable for the optimization of association research [13]. Several studies investigating the population structure, especially that focused the genetic diversity of elite crop germplasm [2, 14]. For the exact interpretation of the association between functional and molecular diversity, it is important to hold sufficient information about the popu- lation structure within the germplasm collections [6, 20].
Because of its clear importance, there are a lot of different molecular techniques available to examine genetic diversity.
In the recent past, the examination of the morphological and physiological characters formed to the basis of diversity studies. But these qualities were suitable for only approxi- mate estimation, because they forced by the environment [10]. Nowadays the usage of DNA-based molecular mark- ers has become popular, because they could eliminate the environmental impact.
By the explosive development of DNA-based molecular techniques, we have the opportunity to use cost-effective and high-throughput systems. Single nucleotide polymorphisms (SNP) could be an example as a molecular marker for these assays [26, 27]. In their advantages are included the high abundance in the genome, the low cost/sample ratio, the locus specificity and the co-dominant inheritance. In parallel with these properties it has the potential for high-throughput analysis with relatively low error rates [22, 24]. Because of these advantages, the SNPs emerged as powerful tools for numerous genetic application. Many companies offer SNPs genotyping platforms in their portfolio. KBioscience or LGC Genomics (http://www.lgcge nomic s.com) is one of these companies. In this case, the basis of the genotyping is the competitive allele-specific PCR (KASP™). KASP is a fluorescent-based technology, where the signal detection based on the allele-specific oligo extension and the follow- ing fluorescence resonance energy transfer (FRET) [17, 26].
In this study we compiled Hungarian bread wheat and durum wheat accessions in collaboration with wheat breed- ers of Cereal Research Non-Profit Ltd. 85 accessions were
genotyped with 1920 KASP markers in order to obtain adequate information about the population structure. Our goal was to provide a molecular based information for the breeders which will help them to find the appropriate cross- ing combinations. Moreover, this study could be the starting point of a following association mapping work.
Materials and methods
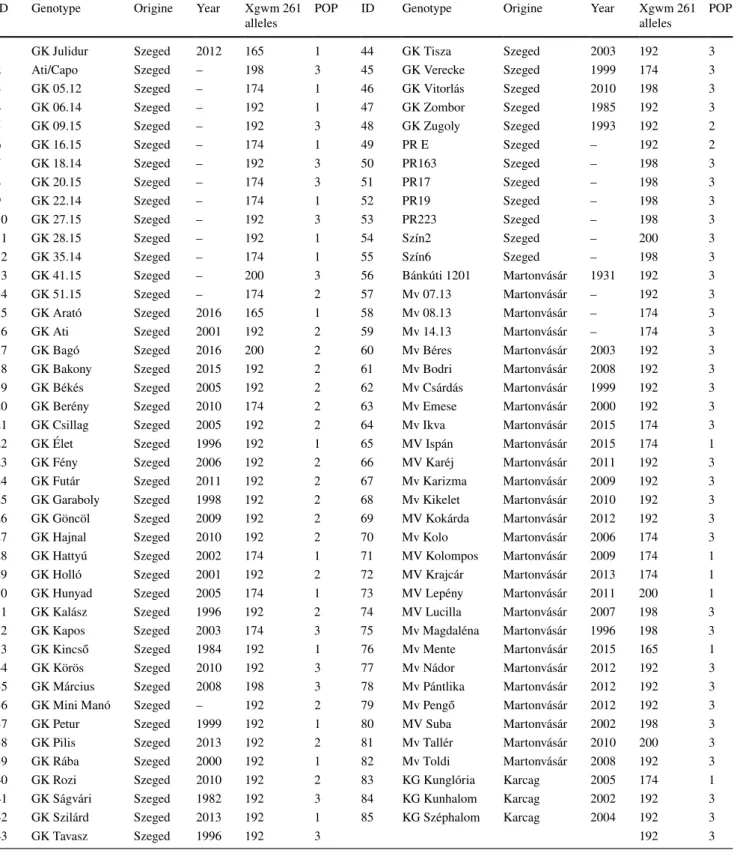
The wheat collections were compiled with the breeders of Cereal Research Non-Profit Ltd. Company. It numbered one durum wheat and 84 bread wheat genotypes. All of these cultivars deriving from Hungary, 55 originated from Sze- ged, 27 from Martonvásár and 3 from Karcag breeding pro- grammes. All these genotypes were obtained from the Small Grain Cereal Genebank, Szeged, Hungary. Table 1 shows the list of the examined genotypes.
In order to analyse SNPs in the experimental collection, firstly we planted the wheat seeds in the greenhouse and waited for tiller formation. After that, we cut appropri- ate number of leaf discs which have been sent to the LGC genomics company. They performed the DNA extraction from the leaf discs and then they completed the genotyping of the samples. They used altogether 1920 kinds of KASP marker to genotype the wheats which are evenly distributed on the A, B and D genome.
The resulted raw data were edited by Microsoft Excel 2017 software to be suitable for structure analysis. For the estimation of the number of hypothetical subpopulations (K) in our collections STRU CTU RE (v2.3.4) software was used. Via the usage of this program we could estimate the membership probability of each genotypes to the subpopula- tion as well [21]. We performed a model-based (Bayesian) clustering approach, where the number of the hypothetical subpopulation was set to 1 to 10. The Markov chain Monte Carlo (MCMC) of 10.000 burn-in phases followed by 10.000 iterations were run independently 10 times using an admix- ture model. For the detection of the most probable value of K which is ΔK we used the STRU CTU RE HARVESTER website (http://taylo r0.biolo gy.ucla.edu/struc tureH arves ter/) [12].
We examined the allele variation of Xgwm261 locus in our wheat collection with PCR reaction as well. For this analysis we made DNA extractions from wheat seedlings with the aid of Wizard® Genomic DNA Purification Kit (Promega) according to manufacturer instruction. The PCR reaction volumes were 20 μl and each reaction contained 50 ng template DNA, 10 μl DreamTaq™ PCR Master Mix (2x) and 1-1 μl from the 10 μM primers stocks of the Xgwm- F (5′-GGT CAC TGG TGG TCT GTG ) and Xgwm-R (5′-CTC GCG CTA CTA GCC ATT ). The PCR program started with 3 min denaturation on 94 °C and consisted of 45 cycles of
94 °C for 1 min, 55 °C 1 min and 72 °C for 1 min and a final extension step of 72 °C for 10 min. The PCR products were separated by QIAxcel Advanced capillary electrophoresis
system with the QIAxcel DNA High Resolution Cartridge (Qiagen).
Furthermore, we conducted a Principal Component Anal- ysis (PCA) with the aid of TASSEL (v5.2.51) software in
Table 1 List of the wheat genotypes
ID refers to ID in PCA-plot (Figs. 1, 2). Year refers to the year of registration. POP refers to the subgroups according to Structure results
ID Genotype Origine Year Xgwm 261
alleles POP ID Genotype Origine Year Xgwm 261
alleles POP
1 GK Julidur Szeged 2012 165 1 44 GK Tisza Szeged 2003 192 3
2 Ati/Capo Szeged – 198 3 45 GK Verecke Szeged 1999 174 3
3 GK 05.12 Szeged – 174 1 46 GK Vitorlás Szeged 2010 198 3
4 GK 06.14 Szeged – 192 1 47 GK Zombor Szeged 1985 192 3
5 GK 09.15 Szeged – 192 3 48 GK Zugoly Szeged 1993 192 2
6 GK 16.15 Szeged – 174 1 49 PR E Szeged – 192 2
7 GK 18.14 Szeged – 192 3 50 PR163 Szeged – 198 3
8 GK 20.15 Szeged – 174 3 51 PR17 Szeged – 198 3
9 GK 22.14 Szeged – 174 1 52 PR19 Szeged – 198 3
10 GK 27.15 Szeged – 192 3 53 PR223 Szeged – 198 3
11 GK 28.15 Szeged – 192 1 54 Szín2 Szeged – 200 3
12 GK 35.14 Szeged – 174 1 55 Szín6 Szeged – 198 3
13 GK 41.15 Szeged – 200 3 56 Bánkúti 1201 Martonvásár 1931 192 3
14 GK 51.15 Szeged – 174 2 57 Mv 07.13 Martonvásár – 192 3
15 GK Arató Szeged 2016 165 1 58 Mv 08.13 Martonvásár – 174 3
16 GK Ati Szeged 2001 192 2 59 Mv 14.13 Martonvásár – 174 3
17 GK Bagó Szeged 2016 200 2 60 Mv Béres Martonvásár 2003 192 3
18 GK Bakony Szeged 2015 192 2 61 Mv Bodri Martonvásár 2008 192 3
19 GK Békés Szeged 2005 192 2 62 Mv Csárdás Martonvásár 1999 192 3
20 GK Berény Szeged 2010 174 2 63 Mv Emese Martonvásár 2000 192 3
21 GK Csillag Szeged 2005 192 2 64 Mv Ikva Martonvásár 2015 174 3
22 GK Élet Szeged 1996 192 1 65 MV Ispán Martonvásár 2015 174 1
23 GK Fény Szeged 2006 192 2 66 MV Karéj Martonvásár 2011 192 3
24 GK Futár Szeged 2011 192 2 67 Mv Karizma Martonvásár 2009 192 3
25 GK Garaboly Szeged 1998 192 2 68 Mv Kikelet Martonvásár 2010 192 3
26 GK Göncöl Szeged 2009 192 2 69 MV Kokárda Martonvásár 2012 192 3
27 GK Hajnal Szeged 2010 192 2 70 Mv Kolo Martonvásár 2006 174 3
28 GK Hattyú Szeged 2002 174 1 71 MV Kolompos Martonvásár 2009 174 1
29 GK Holló Szeged 2001 192 2 72 MV Krajcár Martonvásár 2013 174 1
30 GK Hunyad Szeged 2005 174 1 73 MV Lepény Martonvásár 2011 200 1
31 GK Kalász Szeged 1996 192 2 74 MV Lucilla Martonvásár 2007 198 3
32 GK Kapos Szeged 2003 174 3 75 Mv Magdaléna Martonvásár 1996 198 3
33 GK Kincső Szeged 1984 192 1 76 Mv Mente Martonvásár 2015 165 1
34 GK Körös Szeged 2010 192 3 77 Mv Nádor Martonvásár 2012 192 3
35 GK Március Szeged 2008 198 3 78 Mv Pántlika Martonvásár 2012 192 3
36 GK Mini Manó Szeged – 192 2 79 Mv Pengő Martonvásár 2012 192 3
37 GK Petur Szeged 1999 192 1 80 MV Suba Martonvásár 2002 198 3
38 GK Pilis Szeged 2013 192 2 81 Mv Tallér Martonvásár 2010 200 3
39 GK Rába Szeged 2000 192 1 82 Mv Toldi Martonvásár 2008 192 3
40 GK Rozi Szeged 2010 192 2 83 KG Kunglória Karcag 2005 174 1
41 GK Ságvári Szeged 1982 192 3 84 KG Kunhalom Karcag 2002 192 3
42 GK Szilárd Szeged 2013 192 1 85 KG Széphalom Karcag 2004 192 3
43 GK Tavasz Szeged 1996 192 3 192 3
order to compare the population structure outcome, with the one, which resulted by STRU CTU RE analyses [4]. Com- parison on the basis of Xgwm261 locus was also performed.
For the visualization of these results we used the GraphPad Prism (v8.1.2) software.
Results
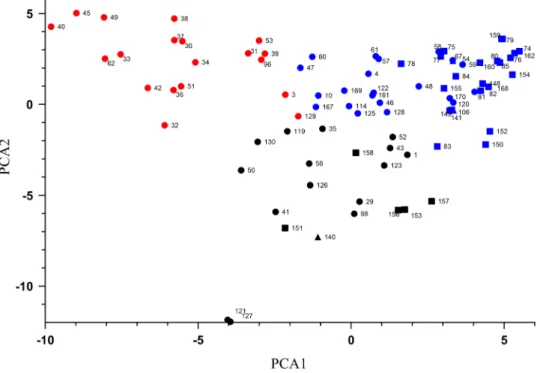
Population structure of the 85 genotypes was examined by STRU CTU RE (v2.3.4) software, utilizing data deriv- ing from LGC Genomics, using 1920 KASP markers. The number of subpopulations (K) were determined by calculat- ing the ΔK values by STRU CTU RE HARVESTER. These analyses showed 3 subgroups in our wheat population so these 3 subgroups were further analysed by Bayesian clus- tering, calculating the Q matrix in Structure v2.3.4. These Q-values showed the level of relatedness in case of these genotypes to the 3 defined subgroups. Most of the geno- types (45) belonged to the subgroup 3 (GrIII) and the other 2 subgroups were almost equal in number, having 21 and 19 genotypes, named subgroup 1 (GrI) and 2 (GrII) respectively (Table 1.). Considering the composition of the 3 subgroups we could conclude that the GrI and GrIII subgroups con- tained genotypes from all three origins. Genotypes, origi- nated from Martonvásár and Karcag, mostly belonged to the GrIII, and genotypes from Szeged could be found also, in equal number to samples from Martonvásár. In the GrII only genotypes from Szeged were presented. After assigning the origins and the resulted subgroups to the results of the PCA analysis, we could see the correlation (Fig. 1).
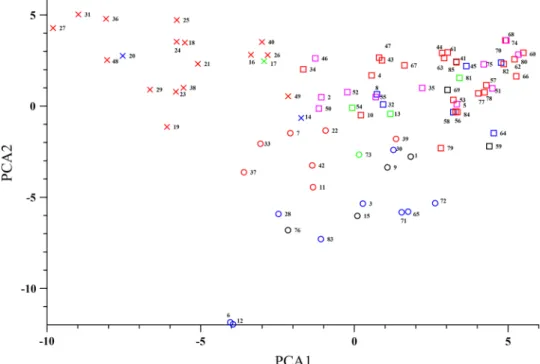
On the basis of the examination the Xgwm261 locus, we could observe 5 size variant products. Among these 5 alleles, the 174 bp (22.35%), 192 bp (55.29%), and 198 bp (12.94%) long ones were found to be the most frequently presented in the investigated population. The 165 bp and 200 bp alleles were less numerous, with 3.52% and 5.88%
occurrence respectively (Table 1.). We examined the distri- bution of these alleles within the 3 subgroups resulted by STRU CTU RE analysis, by assigning the allele-types to sub- group on the PCA output (Fig. 2). These results showed that 16 of the 19 genotypes displaying the 192 bp band belonged to GrII. The most abundant allele was the 174 bp in the case of GrI while in the GrIII it was the 192 bp similar to GrII.
Discussion
In the recent years several studies investigated the genetic diversity and the population structure of wheat [3, 5, 7, 10, 16, 19, 34]. Despite these investigations we still have poor knowledge about this field [5]. These investigations focused on bread wheat originated from the United States, Europe, India, Turkey and China, but the Hungarian genotypes have very low significance in these approaches. The growing number of germplasm exchange between breeding centres could affect the historical structure of genetic diversity.
Development of SNP arrays was the major breakthrough in wheat genotyping, which were aid to modern genomics approaches that has the ability towards the high-throughput and high-density genotyping platforms [33]. LGC Genomics offer one of these SNP array genotyping platforms, which
Fig. 1 Structure analysis of the examined genotypes based on SNP data, visualised by PCA.
Numbers refer to the genotypes described in Table 1. Coloured according to geographical origin
was used for our studies in order to determine the population structure of 85 Hungarian wheat varieties from 3 different Hungarian breeding programmes (Szeged, Martonvásár and Karcag).
Data analysis, which were conducted with the STRU CTU RE, STRU CTU RE HARVESTER and the TASSEL software’s we could conclude that the GrI and GrII con- tained mostly genotypes that has been breed by the breeders of Cereal Research Non-Profit Ltd. company. Almost all of the genotypes, that originated from Martonvásár belonged to the GrIII subgroup. As we also saw this phenomenon in case of the Karcag breeding programme. Based on the available pedigree data we could conclude that the GrI subgroup con- tained genotypes from West-European progenitors. These genotypes for instance GK Arató, GK Petur or GK Kincső.
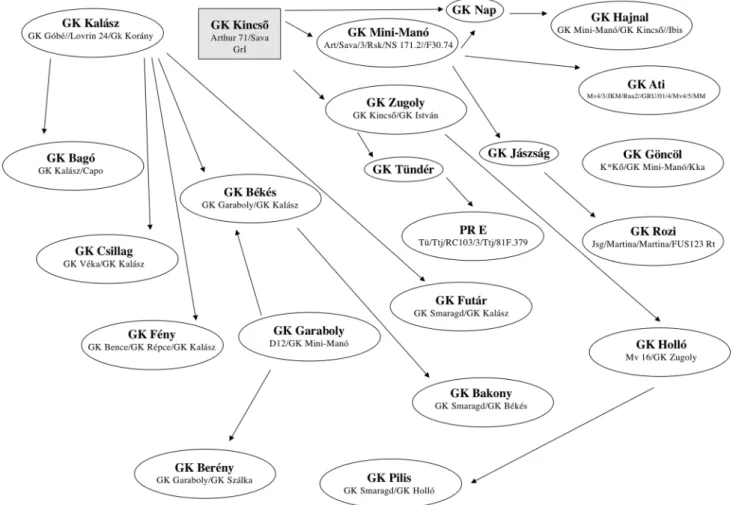
It is interesting, that in spite of GK Kincső belonged to the GrI, the descendants consist the main part of GrII (Fig. 3.).
The most dominant genotypes of this subgroup were GK Kalász, GK Mini Manó and GK Garaboly.
GrIII subgroup consisted different origin genotypes from the Szeged breeding programme. GK Március, GK Tavasz, GK Körös, Szín2, Szín6 and all the genotypes from the pre- breeding programme (PR) mainly originated from the west- ern hemisphere (Brazil, Mexico, US, Chile). Old varieties, like GK Verecke, GK Zombor, GK Tisza and GK Ságvári have East European (Soviet Union) progenitors.
We also performed the detection of dwarfing gene Rht8 with the microsatellite marker Xgwm261 which has been widely used for this purpose [1, 11, 25, 28, 36]. It has been described previously, that it has 3 major alleles that generates of 165, 174 or 192 bp products after PCR [25, 29]. These band sizes partially correspond with those in our study (Fig. 1.), except for the 165 bp band, which appearance is relatively low, only 3.52%. But in our case the 198 bp allele has higher abundance than the 165 bp allele. The Rht8 associated 192 bp band is widespread among wheat varieties from South-East Europe. This is corresponding well with the results of Nielsen et al. [19] who also found the majority of this band size in case of Hungarian genotypes. Furthermore, their result showed that most of the varieties with 174 bp alleles originated from West- ern Europe and formed a separate subgroup [29]. In our case we found that the majority of 174 bp allele in GrI, which group contains certain genotypes with Western European progenitors according the pedigree data. All these results are supporting the idea, that breeding for specific Rht8 alleles has contributed the genetic structure observed within our population [19].
The present study confirms that population structure and genotype relatedness with molecular markers are consistent with the geography origin and available pedigree data. All these results could help the work of wheat breeders and would also provide a stable base for a future implementation of asso- ciation mapping work.
Fig. 2 Allele distribution of the Xgwm261 locus, based on Principal Component Analyses.
Numbers refer to the genotypes described in Table 1. Coloured by the band size of the Rht8 marker Xgwm261
Acknowledgements Open access funding provided by National Agri- cultural Research and Innovation Centre (NAIK). This research was supported by the GINOP 2.2.1-15-2016-00021 project. Peter Körmöc- zi’s work was supported by the NTP-NFTÖ-18 project by the Hungar- ian Ministry of Human Capacities.
Open Access This article is licensed under a Creative Commons Attri- bution 4.0 International License, which permits use, sharing, adapta- tion, distribution and reproduction in any medium or format, as long as you give appropriate credit to the original author(s) and the source, provide a link to the Creative Commons licence, and indicate if changes were made. The images or other third party material in this article are included in the article’s Creative Commons licence, unless indicated otherwise in a credit line to the material. If material is not included in the article’s Creative Commons licence and your intended use is not permitted by statutory regulation or exceeds the permitted use, you will need to obtain permission directly from the copyright holder. To view a copy of this licence, visit http://creativecommons.org/licenses/by/4.0/.
References
1. Bakshi S, Bhagwat S (2012) Allelic variations at Xgwm261 locus, sequence determination and agronomic evaluation in Indian bread wheat genotypes. Cereal Res Commun 40:34–43
2. Barrett BA, Kidwell KK (1998) AFLP-based genetic diversity assessment among wheat cultivars from the Pacific Northwest.
Crop Sci 38:1261–1271
3. Benson J, Brown-Guedira G, Paul Murphy J, Sneller C (2012) Population structure, linkage disequilibrium, and genetic diversity in soft winter wheat enriched for fusarium head blight resistance.
The Plant Genome 5:71–80
4. Bradbury PJ, Zhang Z, Kroon DE, Casstevens TM, Ramdoss Y, Buckler ES (2007) TASSEL: software for association mapping of complex traits in diverse samples. Bioinformatics 23:2633–2635 5. Brbaklić L, Trkulja D, Kondić-Špika A, Mikić S, Tomičić M,
Kobiljski B (2014) Determination of population structure of wheat core collection for association mapping. Cereal Res Commun 43:22–28
6. Buckler ES IV, Thornsberry JM (2002) Plant molecular diversity and applications to genomics. Curr Opin Plant Biol 5:107–111 7. Chao S, Dubcovsky J, Dvorak J, Luo M, Baenziger SP, Matnyazov
R, Clark DR, Talbert LE, Anderson JA, Dreisigacker S, Glover K, Chen J, Campbell K, Bruckner PL, Rudd JC, Haley CS, Carver BF, Perry S, Sorrells ME, Akhunov ED (2010) Population- and genome-specific patterns of linkage disequilibrium and SNP vari- ation in spring and winter wheat (Triticum aestivum L.). BMC Genom 11:727–744
8. Chao S, Zhang W, Akhunov E, Sherman J, Ma Y, Luo MC, Dub- covsky J (2009) Analysis of gene-derived SNP marker polymor- phism in US wheat (Triticum aestivum L.) cultivars. Mol Breed 23:23–33
Fig. 3 Relation between the Szeged-bred wheat cultivars and their connection to GK Kincső
9. Charmet G (2011) Wheat domestication: lessons for the future. C R Biol 334(3):212–220
10. Chen X, Min D, Yasir TA, Hu YG (2012) Genetic diversity, popu- lation structure and linkage disequilibrium in elite Chinese winter wheat investigated with SSR markers. PLoS One 7(9):e44510 11. Dvojković K, Šatović Z, Drezner G, Somers DJ, Lalić A,
Novoselić D, Šarčević H (2010) Allelic variability of Croatian wheat cultivars at the microsatellite locus Xgwm261. Poljo- privreda 16:32–37
12. Earl DA (2012) STRU CTU RE HARVESTER: a website and pro- gram for visualizing STRU CTU RE output and implementing the Evanno method. Conserv Genet Resour 4:359–361
13. Garris AJ, McCOUCH SR, Kresovich S (2003) Population struc- ture and its effect on haplotype diversity and linkage disequilib- rium surrounding the xa5 locus of rice (Oryza sativa L.). Genetics 165:759–769
14. Hao C, Wang L, Ge H, Dong Y, Zhang X (2011) Genetic diver- sity and linkage disequilibrium in Chinese bread wheat (Triticum aestivum L.) revealed by SSR markers. PLoS One 6(2):e17279 15. Hoisington D, Khairallah M, Reeves T, Ribaut JM, Skovmand
B, Taba S, Warburton M (1999) Plant genetic resources: what can they contribute toward increased crop productivity? Proc Natl Acad Sci USA 96:5937–5943
16. Khan MK, Pandey A, Thomas G, Akkaya MS, Kayis SA, Ozsen- soy Y, Hakki EE (2015) Genetic diversity and population structure of wheat in India and Turkey. AoB Plants 7:plv083
17. Kumpatla SP, Buyyarapu R, Abdurakhmonov IY, Mammadov JA (2012) Genomics-assisted plant breeding in the 21st century: tech- nological advances and progress. In: Plant breeding. Intechopen.
http://www.intec hopen .com/books /plant -breed ing/genom ics-assis ted-plant -breed ing-in-the-21st-centu rytec hnolo gical -advan ces- and-progr ess
18. Liu Y, Liu D, Zhang H, Wang J, Sun J, Guo X (2005) Allelic variation, sequence determination and microsatellite screening at the Xgwm261 in Chinese hexaploid wheat (Triticum aestivum) varieties. Euphytica 145:103–112
19. Nielsen NH, Backes G, Stougaard J, Andersen SU, Jahoor A (2014) Genetic diversity and population structure analysis of European hexaploid bread wheat (Triticum aestivum L.) varie- ties. PLoS ONE 9:e94000
20. Pritchard JK, Rosenberg NA (1999) Use of unlinked genetic mark- ers to detect population stratification in association studies. Am J Hum Genet 65:220–228
21. Pritchard JK, Stephens M, Donnelly P (2000) Inference of population structure using multilocus genotype data. Genetics 155:945–959
22. Rafalski A (2002) Applications of single nucleotide polymor- phisms in crop genetics. Curr Opin Plant Biol 5:94–100
23. Roussel V, Leisova L, Exbrayat F, Stehno Z, Balfourier F (2005) SSR allelic diversity changes in 480 European bread
wheat varieties released from 1840 to 2000. Theor Appl Genet 111:162–170
24. Schlötterer C (2004) The evolution of molecular markers—just a matter of fashion? Nat Rev Genet 5:63
25. Schmidt AL, Gale KR, Ellis MH, Giffard PM (2004) Sequence variation at a microsatellite locus (XGWM261) in hexaploid wheat (Triticum aestivum) varieties. Euphytica 135:239–246
26. Semagn K, Babu R, Hearne S, Olsen M (2014) Single nucleotide polymorphism genotyping using Kompetitive Allele Specific PCR (KASP): overview of the technology and its application in crop improvement. Mol Breed 33:1–14
27. Vignal A, Milan D, SanCristobal M, Eggen A (2002) A review on SNP and other types of molecular markers and their use in animal genetics. Genet Sel Evol 34:275
28. Worland AJ, Korzun V, Röder MS, Ganal MW, Law CN (1998) Genetic analysis of the dwarfing gene Rht8 in wheat. Part II. The distribution and adaptive significance of allelic variants at the Rht8 locus of wheat as revealed by microsatellite screening. Theor Appl Genet 96:1110–1120
29. Worland AJ, Sayers EJ, Korzun V (2001) Allelic variation at the dwarfing gene Rht8 locus and its significance in international breeding programmes. Euphytica 119:157–161
30. Worland AJ, Law CN (1986) Genetic analysis of chromosome 2D of wheat. The location of genes accelerat- ing height, day length insensitivity and yellow rust resistance. Z Pflanzenzuchtg 96:331–345
31. Worland AJ, Law CN, Petrovic S (1988a) Pleiotropic affects of the chromosome 2D genes Ppd1, Rht8 and Yr16. In: Miller TE, Koebner RMD (eds) Proceedings of the Seventh International Wheat Genetics Sym- posium. Cambridge, UK, pp 669–674 32. Worland AJ, Law CN, Petrovic S (1988b) Genetic analysis of
chromosome 2D of wheat. II. The importance of this chromosome to Yugoslavian varieties. Plant Breed. 100:247–259
33. Würschum T, Langer SM, Longin CFH, Korzun V, Akhunov E, Ebmeyer E, Reif JC (2013) Population structure, genetic diversity and linkage disequilibrium in elite winter wheat assessed with SNP and SSR markers. Theor Appl Genet 126:1477–1486 34. Zhang D, Bai GH, Chengsong A, Yu JB, Carver BF (2010)
Genetic diversity, population structure, and linkage disequilibrium in U.S. elite winter wheat. Plant Genome 3:117–127
35. Zhang X, Yang S, Zhou Y, Xia X, He Z (2007) Distribution of the RhtB1b, RhtD1b and Rht8 reduced height genes in autumn- sown Chinese wheats detected by molecular markers. Euphytica 152:109–116
36. Zheleva D, Todorovska E, Jacquemin JM, Atanassov A, Christov N, Panayotov I, Tsenov N (2006) Allele distribution at microsatel- lite locus xgwm 261 marking the dwarfing gene rht8 in hexaploid wheat from bulgarian and belgian gene bank collections and its application in breeding programs. Biotechnol Biotechnol Equip 20:45–56