Genetic Diversity in Wild Diploid Wheat T. urartu Revealed by SSR Markers
M. AbbAsov1,2*
1Genetic Resources Institute of ANAS, Baku, AZ1106, Azerbaijan
2Baku State University, Baku, Azerbaijan (Received 22 November 2017; Accepted 25 April 2018;
Communicated by I. Molnár)
Genetic diversity of 74 T. urartu genotypes was studied using 11 SSR (simple sequence repeats) markers. The number of alleles ranged from 4 to 15, with an average of 8 alleles per primer. The mean values for the expected heterozygosity (He) and polymorphism informa- tion content (PIC) over all loci and populations were 0.56 and 0.52, respectively. From a geographic viewpoint the higher diversities were observed in Jordan, followed by Syria and Turkey. Diversity revealed within countries was higher than among them, even in the same regions of the relevant countries. The analysis of mo lecular variance revealed that most of the genetic vari ability was accounted for by differences within populations (90%), with less variability among them (10%). The dendrogram generated based on Nei’s dissimilarity matrix revealed three main clusters for which the grouping patterns were not clearly associ- ated with the geographic origins, indicating the gene flow among different countries.
Principal coordinate analysis (PCoA) confirmed subgrouping obtained by cluster analysis. In general, genetic distances between geographic regions were low or moderate, which was also supported by low values of pairwise Fst. Our findings can direct the sampling strategies on T. urartu in studied regions to find beneficial alleles. The heterotic groups detected by cluster and PCoA analysis in the present study can serve as effective candidates in crossing programs to broaden the genetic base in T. urartu.
Keywords: wheat, T. urartu, SSR, PIC, genetic diversity
Introduction
Wheat is the most widely grown crop in the world, demand for which is expected to in- crease by 60% in 2050. So, there is an endless need to increase the productivity and toler- ance to abiotic and biotic factors to develop more sustainable wheat production. This improvement program should cover all wheat types (bread wheat, durum wheat, wild relatives) and all levels of variations from morphology to genomics. The use of wild rela- tives of wheat is also of strategic importance, as they possess rich allelic diversity for numerous important traits, as well as stress tolerance (Rouse and Jin 2011; Guzmán and Alvarez 2012).
*Corresponding author; E-mail: mehraj_genetic@yahoo.com
AbbAsov: Genetic Diversity in Wild Diploid Wheat T. urartu Revealed by SSR Markers 581
Cereal Research Communications 46, 2018
Triticum urartu is a wild diploid wheat (2n = 2x = 14) first described in 1938 as a rare endemic species of Transcaucasia (Jakubizner 1959). Later some populations were also found in Turkey, Lebanon and Iraq (Johnson 1975).
The genus Triticum L. includes the genomes Au, Ab, B, D, G. Of these, the only actual wheat genomes are Au and Ab. Triticum urartu is considered to be the Au genome donor for all polyploidy wheats (Dvorak et al. 1993). Several investigations supported that A genome carries important genes responsible for adult plant resistance (Helguera et al.
2000), flour color (Parker and Langridge 2000), sprouting resistance (Zanetti et al. 2000), cold tolerance (Vagujfalvi et al. 2000), heading date and plant height (Yuanwu and Yujun 1995; Ehtemam et al. 2010). Thus, significant importance should be given to T. urartu both as a rich source of important genes for broadening the genetic variation in cultivated wheats and for establishing the phylogeny of the genus Triticum. However, genetic diver- sity of T. urartu has not been well investigated as compared with other diploids (Wang et al. 2017).
Nowadays, DNA markers provide a good estimate of genetic diversity since they are not affected by the environment and can cover whole genome (Naghavi et al. 2009;
Izzatullayeva et al. 2014; Hajiyev et al. 2015). Limited number of studies was carried out in T. urartu using various DNA markers such as restriction fragment length polymor- phism (RFLP), random amplified polymorphic DNA (RAPD), amplified fragment length polymorphism (AFLP) and simple sequence repeats (SSR) (Vierling and Nguyen 1992;
Dhaliwal et al. 1993; Moghaddam et al. 2000; Aliyev et al. 2007; Baum and Bailey 2013;
Wang et al. 2017). Simple sequence repeats are allele-specific and co-dominant molecular markers, widely applied in cultivar identity verification, diversity studies and linkage map construction in wheat (Varshney et al. 2001; Huang et al. 2002).
The objective of the current study was the assessment of the genetic variation among and within different populations and accessions of T. urartu collected from different lo- calities and countries using SSR markers.
Materials and Methods Plant material
Seventy four accessions of T. urartu were used as a research material. Of 74 accessions 31 were from Syria (SYR), 18 from Turkey (TUR), 10 from Lebanon (LBN), 10 from Jordan (JOR), 2 from Armenia (ARM). Three countries – Iran (IRN), Iraq (IRG) and Saudi Arabia (SAR) were presented by one genotype each. Accession number, countries of origin and collection sites were given in Table S1*.
Genomic DNA isolation was conducted following a CTAB protocol. A set of 11 SSR markers mapped to A and B genomes (Table 1) were selected for genotyping. PCR condi- tions for fluorescent-dye labeled primers were as follows: initial denaturation at 95 °C for 3 min; 40 cycles of denaturation at 95 °C for 1 min, annealing at 50 °C for 1 min and elongation at 72 °C for 2 min; final elongation at 72 °C for 10 min. DNA fragments were
*Further details about the Electronic Supplementary Material (ESM) can be found at the end of the article.
Table 1. Summary statistics of the 11 SSR markers used in the study MarkerForward 5‘ 3‘Reverse 5‘ 3‘Chromosome locationAllele NoMajor Allele Freq.HoHePIC barc-213GCGTAGATTCTCG GTTTGTTGGCTTGC CCGTCCCTCC TTCCTGGTCT
1AL150.190.010.880.87 barc-15
ATGCAAAGGC CGGGGTT
ATCCACCTCTAGCCTA CGCCAACATT2AL80.600.240.600.56 barc-1021
GGAAGGACCTGA CTGACTGCA
TCTGGCGATCACAACCAA ATTCTT TTTAAC TA3AL60.810.080.320.30 barc-206
GCTTTGCCAGG TGAGCACTCT
TGGCCGGGTATTT GAGTTGGAGTTT4AS70.490.610.670.62 barc-117TCATGCGTGCT AAGTGCTAA
GAGGGCAGGA AAAAGTGACT
5AS60.530.590.600.52 barc-174TGGCATTTTTCT AGCACCAATACAT
GCGAACTGGACCAG CCTTCT
ATCTGTTC1BL110.410.760.700.65 barc-200GCGATATGATTT GGAGCTGATTGGCGATGACGTTAG ATGCGGAATTGT2 BS40.790.320.340.29 barc-101
GCTCCTCTCACG AGCGAGTCGATCACA 2BL60.620.220.560.52 TCACGCAAAGCTATGAGCCAATG barc-142
CCGGTGAGA GGACT
AAAA
GGCCTGTCA A5 BL80.480.010.720.69 TTATGAGC GTAACTTGTTG gwm-361 CCAAAGGGG
ACAAAGTGGC AAAAGGAGACA
6BS80.750.270.430.41 gwm-219GATGAGCGA CACCTAGCCTC
GGGGTCCGA GTCCACAAC
6B40.770.020.370.33 Mean80.580.290.560.52 Total83
AbbAsov: Genetic Diversity in Wild Diploid Wheat T. Urartu Revealed by SSR Markers 583 separated on an ABI 3130xl Genetic Analyzer (Applied Biosystems/Thermo Fisher Sci- entifics) (Chao et al. 2007). Fragment analysis and allele calling were performed using GeneMapper software v.3.7 (Applied Biosystems).
Data analysis
Measures of genetic diversity, i.e. total number of alleles, expected heterozigosity (He), observed heterozigosity (Ho) and polymorphism information content (PIC) were esti- mated using PowerMarker v. 3.51 (Liu and Muse 2005). PowerMarker software was also used to calculate allele frequencies, distances based on frequencies and the fixation indi- ces (Fst) among different countries. Cluster analysis, PCoA analysis and Neighbour-join- ing tree were done using software package DARwin 6.0 (Perrier and Jacquemoud-Collet 2006).
Results
A total of 83 alleles were amplified among 74 T. urartu genotypes using 11 SSR primers.
The number of fragments per primer ranged from 4 (barc-200 and barc-209) to 15
Figure 1. Dendrogram showing genetic relationship among 74 T. urartu accessions based on Nei’s genetic distance. Different colors indicate different countries (SYR – black, TUR – green, JOR – red, LBN – violet,
ARM – blue, IRN – yellow, IRG – light blue, SAR – dark yellow)
(barc-213), with the average number being 8 (Table 1). Major allele frequency in the cur- rent study varied from 0.19 to 0.81, averaging 0.58. Twenty five alleles were found to be rare with a frequency of less than 1%. Observed heterozygosity ranged from 0.01 to 0.76, with the most heterozygous locus to be Xbarc-174. The microsatellite barc-213 had the highest He value (He = 0.88), whereas the lowest value was recorded for primer barc- 1021 (He = 0.32). The mean observed (Ho) and expected heterozygosity (He) for the 11 loci were 0.29 and 0.56, respectively. PIC values of each marker locus ranged from 0.29
Table 2. Summary statistics for different subsets of T. urartu accessions Subsets Sample size Allele No Major al freq. HO HE PIC
SYR 31 5.6 0.58 0.28 0.56 0.51
TUR 18 4.5 0.64 0.29 0.51 0.47
LBN 10 3.3 0.65 0.34 0.45 0.40
JOR 10 4.0 0.57 0.28 0.58 0.53
ARM 2 1.5 0.80 0.32 0.24 0.19
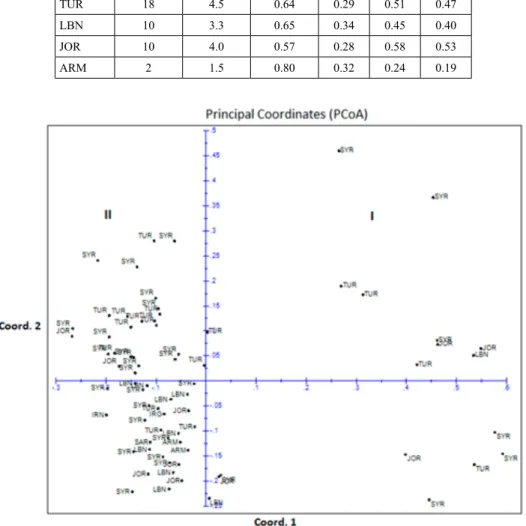
Figure 2. Scatter plot of the first two principal coordinate analysis axes of 74 T. urartu accessions generated from genetic distance calculations using 11 SSR markers
AbbAsov: Genetic Diversity in Wild Diploid Wheat T. urartu Revealed by SSR Markers 585
Cereal Research Communications 46, 2018
(barc 200) to 0.87 (barc 213) with an average value of 0.52. Out of 11 primer pairs, 7 were highly informative with PIC ≥ 0.5 and the remaining 4 were moderately informative with 0.25 < PIC < 0.50 (Table 1). The highest genetic variation was found in T. urartu acces- sions of Jordan origin (He = 0.58; PIC = 0.53) (Table 2).
Pair-wise dissimilarity (GD) among 74 accessions ranged from 0 to 1. The smallest genetic distance was noted between genotype pairs 45476 and 110835 of Lebanon origin and between 45484 (Syria) and 45472 (Lebanon). The dendrogram based on Nei’s dis- similarity matrix revealed three main clusters with a different number of subclusters in each (Fig. 1). Cluster I was further divided into two major subclusters with quite large inter subcluster distance (GD ≥ 0.6), indicating wider genetic divergence among them, while smaller distances were noted among groups of two other clusters. PCoA analysis revealed two main distinct groups for the entire population and confirmed subgrouping obtained by cluster analysis (Fig. 2). The first two coordinates explained 21% and 9% of the total variation, followed by 6.7%, 5.4% and 4.6% in third, fourth and fifth coordinates,
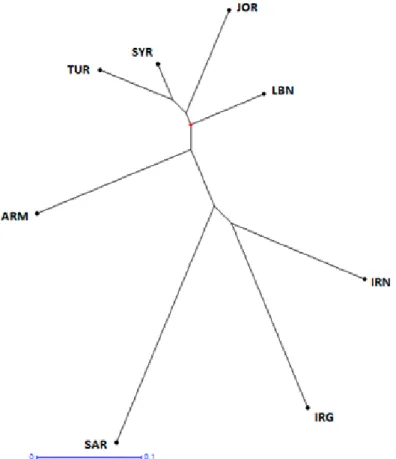
Figure 3. Dendrogram of T. urartu accessions from 8 countries based on Nei’s genetic distance
respectively. No significant association was found between the grouping of accessions and geographic origins based on both cluster and PCoA analyses.
The NJ tree was constructed based on Nei’s genetic distances that visually demon- strated the relationship among the eight geographic regions (Fig. 3). The genotypes from Turkey were very similar to Syrian genotypes with the lowest genetic distance (GD = 0.113), while the highest distance was noted between Turkey and Saudi Arabia (GD = 0.491) (Table 3). The Fst value ranged from 0.022 to 0.366 and was in accordance with the genetic distances.
Discussion
SSR markers have been widely used to evaluate genetic diversity in different plant spe- cies (Babayeva et al. 2009; Ehtemam et al. 2010; Ganapathy et al. 2012). Several studies also demonstrated that SSR markers were more effective in detecting genetic variability and relationship than other marker systems (Naghavi et al. 2004; Medini et al. 2005).
Investigation of genomic relationships of wheat relatives is extremely important for es- tablishing the evolutionary way of the formation of cultivated forms of Triticum.
In the current study, the eleven SSR primers revealed 83 alleles among 74 T. urartu accessions representing 8 countries. On average, 8 alleles were amplified by each of SSR marker (Table 1). This was higher than the one reported for 49 T. urartu accessions using RAPD markers (Castagna et al. 1997). Other researchers reported averages of 8 to 19 al- leles per locus in various T. urartu collections (Hammer et al. 2000; Wang et al. 2017) using SSR markers. Rare alleles were detected for all loci except Xbarc-206. These alleles could be used as molecular identity data for specific genotypes (Ren et al. 2014). The main parameters of genetic diversity He and PIC were higher for most of the studied loci.
The mean values for He and PIC over all loci and populations were 0.56 and 0.52, respec- tively, which can be estimated as high values. Thus, SSR markers prove its efficiency in studying genetic diversity in T. urartu even with a relatively small number of primers.
However, the diversity in the current study was relatively lower than that reported by
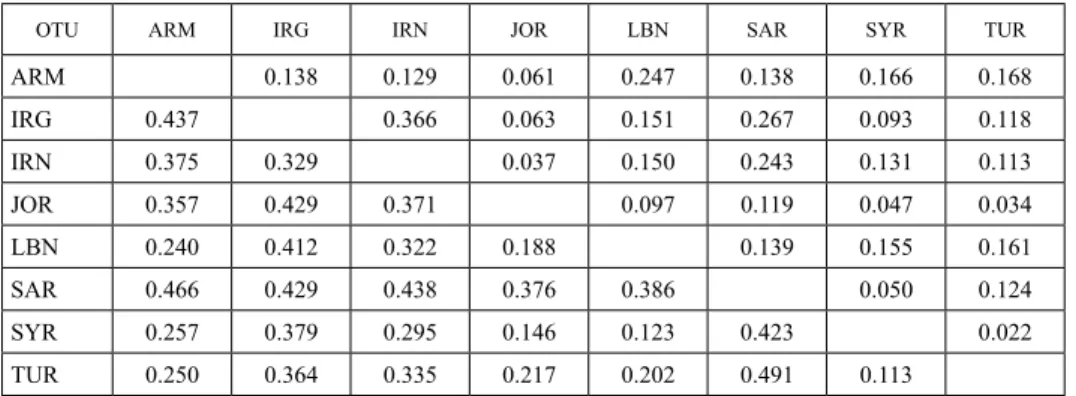
Table 3. Pairwise estimates of Nei’s genetic distance (a lower diagonal matrix) and Fst (an upper diagonal matrix) among studied regions
OTU ARM IRG IRN JOR LBN SAR SYR TUR
ARM 0.138 0.129 0.061 0.247 0.138 0.166 0.168
IRG 0.437 0.366 0.063 0.151 0.267 0.093 0.118
IRN 0.375 0.329 0.037 0.150 0.243 0.131 0.113
JOR 0.357 0.429 0.371 0.097 0.119 0.047 0.034
LBN 0.240 0.412 0.322 0.188 0.139 0.155 0.161
SAR 0.466 0.429 0.438 0.376 0.386 0.050 0.124
SYR 0.257 0.379 0.295 0.146 0.123 0.423 0.022
TUR 0.250 0.364 0.335 0.217 0.202 0.491 0.113
AbbAsov: Genetic Diversity in Wild Diploid Wheat T. urartu Revealed by SSR Markers 587
Cereal Research Communications 46, 2018
Wang et al. (2017) for 238 T. urartu genotypes with the use of 62 SSR markers. The con- tradiction can be attributed to the collection size and number of studied loci. High ge- netic diversity in different T. urartu collections was also noted using IRAP markers (Farouji et al. 2015). On the contrary, Moghaddam et al. (2000) reported low gene diver- sity in 23 populations of T. urartu using isozyme markers at eight polymorphic loci.
From a geographic point of view, the highest number of alleles was found in the 31 genotypes of Syrian origin (5.6 alleles), followed by 18 genotypes of Turkey origin (4.5 alleles) (Table 2). However, He and PIC values were not correlated with sample and allele sizes. Thus Jordan subset represented by only 10 accessions exhibited the highest diver- sity. The higher diversities were also observed in Syria and in Turkey. Interestingly, most of the accessions of Lebanon and Turkey and all accessions of Jordan were collected from the same provinces within these countries, although from different altitudes. The high genetic diversity within these countries can be explained by the differences in soil-climat- ic conditions and altitude variation (Table S1). The high diversity in these regions is in agreement with previous reports of Wang et al. (2017), Moghaddam et al. (2000) and Hammer et al. (2000). T. urartu is endemic to the major geographic regions of the Fertile Crescent (Heun et al. 2008), the center of origin and diversity of most species, including wheat. All the mentioned countries are a part of Fertile Crescent, thus, high genetic diver- sity in the region was expected.
The analysis of mo lecular variance also revealed that most of the genetic vari ability was accounted for by differences within countries (90%), with less variability among them (10%) (data not shown). The less variability among countries indicates notable sim- ilarity in allele frequencies.
The level of genetic dissimilarity index in the current study ranged from 0 to 1 with an average of 0.50, suggesting abundant genetic variation in this collection. The studied T. urartu genotypes fell into three main clusters (Fig. 1). In this study, the grouping pat- terns were not clearly associated with the geographic origins. As a result, genotypes from different geographic regions were widely dispersed and did not form main clusters. Nev- ertheless, it is in accordance with Gashaw et al. (2007) who suggested that genotypes from the same region might have the different genetic background and those collected from the different region might have a similar genetic background. Mousavifard et al.
(2015) also demonstrated that T. urartu accessions showed the lowest correlation between genetic diversity and geographic distance. Such occurrence could be due to the gene flow and germplasm movement (Gashaw et al. 2007). A similar finding was also noted in pre- vious reports of Singh et al. (2003) in durum wheat. However, unlike our findings, some previous observations show that SSR markers can differentiate wheat accessions accord- ing to their region of origin (Adary 1978; Wang et al. 2017).
PCoA analysis was in concordance with the cluster analysis (Fig. 2). According to the PCoA analysis, accessions belonging to the first subgroup of Cluster I were clustered much apart from others in the right half part of the scatter plot and formed independent PCoA group (group I). This group was genetically well differentiated from the rest of col- lection. The distances between most genotype pairs within the group were high (GD ≥ 0.5), suggesting that this group is highly diverse. Group I can be used in future breeding pro-
gram, as a crossing of genotypes with high genetic distances may produce a broad-spec- trum of variability in segregating populations (Gashaw et al. 2007). Group II in scatter plot contained rest of the accessions. Most of the accessions of cluster III were placed in the upper left, while the majority of the genotypes from cluster II were placed in below left part of the PCoA plot and was closer to the second subcluster of cluster I.
Table 3 represents Nei’s genetic distances (a lower diagonal matrix) and values of pairwise F-Statistics (Fst) (an upper diagonal matrix) between pairs of geographic regions included in the study. The highest genetic distance among 8 countries was recorded for Turkey and Saudi Arabia and the lowest for Turkey and Syria. Population from Lebanon showed smaller genetic distance with the population of Syria, followed by Jordan. In general, genetic distances between geographic regions were low or moderate (lower than 0.5), which was also supported by low values of pairwise Fst. This once again confirms low diversity among different populations.
In spite of the fact that the germplasms used in the current study were from different countries, most of them represented close geographic locations. For example, Jordan and Lebanon belonged to Eastern Mediterranean coast; longitude values for samples’ collec- tion sites ranged from 35°37’ to 36°10’. All Syrian genotypes, except two, represented mostly southwestern and slightly northwestern part of Syria with longitude values be- tween 36°01’ and 37°39’. Turkey belongs to Mesopotamia region, however, majority of accessions from this country was collected from Gaziantep with collection sites between 36°55’ and 37°35’. Relatively close locations of these regions confirm the high possibil- ity of gene flow and migration among them. This, in turn, can result in high similarities and low diversity among these four countries as in case of our study. Similarly, Wang et al. (2017) reported low diversity between Lebanon and southwestern Syrian samples based on SSR data.
In the NJ tree, constructed based on Nei’s genetic distances, Turkey, Syria, Jordan and Lebanon were relatively close, followed by Armenian genotypes (Fig. 3). Iran, Iraq and Saudi Arabia were represented by only one genotype in our study, which makes further discussion of these samples difficult. Future analyses with larger collections of T. urartu from these regions are needed to draw more precise conclusions about the relationship of these collections. However, it would be interesting to note that, longitude values for sam- ples from Iran and Iraq were 41°47’ and 48°28’, respectively.
In conclusion, we have demonstrated the utility of SSR markers in revealing genetic diversity in T. urartu accessions of diverse origin. High variability in the studied collec- tion was detected by only 11 SSR markers, of which 7 markers were the most effective.
Diversity revealed within countries was higher than among them, even in the same re- gions of the relevant countries. Our findings can direct the sampling strategies on T. urar- tu in these regions to find beneficial alleles. On the contrary, diversity between pairs of countries was lower, which can be partially explained by the close location of these re- gions and indicate gene flow among them. The heterotic groups detected by cluster and PCoA analysis in the present study can serve as effective candidates in crossing programs to broaden the genetic base in T. urartu.
AbbAsov: Genetic Diversity in Wild Diploid Wheat T. urartu Revealed by SSR Markers 589
Cereal Research Communications 46, 2018
References
Adary, A.H. 1978. Genetic variation in landraces of durum wheat and its value in durum wheat improvement.
PhD thesis, California University.
Aliyev, R.T., Abbasov, M.A., Mammadov, A.C. 2007. Genetic identification of diploid and tetraploid wheat species with RAPD markers. Turk. J. Biol. 31(3):173–180.
Babayeva, S., Akparov, Z., Abbasov, M., Mammadov, A., Zaifizadeh, M., Street, K. 2009. Diversity analysis of Central Asia and Caucasian lentil (Lens culinaris Medik.) germplasm using SSR fingerprinting. Genet.
Resour. Crop Ev. 56(3):293–298.
Baum, B.R., Bailey, L.G. 2013. Genetic diversity in the red wild einkorn: T. urartu gandilyan (Poaceae:
Triticeae). Genet. Resour. Crop Ev. 60(1):77–87.
Castagna, R.S., Perenzin, G.M., Heun, M. 1997. Genetic variability of the wild diploid wheat Triticum urartu revealed by RFLP and RAPD markers. Theor. Appl. Genet. 94:424–430.
Chao, S., Zhang, W., Dubcovsky, J., Sorrells, M. 2007. Evaluation of genetic diversity and genome-wide link- age disequilibrium among U.S. wheat (Triticum aestivum L.) germplasm representing different market classes. Crop Sci. 47:1018–1030.
Dhaliwal, H.S., Sidhu, J.S., Minocha, J.L. 1993. Genetic diversity in diploid and hexaploid wheats as revealed by RAPD markers. Crop Improv. 20:17–20.
Dvorák, J., Terlizzi, P., Zhang, H.B., Resta, P. 1993. The evolution of polyploid wheats: identification of the A genome donor species. Genome 36:21–31.
Ehtemam, M.H., Rahiminejad, M.R., Saeidi, H., Tabatabaei, B.E.S., Krattinger, S.G., Keller, B. 2010 Relationships among the A Genomes of Triticum L. Species as Evidenced by SSR Markers, in Iran. Int. J.
Mol. Sci. 11:4309–4325.
Farouji, A.E., Khodayari, H., Saeidi, H., Rahiminejad, M.R. 2015. Genetic diversity of diploid Triticum species in Iran assessed using inter-retroelement amplified polymorphisms (IRAP) markers. Biologia 70(1):52–60.
Ganapathy, K.N., Gomashe, S.S., Rakshit, S., Prabhakar, B., Ambekar, S.S., Ghorade, R.B., Biradar, B.D., Saxena, U., Patil, J.V. 2012. Genetic diversity revealed utility of SSR markers in classifying parental lines and elite genotypes of sorghum (‘Sorghum bicolor’ L. Moench). Aust. J. Crop Sci., 6(11):1486.
Gashaw, A., Mohammed, H., Singh, H. 2007 Genetic divergence in selected durum wheat genotypes of ethio- pian plasm. Afr. Crop Sci. J. 15(2):67–72.
Guzmán, C., Alvarez, J.B. 2012. Molecular characterization of a novel waxy allele (Wx-Au1a) from Triticum urartu Thum. Ex Gandil. Genet. Resour. Crop Ev. 59(6):971–979.
Hajiyev, E.S., Akparov, Z.I., Aliyev, R.T., Saidova, S.V., Izzatullayeva, V.I., Babayeva, S.M., Abbasov, M.A.
2015. Genetic polymorphism of durum wheat (Triticum durum Desf.) accessions of Azerbaijan. Russ. J.
Genet. 51:863–870.
Heun, M., Haldorsen, S., Vollan, K. 2008. Reassessing domestication events in the near east: einkorn and Triticum urartu. Genome 51(6):444–451.
Hammer, K., Filatenko, A.A., Korzun, V. 2000. Microsatellite markers – a new tool for distinguishing diploid wheat species. Genet. Resour. Crop Ev. 47(5):497–505.
Helguera, M., Khan, I.A., Dubcovsky, J. 2000. Development of PCR markers for wheat leaf rust resistance gene Lr47. Theor. Appl. Genet. 101: 625–631.
Huang, X.Q., Börner, A., Röder, M.S., Ganal, M.W. 2002. Assessing genetic diversity of wheat (Triticum aes- tivum L.) germplasm using microsatellite markers. Theor. Appl. Genet. 105:699–707.
Izzatullayeva, V., Akparov, Z., Babayeva, S., Ojaghi, J., Abbasov, M. 2014. Efficiency of using RAPD and ISSR markers in evaluation of genetic diversity in sugar beet. Turk. J. Biol. 38(4):429–438.
Jakubizner, M.M. 1959. New wheat species. In: Jenkins, BC (eds), Proc. 1st Int. Wheat Genet. Symp.
Winnipeg, Canada, pp.207–217.
Johnson, B.L. 1975. Identification of the apparent B-genome donor of wheat. Can. J. Genet. Cytol. 17:21–39.
Liu, K., Muse, S.V. 2005. PowerMarker: Integrated analysis environment for genetic marker data.
Bioinformatics 21:2128–2129.
Medini, M., Hamza, S., Rebai, A., Baum, M. 2005. Analysis of Genetic Diversity in Tunisian Durum Wheat Cultivars and Related Wild Species by SSR and AFLP Markers. Genet. Resour. Crop Ev. 52:21–31.
Moghaddam, M., Ehdaie, B., Waines, J.G. 2000. Genetic diversity in populations of wild diploid wheat Triticum urartu tum. Ex. gandil. Revealed by isozyme markers. Genet. Resour. Crop Ev. 47(3):323–334.
Mousavifard, S.S., Saeidi, H., Rahiminejad, M.R., Shamsadini, M. 2015. Molecular analysis of diversity of diploid Triticum species in Iran using ISSR markers. Genet. Resour. Crop Ev. 62(3):387–394.
Naghavi, M.R., Aghaei, M.J., Taleei, A.R., Omidi, M., Mozafari, J., Hassani, M.E. 2009. Genetic diversity of the D-genome in T. aestivum and Aegilops species using SSR markers. Genet. Resour. Crop Ev. 56(4):499–
Naghavi, M.R., Mardi, M., Ramshini, H.A., Fazelinasab, B. 2004. Comparative Analyses of the Genetic 506.
Diversity among Bread Wheat Genotypes Based on RAPD and SSR Markers. Iran. J. Biotechnol. 2:195–
Parker, G.D., Langridge, P. 2000. Development of a STS marker linked to a major locus controlling flour colour 202.
in wheat (Triticum aestivum L.). Mol. Breeding. 6:169–174.
Perrier, X., Jacquemoud-Collet, J.P. 2006. DARwin software http://darwin.cirad.fr/darwin
Ren, X., Jiang, H., Yan, Z., Chen, Y., Zhou, X., Huang, L., Lei, Y., Huang, J., Yan, L., Qi, Y., Wei, W. 2014.
Genetic diversity and population structure of the major peanut (Arachis hypogaea L.) cultivars grown in China by SSR markers. Plos One 9(2):p.e88091.
Rouse, M.N., Jin, Y. 2011. Stem rust resistance in A-genome diploid relatives of wheat. Plant Dis. 95(8):941–
Singh, R., Kharb, R.P.S., Singh, V. 2003. Genetic divergence study in durum wheat based on seed vigor param-944.
eters. Wheat Inf. Service 96:20–22.
Vagujfalvi, A., Crosatti, C., Galiba, G., Dubcovsky, J., Cattivelli, L. 2000. Two loci on wheat chromosome 5A regulate the differential cold-dependent expression of the cor14b gene in frosttolerant and frost-sensitive genotypes. Mol. Gen. Genet. 263:194–200.
Varshney, R.K., Prasad, M., Roy, J.K., Röder, M.S., Balyan, H.S., Gupta, P.K. 2001. Intregated physical maps of 2DL, 6BS and 7DL carrying loci for grain protein content and preharvest sprouling tolerance in bread wheat. Cereal Res. Commun. 29:33–40.
Vierling, R.A., Nguyen, H.T. 1992. Use of RAPD markers to determine the genetic diversity of diploid wheat genotypes. Theor. Appl. Genet. 84(7):835–838.
Wang, X., Luo, G., Yang, W., Li, Y., Sun, J., Zhan, K., Liu, D., Zhang, A. 2017. Genetic diversity, population structure and marker-trait associations for agronomic and grain traits in wild diploid wheat Triticum urartu.
BMC Plant Biol. 17:112.
Yuanwu, Z., Yujun, Y., 1995. Study on the γ radiosensitivity of monosomic lines of Sumai 3 to radiation from 60Co. Acta Agron. Sinica 21:429–433.
Zanetti, S., Winzeler, M., Keller, M., Keller, B., Messmer, M. 2000. Genetic Analysis of Pre-Harvest Sprouting Resistance in a Wheat 3 Spelt Cross. Crop Sci. 40:1406–1417.
Electronic Supplementary Material (ESM)
Electronic Supplementary Material (ESM) associated with this article can be found at the website of CRC at https://akademiai.com/loi/0806
Electronic Supplementary Table S1. T. urartu accessions used in the study