Viktória Bene, Ildikó Bihari, Ibolya Czibere, Imre Kovách, Boldizsár Megyesi, Viktória Paczári, Beáta Pataki
Factors influencing households’
energy consumption in Hungary
Case-study conducted in the city of Debrecen
We acknowledge financial support from the European Union’s Horizon 2020 research and innovation programme under grant agreement No 723791 – project PENNY „Psychological, social and financial barriers to energy efficiency”
Psychological social & financial barriers to energy efficiency.
DELIVERABLE No D3.2
Factors influencing households’ energy consumption in Hungary Case‐study conducted in the city of Debrecen
Viktória BENE, Ildikó BIHARI, IbolyaCzibere, Imre KOVÁCH, Boldizsár MEGYESI, Viktória PACZÁRI, Beáta PATAKI
Universtiy of Debrecen
Grant Agreement number: 723791
Action title: Psychological social & financial barriers to energy efficiency.
Type of action: RIA (Research and Innovation action) Topic: EE‐08‐2016
Call: H2020‐EE‐2016‐2017 (Energy Efficiency Call 2016‐2017)
Debrecen
2019
The research was financed by the Higher Education Institutional Excellence Programme of the Ministry of Human Capacities in Hungary, within the framework of the Energy thematic programme of the University of Debrecen.
Factors influencing households’
energy consumption in Hungary
Case-study conducted in the city of Debrecen
Viktória Bene Ildikó Bihari Ibolya Czibere
Imre Kovách Boldizsár Megyesi
Viktória Paczári Beáta Pataki
Authors
Cover design, typography and technical editor Edit Marosi
Reviewed by:
Ferencz Zoltán Kőszeghy Lea
ISBN 978-963-318-794-4 (Print) ISBN 978-963-318-795-1 (Online)
Published by Debrecen University Press
Managing Publisher: Gyöngyi Karácsony, Director General Printed by Kapitális Nyomdaipari Kft.
Tartalom
1. THEORETICAL BACKGROUND AND RESEARCH qUESTIONS / 7 1.1. Main research questions / 11
2. METHODS / 13
2.1. Energy use in the PENNY countries / 14
2.2. Socio-demographic characteristics of the respondents / 14 2.3. The characteristics of the homes / 25
2.4. Energy use clusters / 28
3. THE qUALITATIVE CASE STUDY IN DEBRECEN ABOUT FACTORS INFLUENCING HOUSEHOLDS’ ENERGY CONSUMPTION / 37 3.1. The research area: Debrecen / 37
3.1.1. Main demographic characteristics: age structure, education level and employment characteristics / 38 3.1.2. The most important residential districts
in Debrecen / 42
3.1.3. Housing, housing constructions / 45
3.2. Energy use, energy management and energy supply in the CSA / 50
3.2.1. The main specialities of the case-study area (CSA) in energy policy / 52
3.3. National policy background / 56
3.3.1. Description of the Hungarian energy policy / 56
6
4. INITIATIVES TO REDUCE HOUSEHOLD ENERGY CONSUMPTION / 77 4.1. Solar panels / 78
4.1.1. Families and their houses / 78 4.1.2. Energy-related behaviour / 81 4.1.3. Motivations of the investment / 82 4.1.4. The investment / 86
4.2. Insulation of blocks / 89
4.2.1. Families and their houses / 89 4.2.2. Energy-related behaviour / 92 4.2.3. Motivations of the investment / 94 4.2.4. About the project, the investment / 95 4.2.4.1. Planning and construction / 96 4.2.4.2. Constructors / 99
4.2.4.3. Conflicts / 100
4.2.4.4. Results of the project / 102
4.2.5. Satisfaction with the financial investment / 103 5. STAKEHOLDER ANALYSIS / 105
6. PERSPECTIVES ON FUTURE ENERGY CONSUMPTION / 111 6.1. Expected trends / 111
6.2. Changes in energy consumption / 114
6.3. Push and pull factors of changing consumption patterns / 117 6.4. Public Policy / 118
6.5. Responsible thinking / 119 7. CONCLUSIONS / 121
8. REFERENCES / 127 Appendix / 133 Authors / 136
1. Theoretical background and research questions
This case study analysis focuses on social dimensions of household energy consumption and energy saving projects. The main goal is to analyse new relations and co-operations of actors which may lead to a more sustainable energy use and efficient energy policy.
According to authors of “Report on assessment of energy-efficient policies and interventions” the household’s energy efficiency depends on technical and financial availability of technology, the barriers to energy efficiency and policy intervention.
In this case study about factors influencing households’ energy consumption we focus less on availability of technology. The concept of “private energy-efficiency gap” or with other name “energy paradox” clearly explains that some energy-saving technologies are not equipped even though companies promised to pay for the users (Gerarden et al. 2017)
For our study the concept of barriers provides theoretical framework (Schleich et al. 2016) which describes external and internal barriers of energy efficiency. External barriers can be changed flexibly while internal barriers related to values, preferences, practices and behaviours are hard to change.
8
lead to “market failure explanations” (Gerarden et al. 2017). An example of “capital market failure” is as some user cannot obtain capital to invest in energy saving equipment and technologies (Gillingham et al. 2009). Another important barrier of energy efficiency is discount rate reflecting to balance between capital cost and operational cost (Hausman 1979)
Analyses include information as external constraints, especially information lack (Palmer et al. 2013). The energy users invest less in energy saving if they lack information or they are misinformed on energy efficiency technic availability, price, potential energy and financial saving or advantages/disadvantages of investment in energy saving projects. According to literature lack of information is a dominant barrier which underlines the importance of political intervention because the lack of information triggers the underinvestment of energy efficiency (Allcott – Greenstone 2017).
The financial and technological risks, the technical risk and time risk are listed in the literature as external barriers (Schleich et al. 2016).
Time-preference and risk are elements of the energy efficiency internal barriers. Time preference points to values and expectations in time discounting and allocates the level of willingness to patience, impatience, present or future orientation. Individual customers more present than future oriented care less future than present therefore they are less willing to invest in long term energy-saving projects.
Present oriented home owners prefer fast-returning benefits and they are less willing to spend money on energy efficient technology.
Individuals having sympathy or awareness for risks can change their attitude and literature explains that risk-averse owners are more cautiously apply energy efficient appliances (Weber – Chapman 2005; Fischbacher et al. 2015). Steg et al documented that hedonic and ego-oriented values constrain pro-environment behaviour while altruistic environment-oriented values correlate with pro-environment
behaviour (Steg et al. 2014). Ramos, Labandeira and Löschel (2016) add to this that eco-friendly behaviours supported by environmental policy, movements and actions positively correlate with energy efficient investment, but environmental attitudes do not effect positively energy saving projects.
Authors of “Report on assessment of energy-efficient policies and interventions” listed regulatory instruments, economic and financial instruments, provision of information, audits, labeling and hard information interventions, nudges as tools of policy intervention. The case study gives a detailed description of the locally relevant policy instruments.
Energy efficiency is not only influenced by the availability of cheap technologies to reduce energy use, but also by the openness of the actors to apply the new technologies. The openness of the actors is influenced by the actors’ environmental consciousness, the perception of climate change, financial background but also by different policies, or the availability of information. As our case study aims at analysing individual energy use in a Central-European, Hungarian town, we focus on two types of homes: flat in a block-of- houses and detached houses.
A recent study (Bhattacharjee – Reichard 2011) analysed the socio-economic factors influencing household energy use by conducting a meta-analysis of 51 research articles. The authors argue that the following factors reduce energy use: (1) number of individuals sharing the same household, (2) by the increasing of educational level energy use decreases, and (3) the openness to changes also decreases energy use (Bhattacharjee – Reichard 2011). Unfortunately, the authors do not present how these factors influence energy use.
10
general economic development in a country, decreasing the energy- prices, and the availability of the energy-using appliances. These latter three factors show that in general the prices and the economic situation is an important factor influencing energy use.
The analysis finally mentions that the climatic situation also influences energy use.
Another study (Gram – Hanssen 2011) using Danish statistical data, argues that the characteristics of the building determine 42% of energy use, individual behaviour determines 50%, while socio- demographic characteristics determine 4,2%. The decrease in energy use is counter-balanced by the increase in the number of electric appliances. As the paper argues, not the energy-efficiency of the household appliances, but their number influences the overall energy use of the household. This study also found that more individual lives in a household, the less the per capita energy use is.
The role of the age of the head of the household and the educational level of the individuals are disputed.
While electricity use is mainly determined by household and individual characteristics, heating energy depends on the characteristics of the building.
The main goal of the case study is to identify most important actors of energy efficiency, their motives and interest in joining energy efficiency projects: building insulation, modernization of the heating system and applying solar cells technology. We use the concept of governance which proved to be a suitable theoretical frame to study households’ energy demand, energy use and governance in the context of climate change management (Gotts – Kovách 2010).
Applying theoretical considerations about the technical term of governance (Rhodes 1996; Stoker 1998, Kooiman – Van Vliet 1993), one of our aims of defining governance was to include growing number of actors which may have an impact on energy efficiency
oriented behaviour. The multi-level and multi-actor governance is a complex of structures, institutions and actors (and their networks, values, motivations and interests). We aim to understand sociological and institutional aspects of household energy consumption, the role of stakeholders and mediator actors of efficient energy policy and projects at national and local level, the impact of policy intervention, new relations and co-operations among actors which may lead to new scope for future actions.
1.1. Main research questions
1. The focus of this study is to explore the factors that help to understand interference between social status, norms which impact consumer groups’ behaviour related to energy efficiency and in specific cases (renovation of buildings, applying solar cells technology) the role of governance.
2. Exploration and comparison of varied social components, social status (income level, age, education, gender) and social norms which influence the individual and communal choice of consumers.
3. To find the social and institutional conditions necessary to foster social response to energy efficiency policies, the social determinants of novel operational knowledge and the role of knowledge.
First, in chapter 3, the case study presents research methods. The chapter 3.1 describes the main social and energy use characteristics
12
insulation of block buildings. The sixth chapter is stakeholder analysis while chapter 7 provides an outlook about future tendency. The last chapter is a summary on factors influencing households’ energy consumption.
2. Methods
To answer research questions, we used tape interview-based case study, which aims to explore impact of energy policy, actors of local energy governance, their interests and reflexions to policy, which may successfully lead to progress of sustainable energy consumption.
We analysed Penny survey conducted in Italy, The Netherlands, Germany and Switzerland in 2017–2018.
In Debrecen city we made:
1. 40 interviews with blockhouse flat owners who participated in energy saving building renovation, insulation and heating system modernisation programmes in blocks of flats estates in the neighbourhood of villa district (see chapter 4.2) The interviewees have been randomly selected. For the sampling we used list of flat owners we received from building maintenance managers of those block houses which participated in energy saving building insulation programs.
2. 17 interviews with stakeholder experts (engineers, planners and designers, leader of non-profit agency). We could make only one, not recorded interview, with representative of local government but as it turned out from the stakeholder interviews
14
3. 3 interviews with building maintenance managers of insulated block buildings where interviews have been made with flat owners.
4. 10 interviews with owners of houses where solar cells are applied for energy saving. The interviewees have been randomly selected.
2.1. Energy use in the PENNY countries
In this part we present the results of a survey conducted among Italian, Swiss, German and Dutch households to explore their energy-related behaviour. Our goal is to provide an international outlook for the interpretation of the results of the Debrecen case study. First, we present socio-demographic characteristics, then a typology of energy use clusters. Finally, we compare the socio-demographic characteristics and energy-related behaviour of the different energy use groups.
2.2. Socio-demographic characteristics of the respondents
The average age of the respondents from the three countries 51 years, the Dutch population is slightly younger 48.9 years, while the Swiss and Italian population is slightly older: 51 and 53 years old.
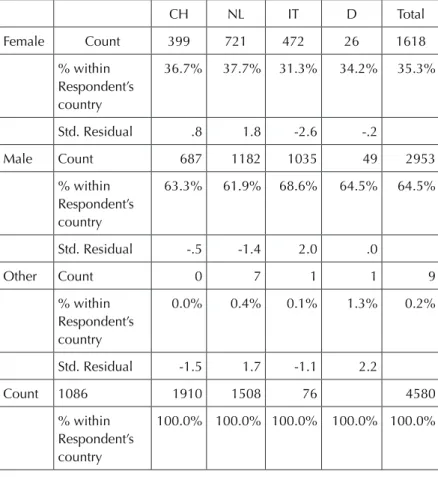
1. table: The gender distribution of the respondents
CH NL IT D Total
Female Count 399 721 472 26 1618
% within Respondent’s country
36.7% 37.7% 31.3% 34.2% 35.3%
Std. Residual .8 1.8 -2.6 -.2
Male Count 687 1182 1035 49 2953
% within Respondent’s country
63.3% 61.9% 68.6% 64.5% 64.5%
Std. Residual -.5 -1.4 2.0 .0
Other Count 0 7 1 1 9
% within Respondent’s country
0.0% 0.4% 0.1% 1.3% 0.2%
Std. Residual -1.5 1.7 -1.1 2.2
Count 1086 1910 1508 76 4580
% within Respondent’s country
100.0% 100.0% 100.0% 100.0% 100.0%
Sig: p < 0,000 (Source: PENNY survey 2017)
16
According to the table, 4580 respondents answered this question from Netherlands, Italy, Germany and Switzerland. The number of females is 35.3% from the countries. This rate is 37.7% in Netherlands, 31.3% in Italy, 36.4% in Switzerland and 34.2% in Germany. The male respondents’ ratio is higher in a national and an international level too. In an international level, the ratio of males is 64.5%. In Netherlands 61.9%, in Italy, 68.6%, and in Switzerland 63.3% and in Germany 64.5% the proportion of men. The questionnaire took into consideration the diversity. Because of this, we can find a third category „other”. Only 0.2% of the respondents chose this category.
0.4% from the Netherlands, 0.1% from Italy and none of the respondents chose this category from Switzerland, while 1.7% in Germany. Based on the Chi-Square Test the differences between the three countries are significant.
In general, the respondent’s average age is 51 and basically, the size of their home is 138 m2. In the Netherlands, the average age is 48.8. And in general, the size of their house is 152 m2. The Italian respondents are 53.2 years old in general and their flat size is 111 m2. In Switzerland, the respondents’ average age is 52 years old and their flat size is 148 m2. The average age of German respondents is 48 years and their flat floor area is 111 m2.
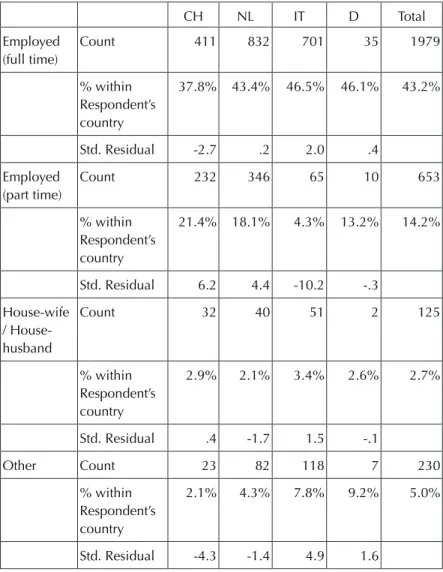
2. Table: What is your principal career status?
CH NL IT D Total
Employed (full time)
Count 411 832 701 35 1979
% within Respondent’s country
37.8% 43.4% 46.5% 46.1% 43.2%
Std. Residual -2.7 .2 2.0 .4
Employed (part time)
Count 232 346 65 10 653
% within Respondent’s country
21.4% 18.1% 4.3% 13.2% 14.2%
Std. Residual 6.2 4.4 -10.2 -.3 House-wife
/ House- husband
Count 32 40 51 2 125
% within Respondent’s country
2.9% 2.1% 3.4% 2.6% 2.7%
Std. Residual .4 -1.7 1.5 -.1
Other Count 23 82 118 7 230
% within 2.1% 4.3% 7.8% 9.2% 5.0%
18
Retired Count 249 323 370 16 958
% within Respondent’s country
22.9% 16.9% 24.5% 21.1% 20.9%
Std. Residual 1.5 -3.9 3.1 .0
Seeking work
Count 12 61 42 1 116
% within Respondent’s country
1.1% 3.2% 2.8% 1.3% 2.5%
Std. Residual -3.0 1.8 .6 -.7
Self- employed / Freelancer
Count 104 190 152 2 448
% within Respondent’s country
9.6% 9.9% 10.1% 2.6% 9.8%
Std. Residual -.2 .2 .4 -2.0
Student / Trainee
Count 23 41 9 3 76
% within Respondent’s country
2.1% 2.1% 0.6% 3.9% 1.7%
Std. Residual 1.2 1.6 -3.2 1.6
Count 1086 1915 1508 76 4585
% within Respondent’s country
100.0% 100.0% 100.0% 100.0% 100.0%
Sig: p < 0,000 (Source: PENNY survey 2017)
This table consists of 4585 respondents’ answer about their labour market status. All together 43.2% of respondents have a full-time job.
On a national level, this ratio is 43.4% in the Netherlands, 46.5% in Italy, 37.8% in Switzerland and 46.1% in Germany. On international level, 14.2% of the respondents have a part-time job. This percent is the highest in Switzerland (21.4%). According to the table 2, only 2.7% of the respondents are housewife/househusband. This number is the highest in Italy (3.4%). 958 pensioners fulfilled the questionnaire, which 20.9% of the respondents in an international level. This number is the lowest in the Netherlands (17%). 2,5% of the respondents are job seekers. This rate is the lowest in Switzerland (1.1%). 9.8% of the respondents are freelancer/self-employed. 1.6% of the subjects are students/trainees. The number of the students/interns is the lowest in Italy (0.6%). 5% of the respondents chose the „other” category in the questionnaire. Based on the Chi-Square Test the differences between the three countries are significant.
20
3. Table: Which of the following best describes your household type?
CH NL IT D Total
Couple, with 1 or more children
Count 453 601 838 29 1921
% within Respondent’s country
41.7% 31.4% 55.6% 38.2% 41.9%
Std. Residual -.1 -7.1 8.2 -.5 Couple,
without children
Count 322 723 313 19 1377
% within Respondent’s country
29.7% 37.8% 20.8% 25.0% 30.0%
Std. Residual -.2 6.2 -6.6 -.8 Non-family
household
Count 49 41 32 16 138
% within Respondent’s country
4.5% 2.1% 2.1% 21.1% 3.0%
Std. Residual 2.9 -2.2 -2.0 9.1 Single
parent with 1 or more children
Count 52 140 127 12 331
% within Respondent’s country
4.8% 7.3% 8.4% 15.8% 7.2%
Std. Residual -3.0 .1 1.7 2.8
Single person
Count 210 410 198 0 818
% within Respondent’s country
19.3% 21.4% 13.1% 0.0% 17.8%
Std. Residual 1.2 3.7 -4.3 -3.7
Count 1086 1915 1508 76 4585
% within Respondent’s country
100.0% 100.0% 100.0% 100.0% 100.0%
Sig: p < 0,000 (Source: PENNY survey 2017)
41.9% of respondents have their own family with one or more children. This ratio is the highest in Italy (55.6%). The percentage of couples without children at cross-country level is 30.4%. This percentage is the highest in the Netherlands (37.8%). 3.0% of the respondents live in a non-family household. In this category we find the highest percentage in Switzerland (4.5%). 7.2% of respondent bring up their child/children alone. This number is the highest in Italy (8.1%), and the lowest in Switzerland (4,8%). 17.8% of the respondents are single. This rate is 21.4% in the Netherlands, 19.3%
in Switzerland, 13.1% in Italy and no one in Germany. Based on the Chi-Square Test the differences between the three countries are significant.
22
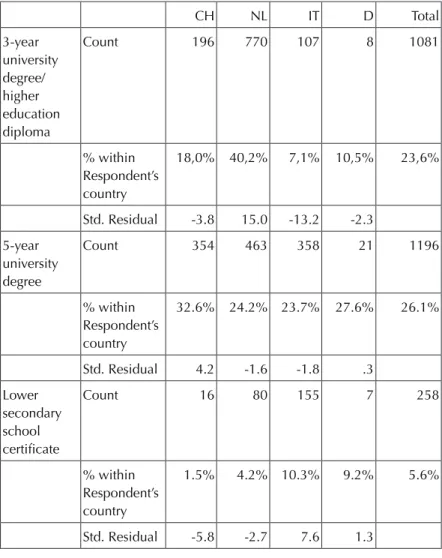
4. Table: What is the highest educational degree you have completed?
CH NL IT D Total
3-year university degree/
higher education diploma
Count 196 770 107 8 1081
% within Respondent’s country
18,0% 40,2% 7,1% 10,5% 23,6%
Std. Residual -3.8 15.0 -13.2 -2.3 5-year
university degree
Count 354 463 358 21 1196
% within Respondent’s country
32.6% 24.2% 23.7% 27.6% 26.1%
Std. Residual 4.2 -1.6 -1.8 .3 Lower
secondary school certificate
Count 16 80 155 7 258
% within Respondent’s country
1.5% 4.2% 10.3% 9.2% 5.6%
Std. Residual -5.8 -2.7 7.6 1.3
None Count 2 3 5 0 10
% within Respondent’s country
0.2% 0.2% 0.3% 0.0% 0.2%
Std. Residual -.2 -.6 .9 -.4
Postgraduate qualification
Count 74 107 56 4 241
% within Respondent’s country
6.8% 5.6% 3.7% 5.3% 5.3%
Std. Residual 2.2 .6 -2.6 .0
Primary school certificate
Count 5 30 9 2 46
% within Respondent’s country
0.5% 1.6% 0.6% 2.6% 1.0%
Std. Residual -1.8 2.5 -1.6 1.4 Upper
secondary school diploma
Count 110 145 702 16 973
% within Respondent’s
10.1% 7.6% 46.6% 21.1% 21.2%
24 Vocational secondary school diploma (3 years of study)
Count 329 316 116 18 779
% within Respondent’s country
30.3% 16.5% 7.7% 23.7% 17.0%
Std. Residual 10.6 -.5 -8.8 1.4
Count 1086 1914 1508 76 4584
% within Respondent’s country
100.0% 100.0% 100.0% 100.0% 100.0%
Sig: p < 0,000 (Source: PENNY survey 2017)
In this part, we analysed the respondent’s educational level.
23.6% has a 3 year university degree. The highest ratio is among the Dutch respondents with 40.2%. The lowest number is among the Italian respondents with 7.1%. 26.1% of the respondents have a 5 year university degree. This ratio is the highest, 32.8% among the Swiss respondents. In an international level 5.6% of the respondents have a lower secondary school certificate. This number is the highest among the Italian respondents (10.3%) and the lowest among the Swiss respondents (1.5%). 0.2% of the respondents had no education.
5.4% of the respondents have a postgraduate qualification. 1% has a primary school certificate. 21.2% has an upper secondary school diploma. This rate is the highest among the Italian respondents (46.6%). 16.6% has a vocational secondary school diploma. This
number is the highest in Switzerland (29.8%). Based on the Chi- Square Test the differences between the three countries are significant.
Almost one-fourth of the respondents didn’t answer about their income. This number is very high among Italian respondents (33.7%).
24.1% of the Italians earn between 1501–3000 Euro. They have the lowest income if we take into consideration the other nationalities.
From Netherlands 15%, from Switzerland, 15.5% of the respondents didn’t answer this question. 16.4% of the respondents in the Netherlands earn between 4’501–6’000 Euro, 15.3% of them earn 3’501–4’500 Euro. 13.2% earn between 6’001–9’000 Euro, and 13% has an income between 2’501–3’500 Euro. 23.9% of the Swiss respondents earn between 6’001–9’000 Euro. The second most common category is the above 12.000 earnings among these respondents (22.2%). Based on the Chi-Square Test the differences between the three countries are significant in both categories.
2.3. The characteristics of the homes
The average size of the homes are 123 m2. In the Netherlands, the size of the homes are bit larger: 128 m2. The homes of the Italian respondents are around 110.8 m2, while in Switzerland the average size of the home is 123.8 m2.
26
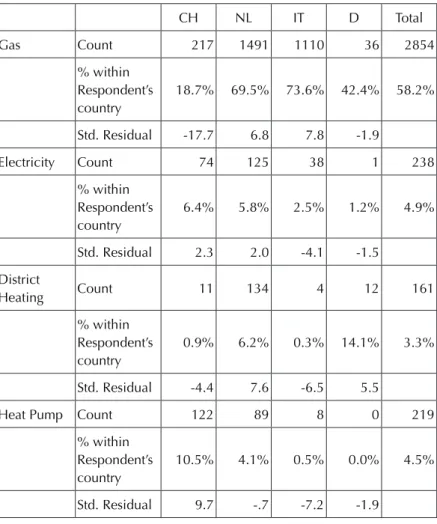
5. Table: How do you heat your flat/house?
CH NL IT D Total
Gas Count 217 1491 1110 36 2854
% within Respondent’s country
18.7% 69.5% 73.6% 42.4% 58.2%
Std. Residual -17.7 6.8 7.8 -1.9
Electricity Count 74 125 38 1 238
% within Respondent’s country
6.4% 5.8% 2.5% 1.2% 4.9%
Std. Residual 2.3 2.0 -4.1 -1.5 District
Heating Count 11 134 4 12 161
% within Respondent’s country
0.9% 6.2% 0.3% 14.1% 3.3%
Std. Residual -4.4 7.6 -6.5 5.5
Heat Pump Count 122 89 8 0 219
% within Respondent’s country
10.5% 4.1% 0.5% 0.0% 4.5%
Std. Residual 9.7 -.7 -7.2 -1.9
Solar Count 1 29 2 0 32
% within Respondent’s country
0.1% 1.4% 0.1% 0.0% 0.7%
Std. Residual -2.4 4.0 -2.5 -.7
Wood/pellet Count 21 45 92 1 159
% within Respondent’s country
1.8% 2.1% 6.1% 1.2% 3.2%
Std. Residual -2.7 -3.0 6.2 -1.1
Oil Count 187 1 6 8 202
% within Respondent’s country
16.1% 0.0% 0.4% 9.4% 4.1%
Std. Residual 20.1 -9.3 -7.1 2.4
Other Count 27 57 23 3 110
% within Respondent’s country
2.3% 2.7% 1.5% 3.5% 2.2%
Std. Residual .2 1.3 -1.9 .8
Don’t know Count 20 29 16 3 68
% within
Respondent’s 1.7% 1.4% 1.1% 3.5% 1.4%
28
No answer Count 481 146 209 21 857
% within Respondent’s country
41.4% 6.8% 13.9% 24.7% 17.5%
Std. Residual 19.5 -11.8 -3.4 1.6
Count 1161 2146 1508 85 4900
% within Respondent’s country
100.0% 100.0% 100.0% 100.0% 100.0%
Sig: p < 0,000 (Source: PENNY survey 2017)
The most popular heating mode among the respondents is the gas heating. This ratio is almost 60% (58.2%). This was especially popular among the Italian (73.6%) and the Dutch (69.5%) respondents. This kind of heating system is unpopular among the Swiss respondents, only 18.7% of them use gas.
2.4. Energy use clusters
We developed a typology of energy use according to the size of the home, number of electronic appliances, number of pc’s and televisions in the household, number of cooked meals, average winter temperature of the home and washing-machine use. We found three types. The first type, the high energy use households has bigger homes, more appliances, but less pc’s and televisions than the average, their homes are warmer and they cook more often at home.
Socio-demographic characteristics of energy use
In the Netherlands 30.8% of the respondents are high energy user, 48.2% are low energy users and 21% of them are medium energy users. Among the Italians 37.8% of them are high energy user, 45.5%
are low energy users and 16.7% of them are medium energy users. In Switzerland 64.1% of the subjects are high energy users, 22.9% are low energy users and 13% of them live in a medium energy use household. 41.2% of the respondents’ households consume low energy, 41.3% high energy users, while 17.5% are medium energy users.
The following table shows the gender differences in energy use.
6. Table: Gender and energy use Low energy use HH
High energy use HH
Medium
energy use HH Total
Female
Count 608 464 227 1299
% within Cluster
Number of Case 39.3% 29.7% 34.1% 34.4%
Std. Residual 3.3 -3.2 -.1
Male
Count 936 1094 438 2468
% within Cluster
Number of Case 6.5% 70.0% 65.9% 65.4%
Std. Residual -2.4 2.3 .1
30 Other
Count 3 4 0 7
% within Cluster
Number of Case 0.2% 0.3% 0.0% 0.2%
Std. Residual .1 .6 -1.1
Count 1547 1562 665 3774
% within Cluster
Number of Case 100.0% 100.0% 100.0% 100.0%
Sig: p < 0,000 (Source: PENNY survey 2017)
According to the Chi-Square Test, there is a significant difference between the genders and energy consumption. According to the table the males are overrepresented among the high energy users. Their ratio is 70.0%, while the proportion of females are 29.7%. We identify the same among the medium energy users. The males are overrepresented in this category too. Among the low energy users, the females ratio is 34.1%, the male’s ratio is 65.9%.
7. Table: Household type – Energy use clusters Low energy
use HH
High energy use HH
Medium energy use
HH
Total Couple, with
1 or more children
Count 519 1021 124 1664
% within Cluster Number of Case
33.5% 65.3% 18.6% 44.0%
Std.
Residual
-6.2 12.7 -9.9
Couple, without children
Count 550 371 227 1148
% within Cluster Number of Case
35.5% 23.7% 34.1% 30.4%
Std.
Residual
3.7 -4.8 1.8
Non-family household
Count 56 33 13 102
% within Cluster Number of
3.6% 2.1% 2.0% 2.7%
32
Single parent with 1 or more children
Count 143 81 42 266
% within Cluster Number of Case
9.2% 5.2% 6.3% 7.0%
Std.
Residual
3.2 -2.8 -.7
Single person Count 281 58 259 598
% within Cluster Number of Case
18.1% 3.7% 38.9% 15.8%
Std.
Residual
2.3 -12.0 15.0
Count 1549 1564 665 3778
% within Cluster Number of Case
100.0% 100.0% 100.0% 100.0%
Sig: p < 0,000 (Source: PENNY survey 2017)
According to the Chi-Square test there is a significant difference between the clusters. 63.2% of high energy users are couple with 1 or more children. 33.5% of low energy use household members are couples without children, 35.5% couple with 1 or more children.
34.5% of medium energy users are couple without children and 38.9% of them are single.
According to the Chi-Square Test, the differences between the clusters are significant. The educational level and the career status influence the energy consumption. An interesting result too that our partner’s educational level and career status are also related to the energy consumption patterns of the household. According to the Chi- Square Test, the differences between the clusters are significant. The income has an important role in our energy consumption.
As we realized before the respondents mostly use gas for heating.
If we take into consideration the results 55.4% of high energy use households have gas heating. The other important result that 64.7% of low energy households have gas heating too. 13.8% of high energy users have central heating. The second important category has a connection with central heating. 13.8% of high energy households and 17.8% of low energy use households use central heating. 61.8%
of medium energy use households have a gas heating and 17.1% of them have central heating.
According to the Chi-Square Test, there is a significance between the level of the households’ energy using and in the form of heating.
The most common form of water heating both in high energy use households and low energy use households is heating by gas. In high energy use households, this ratio is 60.1%. In those houses, which has a low-level energy consumption this ratio is 67.5%. Among those high energy use households, which heating the water by central heating this ratio is 12.7%. This ratio among low energy use households is 14.2%. If we take into consideration the data of medium energy use households whose heating their water by gas is 64%. That ratio who is using central heating to warm the water is 14.6%.
According to the Chi-Square Test, there is a significance in the level of
34
50.6% of the high energy use households use gas for cooking.
49.1% of them use electricity when they are cooking. 72% of low energy households cook by gas and 27.6% of them use electricity for this activity. 62% of medium energy use households use gas as a cooking energy, 38% of them use electricity. According to the Chi- Square Test, there is a significance between the level of the households’
energy using and in the form of cooking.
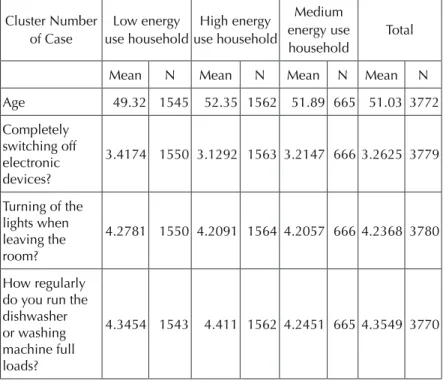
8. Table: Characteristic of the energy consumers/
energy use households Cluster Number
of Case
Low energy use household
High energy use household
Medium energy use household
Total
Mean N Mean N Mean N Mean N
Age 49.32 1545 52.35 1562 51.89 665 51.03 3772 Completely
switching off electronic devices?
3.4174 1550 3.1292 1563 3.2147 666 3.2625 3779
Turning of the lights when leaving the room?
4.2781 1550 4.2091 1564 4.2057 666 4.2368 3780
How regularly do you run the dishwasher or washing machine full loads?
4.3454 1543 4.411 1562 4.2451 665 4.3549 3770
Sig: p < 0,000 (Source: PENNY survey 2017)
According to the Chi-Square Test, the differences between the tree energy use type and the analysed activities are significant. Based on the data the high energy use households 40.9% very often running only full loads when using the dishwasher or the washing machine.
This ratio among the low energy use households is 33.4%. 51.8% of the high energy use households chose the „always category”, while the ratio is 55.1% among low energy use households. Among the medium energy use households, 41.4% chose the very often category.
In the high energy use households, 15.3% of the residents never switch off the ICT devices completely. 21.7% of them rarely. Among the low energy use households, 26.7% of the respondents very often and 26.6% of them always switch off these devices.
10.5% of the high energy use households „sometimes” turn off the light when they leave the room. 45.9% of them very often do this.
38.8% always follow the turn of the light rule. This level among the low energy user households is similar. But we can find the main difference when they chose the „always” category. The ratio among them is 47.4%.
3. The qualitative case study in Debrecen about factors influencing households’
energy consumption
3.1. The research area: Debrecen
The following chapter introduces the characteristics of the case-study area: first, socio-demographic characteristics of the population and social geography. Then we analyse environmentally relevant characteristics, and finally energy use relevant specialities of housing.
Debrecen, the research area is in the eastern part of the Great Hungarian Plain. Its geographical position is favourable as it is situated along a main railway line, a highway and several main roads. It has an international airport. The capital city, Budapest is in a 220 km distance. The Hungarian–Romanian border is 30 km east of the town and the Hungarian–Ukrainian border is 120 kilometres, thus the city has dense international relationships. The town is economic, educational, scientific and cultural centre of the Northern Great Plain. Regarding population. Debrecen is the second biggest Hungarian town with around 211.320 inhabitants, according to the 2011 census data.
38
3.1.1. Main demographic characteristics: age structure, education level and employment characteristics
Age structure
The age structure of the population is favourable (the ratio of the ag- ing index in 2011 and 2001 was less than one). This is mainly typical of the urban areas where housing projects took place between 2001 and 2011 and caused a significant increase in population growth.
Most of the newcomers were younger families with children, result- ing in a low aging index, and revitalization.
9. Table: Population breakdowns by age groups in the 2001 and 2011 censuses in Debrecen
Age group 2001 2011
0–4 4.43 4.48
5–14 11.41 8.83
15–29 26.87 22.85
30–39 12.85 16.18
40–49 14.84 12.64
50–59 12.23 13.80
60–64 4.54 6.12
65– 12.83 15.10
Source: Census volumes for the years concerned – Debrecen Settlement Development Concept and Integrated Settlement Development Strategy 2014–2020 – preliminary examination
The favourable situation is basically explained by the fact that there was a significant migration surplus, which could counter- balance the negative tendencies of natural population losses. The positive migration balance is the result of a continuous immigration into the town from rural areas and that the target-settlements of outmigration are belonging to the town, at least administratively.
Although suburbanization is important the population of the town did not decrease. The population gain of the surrounding small settlements is huge.
Education level
The general educational level of the population has increased significantly in the last decade. It can be explained by the fact that Debrecen is an educational centre of the region: the town consciously enforced public education, and the massification of the higher education.
10. Table: Population breakdowns by education level in the 2001 and 2011 censuses in Debrecen
Year
No elementary school (over 10)
Elementary school (over 15)
Secondary school (high school degree)
(over 18)
B.A. or M.A.
(over 25)
2001 0.7 92.8 51.1 19.1
2011 0.5 97.1 62.5 27.6
40
Employment
The economic situation and employment indicators of Debrecen are favourable, but as it is the centre of the Northern Great Plain region with economic and social difficulties, Debrecen faces certain problems. Full-time employees are broken down by sector over the past decades (Figure 11), which shows the change in the situation of individual sectors: because, at the end of 2000s and the beginning of the 2010s both construction and tourism, and activities related to finance went into recession, which explains that the number of working people decreased. By contrast, the Shared Service Centre sector plays an increasingly important role in the economy of the town, which appears in the significant increase of the number of employees in the information and communication sectors.
11. Table: Changes in the distribution of full-time
employees by sector In Debrecen between 2009 and 2011 (persons, on 31 December of the year concerned)
Sector 2009 2010 2011
Agriculture 691 962 1 183
Industry 12 239 10 148 11 621
The manufacturing industry within
the industry 10 293 8 241 9 766
Building industry 1 569 1 350 1 231
Trade and motor vehicles repair 5 130 4 728 4 752 Transportation and storage 4 353 4 164 3 964 Accommodation services, catering 1 391 1 177 1 175
Information, communication 841 1 564 1 734 Financial and insurance activities 1 140 1 113 1 051
Real estate transactions 439 354 200
Professional, scientific and techni-
cal activities 539 453 688
Administrative and service support
activities 2 126 2 284 2 298
Public administration, defence,
compulsory social security 6 732 6 834 6 634
Education 10 334 10 764 10 504
Human, health and social care 4 380 4 064 3 998 Art, entertainment, free time 885 882 931
Other services 195 297 230
Total 52 984 51 138 52 194
Source: Census volumes for the years concerned – Debrecen Settlement Development Concept and Integrated Settlement Development Strategy 2014–2020, preliminary examination
42
3.1.2. The most important residential districts in Debrecen
Downtown
The Downtown is the historical core of Debrecen, whose population number dropped significantly, more than the average of Debrecen, in the period between the 1990 and 2001 censuses, and this has continued in the new millennium. By contrast, the number of dwellings increased between 1990 and 2001. The ratio of low- comfort flats is low. The Downtown is one of the oldest districts of Debrecen considering the age structure of the town. There is a high proportion of people with a higher education degree and a relatively high proportion of people with a maximum primary education within the age group of 15–59. The significant part of the town’s administrative, cultural, and commercial-catering establishments are in the Downtown.
Traditionally built-in inner residential area
The traditionally built-in inner residential area includes the ring surrounding the downtown. The small-town character dominates the constructions, broken by condominiums in some areas or continuous blocks of flats estates. The number of inhabitants in the area decreased significantly between 1990 and 2001, which has continued since.
Regarding the housing stock, a slight decrease can be observed in the whole town district. There has been a rejuvenation in the western part of the district, which is, however, largely attributable to the fact that the number of people over the age of 60 decreased more, than the number of people under the age of 15. The economic functions of the traditional built-in areas are less significant. Among the institutions of
the district, the concentration of public administration and retail and catering institutions is higher.
Blocks of flats estates
Most of the districts of the blocks of flats estates are in the western part of Debrecen. Their construction began in the 1960s and continued in the 1970s, 1980s and 1990s. The number of the population decreased continuously in the blocks of flats estates between 1990 and 2001, except for two areas. One is the Epreskert (new condominiums), and the other is the Ispotály district (new residential estate).
The age structure of the population of each town district is basically related to the period of the construction of the concerned blocks of flats estate. Families with small children moved in the newly built homes, but as children were growing up, however, these homes could less and less meet their expectations, therefore the children or the entire family have moved out. The result of all these processes is the aging of the population. In the employment situation of the blocks of flats estates, favourable tendencies can be observed with only one or two exceptions. The proportion of people in employment aged 15–64 is higher than the town’s average, while the proportion of people aged 15–59 without a regular income from labour is nowhere worse in this age group than the average of the blocks of flats estates in Debrecen.
Villa quarter
The Villa quarter district is in the northern part of Debrecen. Analysing
44
despite the constructions of new condominiums that took place in that decade, and which was nearly 15% in the Nagyerdőalja district.
This district of Debrecen has the oldest population. This is particularly typical of the Nagyerdő quarter, where the aging level has been very high, because, those who moved in the condominiums built in the 1960s/70s have not thought of leaving the town even in their older age thanks to the pleasant living environment, while their children have moved out, as mentioned earlier. One of the town’s most important sports and educational centreis located in the northern part of Nagyerdőalja district.
Suburb
In addition to blocks of flats estates, the Kertváros/Suburb area hosts the other large population conglomeration of Debrecen, but unlike the blocks of flats estates, in this part of town the number of inhabitants increased further between 1990 and 2001, and moreover, the population density is much smaller thanks to detached house constructions. The suburban district experienced population growth between 1990 and 2001, except for the southern suburb. Since the 2001 census, several significant housing estate investments have been carried out in the Kertváros district which have influenced the population of the given area (growth) and age composition (revitalization) in a positive direction. The third source of population growth after 2001 has taken place in the gardens area at the southern and eastern borders of the town, where a significant number of family houses have been built recently. According to the age structure of the population, this district of the town, and especially some quarters of the district have better values than Debrecen as a whole.
Industrial zone
The industrial zone comprises the town quarters that play a prominent role in Debrecen’s economic life. In addition to the production facilities, commercial units have been playing an increasingly important role in the economic life of the area.
3.1.3. Housing, housing constructions
Between 2008 and 2012, the housing stock increased only slightly in Debrecen, and the growth dynamics were constantly decreasing.
Compared to 2008, the number of flats in the town only increased by 1000. In 2012, the number / proportion of flats built was only a quarter of the year 2008. In the case of new homes, the number and rate of self-contained flats are high. The proportion of new flats with gas pipeline and bathroom in all new homes was 90-95%, only the supply of the public sewerage showed a smaller proportion. The average floor space of the newly built flats over the last half decade has exceeded 100 square meters. More than 60% of the new homes have three, four or more rooms, whereas the rate of one – and two- bedroom flats remains below 40% collectively. During the examined period, no service or social rental flats were built in the town, most of housing constructions were realized as private investments.
46
12. Table: Dwellings, housing constructions 2008–2011
Flat characteristics 2008 2009 2010 2011
Dwelling stock (pcs) 89 716 90 124 90 342 90 502 Number of dwellings built (pcs) 883 476 291 208 Number of dwellings with gas pipeline
built during the year (pcs) 859 452 274 197
Total ground-space of dwellings built
during the year (m2) 78 154 52 268 33 753 26 526 Number of one-room flats built during
the year 85 11 4 5
Number of two-room flats built during the year (with one and a half rooms) (pieces)
191 32 31 17
Number of dwellings built with public
utility water in the year 875 469 287 204
Number of flats ceased during the year
(pcs) 111 68 73 48
Number of three-room flats built during the year (including flats with two and half rooms) (pcs)
227 121 82 36
Number of flats with four and more rooms built in the year (including flats with three and half rooms) (pcs)
380 312 174 150
Number of houses built during the year
(pcs) 355 282 176 143
Number of flats built by enterprises
during the year (pcs) 334 108 44 31
Number of flats built by natural persons
during the year (pcs) 548 368 247 177
Number of flats built for sale during the
year (pcs) 368 152 47 37
Number of flats built for own use
during the year (pcs) 509 324 244 171
Number of dwellings built as family
house during the year (pcs) 300 255 170 159
Number of multi-storey, multi-flat
houses built during the year (pcs) 453 138 83 36 Number of flats built in the form of
group housing (row house, chain house) during the year (pcs)
123 77 30 11
Number of dwellings ceased for other
reasons during the year (pcs) 29 10 9 3
Source: Local Equal Opportunity Program 2013–2018, Debrecen Town of County Right
48
According to the 2011 census data, most of the flats in Debrecen (61%) were built in the period between 1961–1990. Consequently, the comfort level of the dwelling stock is relatively high, the number and rate of no-comfort flats are quite low, and the number of flats and houses over fifty years is not high, and in 2011, only 7 per cent of the flats in use were built before 1960. According to the usage right, private ownership dominates (83%). In terms of floor space, the number of flats is the highest with a maximum of 60–79 square meters, and as a permanent result of the prefabricated constructions, the number and proportion of flats with 50–59 square meters are almost the same as that of the previous one. The number of flats smaller than 29 square meters is relatively low, 2.5 percent in the housing stock, but the proportion of flats with a floor space larger than 100 square meters is over 14 percent. According to today’s standards, the total number of dwellings with an obsolete construction (cob or mud walls) is 2526, which is 2.8 percent of the total housing stock in Debrecen in 2011.
Local government’s housing stock
Within the housing stock in the town, in 2011, 2858 flats were owned by the local government. Of which, 1545 flats were less than 49 square meters, the local government owned 739 ones with 50-59 square meters, 485 were between 60 to 79 square meters. The number of dwellings owned by the local government with a larger floor space is only 89. In other words, the municipal housing stock has unfavourable conditions; they are mostly small in size, consisting mostly of one or two-bedrooms residential properties.
Characteristics of the population of the different quarters of the settlement
Debrecen’s most elderly neighbourhoods are basically divided into two groups. First, this includes the inner parts of the town (mainly the downtown and the traditional constructions in the north-eastern part of the town), which have been less popular among younger age groups for some time. The other group consists of the blocks of flats estates built in the 1960–70s and the Villa quarter, whose age structure was very youthful at the time of the investments, but since then, no new developments have taken place. As a consequence, their popularity decreases (or stagnates), because, the size of the apartments is less than the average (this is true of housing estates) or they are in need of renovation (e.g. Villanegyed quarter), and therefore they are not really attractive to younger settling families, and today a significant part of their populace is the original inhabitants, now in the age group of older people.
The population number in the 27 populated quarters increased in 13 and decreased in 14 between 2008 and 2013. A significant portion of the blocks of flats estates experienced 10% or greater population decline. According to changes in the spatial trend of the residential population, growth occurs mainly in the districts where large concentrated residential real estate investments (e.g. Ispotaly, Liget, Fészek residential park) have taken place in recent years, and consequently, a large number of people have moved in these neighbourhoods. The increase in the residential population number in the outskirts can be explained by the fact that, due to the high living costs, more and more people have decided to sell their flats in