Article
Differences in the Domestic Energy Consumption in Hungary:
Trends between 2006–2017
Ágnes Gy ˝ori *,Ákos Huszár and Karolina Balogh
Citation: Gy˝ori, Á.; Huszár, Á.;
Balogh, K. Differences in the Domestic Energy Consumption in Hungary: Trends between 2006–2017.
Energies2021,14, 6718. https://
doi.org/10.3390/en14206718
Academic Editor: Imre Kovách
Received: 30 August 2021 Accepted: 4 October 2021 Published: 15 October 2021
Publisher’s Note:MDPI stays neutral with regard to jurisdictional claims in published maps and institutional affil- iations.
Copyright: © 2021 by the authors.
Licensee MDPI, Basel, Switzerland.
This article is an open access article distributed under the terms and conditions of the Creative Commons Attribution (CC BY) license (https://
creativecommons.org/licenses/by/
4.0/).
Centre for Social Sciences, Hungarian Academy of Sciences, 1097 Budapest, Hungary; huszar.akos@tk.hu (Á.H.);
balogh.karolina@tk.hu (K.B.)
* Correspondence: gyori.agnes@tk.hu
Abstract:Goal 7 of the UN’s Sustainable Development Goals, adopted in 2015, sets out universal access to affordable, reliable and sustainable energy, but even in developed countries, this is still difficult to achieve. European comparative studies show that in Mediterranean and Central European countries, including Hungary, access to adequate energy remains a serious problem for certain social groups. The aim of the study is to examine the inequalities in access to and consumption of energy in Hungary. We pay special attention to presenting changes over time and examine what changes have taken place in household energy consumption since the years before the global economic crisis. We also explore the major socio-economic and building-related factors that increase the risk of possible energy vulnerability. For our analysis, we draw on data from a large sample survey conducted in 2007, 2013 and 2018 on a representative probability sample. Our results showed on the one hand the fundamental role of different combinations of energy sources used by households in the intensity of energy consumption, and on the other hand that besides the characteristics of the property concerned, the energy use and behaviour patterns of households are determined by the socio-demographic characteristics of the household as well.
Keywords:domestic energy consumption; intensity of energy consumption; building-related factors;
socio-demographic factors; latent profile analysis; Hungary
1. Introduction
Perhaps it is no exaggeration to say that by the 21st century, access to energy has become one of the most decisive aspects of welfare. The proper temperature and lighting in one’s home is a fundamental need, a; consumers use a number of electrical and other types of energy-powered appliances and devices to make daily life easier [1]. Besides, different energy sources are needed, for example, for cooking, storing food, travel, work and communication. Goal 7 of the UN Sustainable Development Goals, adopted in 2015, deems universal access to affordable, reliable and sustainable energy desirable [2]. According to progress indicators of the UN document, the rate of access to electricity has risen from 83%
in 2010 to 90% in 2019. Despite the improvement, 10% of the total global population, in fact 759 million people, still have no access to electricity [3]. The common denominator of the several definitions is that energy-poor people and households do not have access to enough energy to meet their basic needs (keep their homes warm, properly lit, etc.) [4].
Although complete energy poverty is not typical in developed countries, the propor- tion of households unable to meet their basic energy needs, such as heating their homes in winter is considerable [5]. Consequently, the most important area of research on the chances, possibilities and costs of access to energy has become the study of the context and explanation of energy poverty. There is no consensus, i.e., a general definition regarding energy poverty; there are several approaches as to how it is to be measured [4,6]. The measurement tools used to determine energy poverty are divided into two basic groups—
Expenditure-based Approach and Consensual Approach. Expenditure-based approach primarily focuses on the correlations between energy expenditures and income, while
Energies2021,14, 6718. https://doi.org/10.3390/en14206718 https://www.mdpi.com/journal/energies
Consensual Approach is based on indicators of phenomena related to household energy use, such as thermal comfort or affordable energy [7]. Other measurements, by combining these two approaches, form complex indicators trying to capture the phenomenon as comprehensively as possible. According to the most common (expenditure-based) ap- proach, a household is energy poor if the fixed cost of energy needed for providing the right temperature or lighting and operation of the flat represents a high proportion of household expenditure, i.e., it spends more than a certain percentage of its income on energy. According to Boardman (1990) who created the first widely accepted definition of the energy poverty the proportions of the energy spending should not be higher than the 10% of the household’s income. This 10% was near to the median value of the energy cots which was 6% in UK that time [8]. The most widely used indicators in worldwide are based on Board-man’s definitions. This is particularly true for 2M indicator, which means the share of energy expenditure (compared to equalised disposable income) above twice the national median. The other one is M/2 indicator, which refers to absolute energy expenditure below half the national median. The other name for the M/2 is Hidden energy poverty indicator, because it is able to measure households which cut their energy costs.
European Union’s Energy Poverty Observatory (EPOV) apply the 2M indicator to compare EU’s member states, at the same time it is highly sensitive the national specialties, as the energy prices and the income levels [9].
The diversity of definitions and measures suggests that energy poverty is a really complex phenomenon, as it depends not only on the income situation, but also on the quality and energy efficiency of residential properties, as well as the quality of the energy sources used [10]. Thus, poor households in terms of income have not only fewer financial resources to cover their energy costs, but they typically (also) live in much lower quality property. Besides do not have sufficient funds to implement energy modernization of the facilities of homes or household either [11]. It is also known from the literature that energy poverty is determined by multidimensional relationships of social and economic factors, from individual and household characteristics, through the development of energy prices to legal regulation. The identification of this group is truly important in terms of social welfare, a relevant area of the research may be reviewing the differences and access inequalities in the energy use of different social groups.
In Hungary, little research has been conducted on household energy consumption and inequalities in energy use; the majority of existing studies focuses on energy poverty.
According to research on energy poverty in European Union countries, which ex- amines member states by composite indices (such as the “European Household Energy Poverty Index”, EDEPI), Hungary ranks last but one in the ranking of European countries, outperforming only Bulgaria [12] (Figure1).
The study assessed the energy poverty situation of the poorest income quintiles in countries from a number of perspectives and took into account the percentage of income that energy expenditure accounts for; what is the proportion of households unable to heat their homes properly in winter; what is the proportion of households incapable of cooling their homes properly in the summer; what is the proportion of households living in poorly insulated, damp, mouldy properties. Although this analysis addresses only the lowest social status group and does not give a complete overview of Hungarian society’s access to energy, it draws attention to the fact that the deprived stratum in Hungary society is almost in the worst situation in European comparison: almost 1/3 of households in the lowest income quintile live in housing conditions of very poor heating (besides, nearly 40% of their properties are too hot in the summer), who, despite spending a significant part (almost 2/3 of their low income on energy (on gas or electricity bill), are still unable to create adequate thermal comfort as their homes are not insulated at all.
Figure 1.EDEPI Index, Source: OpenExp, 2019. p 4.
Thus, not only do poor households have fewer financial resources to cover their energy costs, but they typically live in much lower quality property as well, int he meantime, they do not have enough resources to implement energy modernization of their homes either [13].
As the national median value of energy expenditures is very high in Hungary (12%), the surveys are generally considered energy-poor by households that spend more than 30%
of their income on meeting their energy needs. Based on this approach, 10% of households can be considered energy poor in Hungary, and the problem mainly affects single people living in detached houses [14]. Other Hungarian surveys [15] also point out that in addition to the type of building/flat and household size, the phenomenon is also strongly related to flat size: according to their results, the majority of Hungarian energy-poor households live in flats of 100 m2or bigger floor area. As rural areas, especially small, settlements are economically disadvantaged and detached houses are generally larger than flats in condominiums—resulting in higher overhead costs—energy poverty is a major issue here.
Energy consumption, including energy poverty, is also determined by the sources of energy available and affordable to the population. Despite the fact that in 2019 gas was the most common energy carrier used for heating, less than a tenth of Hungarian settlements (278 settlements) were not connected a gas network, and heating only solid fuel (wood and coal) or electricity [13], were available as heating options. Many households switched to wood heating due to the significant rise in gas prices in the second half of the 2000s. As a result of the overhead cost cut scheme (Act LIV. of 2013t on the Implementation of the Overhead Cost Cut Scheme) introduced in 2013 to reduce the rise in prices, household spending fell indeed, but this subsidy did not apply to firewood prices, which in fact rose by 39% between 2012 and 2018. So, while the overhead cost cut scheme has helped to reduce gas prices, it has not made it easier for the poorest to afford the heating methods they use most often.
Thus, in the last decade, more and more attention has been paid to the exploration of energy poverty and its decisive factors in Hungary, however, this only included the review of households, i.e., the most vulnerable groups, who spend a significant part of their income on energy. There is a lack of research studying differences in energy consumption between groups from different social backgrounds. The aim of this article is to explore the energy use-behaviour patterns of domestic households. It seeks to explore how the combination of different sources of energy used by households correlate with housing-related factors and socio-demographic characteristics of households.
2. Materials and Methods
Our study focuses on the energy consumption habits of Hungarian households, their changes over time and their decisive factors. The novelty of our approach is that, based on the intensity of the types of energy used by households, it examines the different patterns of energy use and behaviour of households, while also taking the technical properties of flats and buildings and the characteristics of the household into consideration.
Our survey is based on a secondary analysis of three large, representative national surveys conducted by the Central Statistical Office in 2007 (reference years: 2006; 8974 households), 2013 (reference years: 2012; 9054 households) and the most recent in 2018 (reference year: 2017; 6960 households). The “Household Budget and Living Conditions Survey”
(HKÉF) we analysed contains very detailed information on the consumption habits and expenditures of the population, including energy expenditures, but also on the housing situation and general living conditions. The questionnaire consists of two parts: a logbook that households keep for one month regarding their income and expenditure, and a detailed year-end interview collecting information about demography, socio-economic situation of the households, housing characteristics, consumption and income. The databases contain the declared household expenditures at current prices, thus we examined energy costs based on them. It is the best source available for the examination of consumption patterns in Hungary.
First, we present the changes in the intensity and structure of energy consumption over time based on summary indicators on the types of energy used by households. Next, we examine what homogeneous groups of Hungarian households can be identified based on the overall use or combination of energy types, and what characteristics these household types have. Finally, we attempt to explore what socio-demographic factors, in addition to housing and building characteristics, influence different patterns of energy use and behaviour in households, and how the impact of each factor changed over the period under review.
Based on the combination of energy types used, different groups of households were explored using model-based clustering. Given that each of our grouping variables has a high level of measurement, we used the “latent profile analysis” procedure (LPA) [16], to create household types (using the Mclust package of the R programming language).
Explanatory models were analysed using logistic regression to analyse the factors deter- mining different energy use-behaviour patterns. Regression analysis was performed using the STATA 16.1 statistical program.
3. Results
3.1. Energy Types Used, Heating Methods and Their Cost Ratio
Household energy consumption was reviewed based on the household energy costs declared in the data sets and the following energy types were taken into account: electricity, (piped) gas, bottled gas, conventional fuels (firewood, coal, briquettes, coke, charcoal, fuel oil, paraffine) and central heating as well as district.
The average energy costs of households accounted for 13.1% of their total consumption expenditure in 2006, 19.5% in 2012 and 15.8% in 2017. All this reflects the fact that energy prices set loose during the global economic downturn were a much greater burden on households than in the years before and after. Based on the change in the median values of energy expenditures (Figure2), it is evident that the overhead cost cut scheme introduced by the government in 2013 on the one hand reduced household energy costs, but on the other hand in the case of conventional (solid and liquid) fuels, which were not included in the cost cut scheme, energy costs of households increased even more than piped gas expenditures.
In fact, according to the data by the CSO on the average prices of products [17], while the price of m3/HUF of piped gas reached its peak at HUF 136 (approximately 0.38 Euro/m3) in 2012, it then decreased back to HUF 101/m3(0.28 Euro/m3), the price of sawn firewood 100 kg/HUF increased from 2240 HUF to 3740 HUF (from around 6.20 Euro/100 kg to 10.38 Euro/100 kg) between 2006 and 2017.
Figure 2.Changes in the median values of energy expenditures in Hungary between 2006 and 2017. Sources: Secondary processing of the National Household Budget Survey 2007, 2013 and 2018.
One of the excellent indicators of energy supply is the quality of heating. The available data show that in Hungary individual room heating and the use of an apartment heating device are the most common (Figure3a). However, while until 2012 individual room heating was the most common, by 2017 the proportion of households with (circulating) appliances providing heating of the entire dwelling is higher, which (may) indicate(s) the modernization of the stock of flats, the decrease in the share of district heating is also remarkable, that is probably also due to the modernization of the stock of the flats.
Figure 3.Distribution of households by means of heating and energy sources used for heating between 2006 and 2017 in Hungary. Notes: (a) The change in the proportion of households is presented based on the method of heating of the flats concerned; (b) It shows the change in the proportion of households based on the energy used for heating. Sources:
Secondary processing of the National Household Budget Survey 2007, 2013 and 2018.
Due to data collection problems, we can make only limited comparisons regarding the interpretation of the distribution of energy sources used for heating, but it can be established that the most common type of heating during the whole period is gas heating (60–40% of
households), however, it is a remarkable change that the proportion of households using mixed combustion doubled by 2017 (Figure3b).
In the years following the global economic downturn, one-sixth of households (16.3%) were unable to heat their homes to the right temperature in winter. A positive change is indicated by the fact that this number was halved by 2017 (to 7.6%). However, when income positions are reviewed (Figure4), it is evident that by 2017, the proportion of households in the lower strata of society that were unable to heat their homes to the right temperature did not decrease either: 20% of the poorest could not provide warmth in their homes in winter; moreover, the situation in the three lowest income deciles did not change in 10 years (the 2006 level was typical even in 2017). Studying the phenomenon in terms of energy sources used for heating, it is clear that in 2017, the proportion of households using conventional fuels was the highest among those who were unable to heat their homes properly. This is also explained by the fact that these fuels (coal, wood) are more of an energy source for the poor: while in the lowest income tithes more than half of households heat in this way, in the higher income deciles the proportion of those using solid or liquid fuel is less than 10%. For poor households, fighting the winter cold significantly increases the risk of heating with anything to keep their homes warm: even with toxic combustible waste, which causes severe environmental damage as well as health issues.
Figure 4.Distribution of households which able and unable to heat their homes adequately by income deciles between 2006 and 2017 in Hungary. Note: Income deciles are constructed on the basis of per capita household income. The persons included in the sample are arranged in the order of their income and divided into ten equal groups. Each income decile then has 10 per cent of the population. The first income decile contains the lowest income tenth and the last one the highest income tenth. Sources: Secondary processing of the National Household Budget Survey 2007, 2013 and 2018.
3.2. Modes and Intensities of Domestic Energy Consumption
In the following, households are reviewed by groups formed based of the median expenditure spent on energy consumption for each type of energy. Four groups were formed: (1) non-consumers of energy, (2) low, (3) medium, and (4) high energy consumers.
In the three cross-sectional surveys available to us, each household consumes electricity, and in terms of other sources of energy, “non-consumer” households form an independent group. Households paying energy costs around the national median value of expenditures on the type of energy reviewed (plus/minus 20%) were considered to be “average energy consumers”. “Low energy consumers” included households with energy expenditure below 20 per cent of the median value, while “high energy consumers” included households with energy expenditure more than 20 per cent above the median value.
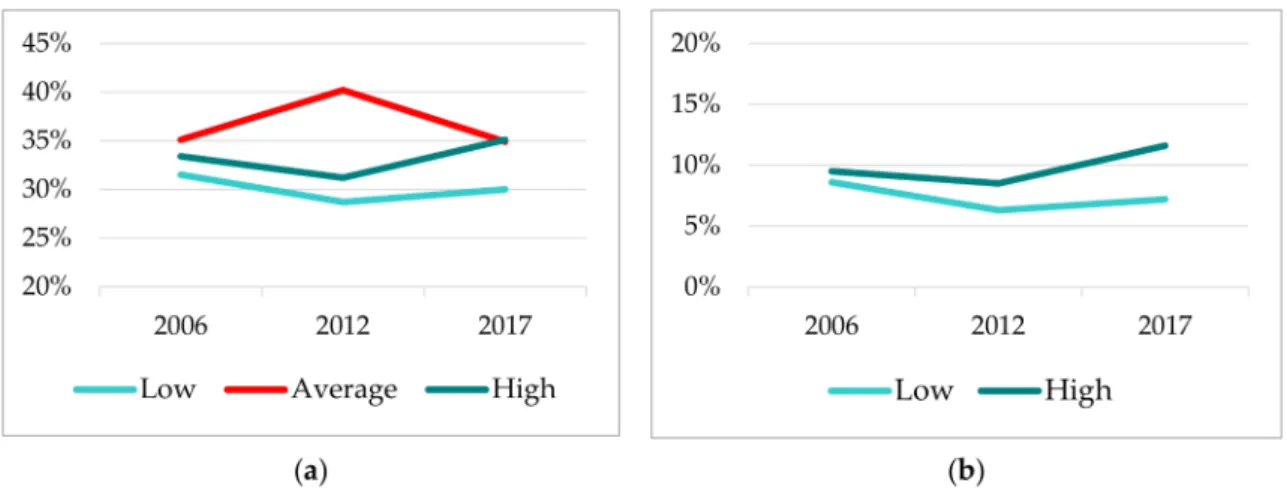
Figure5a shows that slightly more than one third of Hungarian households are high energy consumers (2017: 35.1%) and somewhat less than one third are low energy con- sumers (2017: 30%). Whether reviewing high or low energy consumption, the proportion of each group did not change significantly between 2006 and 2017. The share of high energy consumers decreased minimally to 2012 (from 33.4% to 31.2%) but then it increased to 35% by 2017, and overall an increase of only 1.7 percentage points can be registered in the period under review. The same trend can be observed for low-energy households: a decrease during the first period (from 31.5% to 28.7%), followed by a minimal increase for 2017 (30%), while the overall change is only 1, 5 percentage points. There was a more considerable change in the case of average energy users during the first period: their share increased by 2012 (from 35.1% to 40.2%), but by 2017 it decreased by the same amount, thus in 2017 they were as many as in 2006 (35%). If the groups of high and low energy consumers are formed according to stricter criteria, i.e., households with more than twice the national median value are considered high consumers, and households with less than half the median energy as taken as low energy consumers, it can be established that there was hardly any change in terms of the distribution of either household type between 2006 and 2017 (see Figure5b).
Figure 5.Changes in the proportion of households with different energy intensities between 2006 and 2017 in Hungary.
Notes: (a) A household is considered low energy consumer if its energy expenditure does not exceed the 20 per cent of median value; high energy consumer if its energy costs exceed the median value by 20 per cent; (b) Low energy consumption if its energy costs do not exceed half the median value, high energy consumption if its energy costs exceed twice of the median value. Sources: Secondary processing of the National Household Budget Survey 2007, 2013 and 2018.
The intensity of use of each energy type also reflects a high degree of stability (see Figure6) except for a single energy source: conventional fuel. The share of households not consuming conventional fuels showed a significant decrease (13.8 percentage points) and the rate of decline was stronger in the post-economic crisis period (2006–2012) than in 2012–2017. At the same time, the share of intensive users of conventional fuels increased:
less than a tenth (9.1%) of households belonged to this category immediately before the global economic downturn, while in the post-crisis period as many as one-sixth to one- seventh (15.5% and 14.8%, respectively) Our calculations were made not only for the global (total) household energy consumption, but also for the annual energy consumption per 1 m2and 1 person per household. Based on the results obtained, the same situation is seen as described above (although we could not accomplish the calculation according to the number of households in 2013 as the headcount per households variable is not included in the database provided to us).
Figure 6. Changes in the proportion of households with different energy intensities by types of energy between 2006 and 2017 in Hungary. Sources: Secondary processing of the National Household Budget Survey 2007, 2013 and 2018.
As the stability of the distribution of the different types of energy-using households presented refers only to the intensity of energy used and to each type of energy (i.e., the proportions of household energy costs) and not to changes in buildings and flats, it is advisable to review households with different energy use in terms the characteristics of the buildings and flats. In all three years of the period under review, among the high energy consuming households, in brick-built detached houses, or else in residential areas of detached houses, the proportion of those living in 3 or 4-room, medium-size (76–100 m2) property is the highest, yet a number of significant changes can be observed between the periods in terms of other housing and settlement characteristics. It is evident (see TableA1 in the AppendixA) that the share of households with high energy costs almost tripled by 2012 in traditional urban residential areas (from 6.9% to 19.2%) and then somewhat (by 4.3 percentage points) decreased to 2017. At the same time, their share decreased only minimally in both detached-house districts and rural areas, while their share remained essentially unchanged in housing estates and villas. The other significant rearrangement is yielded when review the data by type of buildings/houses: the proportion of energy- intensive people living in detached houses decreased significantly by 2017 (from 68.4% to 59%), while those living in multi-apartment condominiums (both with less-than-10-flat and more-than-10-flat condominiums) rocketed by the end of the period (the largest increase—
more than double—occurred in condominiums with less than ten dwellings). It is also noteworthy that while in 2006 only 1% of energy-intensive households lived in one-room or at most one-bedroom flats, in 2012 their share was already 5.5%; in 2017 it was over 6.5%.
Simultaneously, the share of those living in in 3–4-room properties fell (from 62% to 54%).
Consistent with these changes, the proportion of energy-intensive consumers living in large (mainly between 76 and 100 m2) properties decreased significantly, and the rate those living in properties larger than 100 m2just moderately; the proportion of energy-intensive flats smaller than 36 m2has more than quintupled. Based on the year of construction, their share increased significantly not only in the oldest houses/flats built before 1945, but also in newer (after 1999) buildings (doubled in the latter case). It is important to point out that while in 2006 almost two-fifths of this group lived in villages, by 2012 and 2017 only a quarter, but their share in the capital and smaller rural towns increased significantly by the end of the period under review (the proportion of those living in county capitals remained unchanged in this regard).
Trends for low-energy households were more or less the opposite to those described for high-energy consumers, involving four very significant changes. Although in all three cross-sectional years the share of people living in low-energy-consuming households, similarly to high energy consumers, is the highest amongst people living in residential areas characterised by detached-houses, their proportion has also surged significantly (from 16% to 23.5%) in residential areas of rural character while in housing estates and traditional urban areas declined considerably. Similarly considerable change can be observed in terms of the type of building: while in 2006 households living in condominiums with 10 or more apartments belonged to the low energy consumers, by 2017 their share was the highest amongst those living in detached houses (42% in 2006; 62% in 2017). Based on the floor area of the property, it can be established that while in 2006 more than a third (36.8%) of low energy consumers lived in apartments with a floor area of 36–55 m2, a quarter in properties with a floor area of 56–75 m2and a further fifth in properties even larger, by 2012 and 2017, their share decreased in smaller apartments and increased in properties larger than 56 m2, but especially in properties above 100 m2(in the latter case, there was a 2.5-fold increase).
In terms of the type of settlement of the place of residence, the biggest change is that their proportion decreased to almost half in the capital, while in the smaller rural towns and villages we registered an increase of 7–8 percentage points.
Based on the results, it can be assumed that the stock of detached houses has expanded in recent years with more newly built properties on the one hand, and a significant part of the detached houses have been modernized on the other hand. At the same time, households living in detached houses also include the largest energy consumers, which is obviously related to the characteristics of the buildings (detached houses are larger than typical flats in condominiums and housing estates, so their heating and lighting are more expensive). The rising and then declining trend of intensive energy use in the energy consumption of condominium flats is presumably related to the significantly rising energy prices in the early 2010s and then with the decreasing prices after the government intervention. All this suggests that it is worth reviewing the energy consumption habits of Hungarian households more meticulously than before, therefore in the next step we will analyse the energy use-behaviour patterns of households based on the joint consideration of the intensity of the types of energy used.
3.3. Typological Profiles of Domestic Energy Consumers
The study of energy consumption was deepened by exploring further details through examining the groups of Hungarian households according to the combination of the intensities of the types of energy used. The use and intensity of different energy sources varies, as, for example, piped gas is usually used for heating, while and propane gas can only be used for cooking, their mixing, however, points out the housing and social differences of the households and flats. For example, where there is only electricity in the household, propane gas can be used for cooking, or where heating is only possible with conventional fuel, electricity or propane gas can be used for cooking. In addition, as mentioned in the introductory part, the type of energy used depends not only on the decisions of households, but also on the available opportunities and infrastructure.
Based on a combination of variables measuring the intensity of five types of energy (electricity, pipeline/natural gas, propane gas, conventional fuel and central heating), homogeneous groups of households were identified using model-based clustering (latent profile analysis, LPA). LPA is a method that, based on high-level indicators, identifies unobservable, latent groups of households with similar energy consumption patterns. Our researcher’s intention was to find consumer patterns that are typical for a group of the surveyed households, taking into account the intensity of the use of different types of energy. Thus, we used a solution (model-based clustering) that allowed us to form a model structure whereby typical energy consumer groups could be identified.
During the analysis, several models were evaluated in all three samples: 2–7 group solutions were examined and the fitness of the model (Bayesian information criterion, BIC;
Akaike information criterion, AIC), the significant result of Lo–Mendell–Rubin likelihood ratio (LMR-LRT), thep-values of bootstrap likelihood ratio test (BLRT), group sizes (at least 5% of the sample), and higher entropy values were taken into account to determine the optimal model solution [18,19]. In the three samples, the AIC and BIC values decreased continuously with increasing number of groups, however, the rate of decrease began to moderate only after the 6-class solution, although the entropy value of the 7-class solution—in 2006 and 2012 samples—was higher than that of the 6th grade. Bearing both the proportion of the smallest class and interpretability in mind, the 6-class structure was adopted in all cases.
First, we present the types of Hungarian households emerged based on energy con- sumption in the latest sample, 2017 (see Table1). The results show that households have a larger share (22.1%), representing some one-fifth of households (class 4) including the highest electricity and piped gas consumers (they are the high electricity and gas con- sumers) who do not use other energy source or at very low intensity. In two groups of roughly similar size (class 1[18.6%] and3[17.8%]), in addition to the average electricity consumption, the use of conventional fuels is typical, with the difference that households inclass 1supplemented it with using significant amounts of propane gas as well (obviously for cooking). Unlike the other clusters, households inclass 5(17.5%) andclass 6(15.2%) are characterized by low electricity and gas consumption, however, the use of central and district heating is dominant in the latter, i.e., inclass 6. And there is a marginal group (class 2[8.8%]), which, similarly to the households of groups 1 and 3, is characterized by low—below average—electricity and gas consumption, however, it is also characterized by the fact that it also uses other energy sources with greater or lesser intensity (propane gas, conventional fuels and central heating).
Table 1.Latent classes formed based on the energy consumption of Hungarian households in 2017.
Class % Energy Types and Intensities Profile
1 18.6 high T, high P intensive use of conventional fuels and propane gas
2 8.8 low all types low energy consumption
3 17.8 high T intensive use of conventional fuels
4 22.1 high E, high G intensive electricity and gas consumption 5 17.5 low E, low G low electricity and gas consumption 6 15.2 high D, low E, low G intensive use of central-district heating Source: National Household Budget Survey 2018.
Latent profile analysis explored significant differences between both high and low energy consumption groups: visibly, intensive (high) central heating users (class 6) and intensive conventional fuel users (class 3) consume other energy types/energy sources to a low extent; and low electricity and gas consumption is not necessarily associated with low-intensity use of other energy sources (such as in the case ofclass 5vs.class 2).
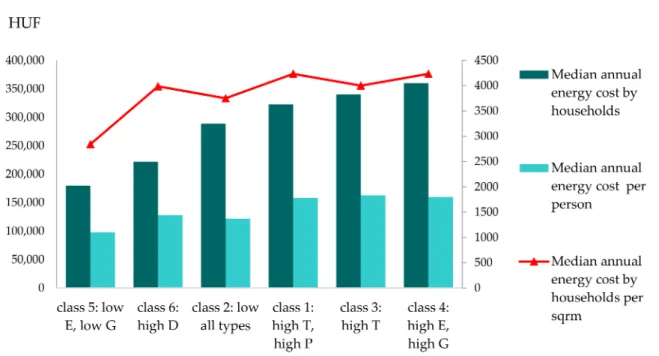
We wish to point out that the dominant energy use of groups formed based on energy use combinations does not mean that the global energy consumption of a certain consumer group is (also) high, as these are consumer behaviours, and do not directly reflect the intensity of total energy consumption. Figure7presents the differences between the groups in terms of global energy cost and energy cost intensity calculated based on household size (number of employees) and the size (floor area) of the flat concerned. Thelargest consumers of electricity and gas(class 4) are actually the highest global energy consumers, but the median energy cost per capita is not higher in this class but in the class ofintensive conventional fuel users(class 3). The global annual energy consumptionof intensive district heating users(class 6) is the second lowest. In essence, the three largest energy consumers (either the average annual energy cost or the average annual energy cost based on headcount) areclass 4,class 3andclass 1, i.e., intensive electricity and gas consumers, intensive conventional fuel users and those who supplement their high fuel consumption with the use of propane gas. The lowest energy consumers are the households ofclass 5,class 6andclass 2: the low electricity
and gas consumers, the intensive district heating users and the low-intensity users of all types of energy.
Figure 7. The median of the average energy costs of the latent classes by household, per person and per m2. Note: In the figure, the latent classes are arranged in ascending order according to the median of the average annual energy cost by household.
The housing, building, and socio-demographic characteristics of each consumer group are summarized in TableA2in the AppendixA. Among the households ofthe group of largest electricity and gas consumers(class 4)—compared to the total sample—the proportion of those living in their own large (over 76 m2and more than 3-room), in detached or semi-detached houses in residential areas and condominiums in traditional urban built-up with higher status (with high-school diploma or higher, belonging to income quintiles 4 and 5) is relatively high. In terms of household composition, they live in smaller-than-average households: they are typically middle-aged couples without children or retired couples.
The proportion of people living in small settlements and villages is low.
The class ofintensive traditional fuel and propane gas users(class 1) typically consists of households situated in, 2-room, detached houses (built before 1969) in rural residential areas and villages, of whom, compared to the total sample, the low status (low-income and low-education) is higher.
The other class ofintensive traditional fuel users(class 3) also has a high proportion of households living in detached houses in rural towns and villages. However, unlikeclass 1, the households here are owners of larger properties (more than 3 rooms, more than 76 m2) and the class also includes a high proportion of those in the 3rd and 4th income quintiles.
In terms of household composition, the proportion of couples without children and singles is low and the proportion of couples with children and couples without children aged 55–64 is slightly higher than the sample average.
Among theintensive users of district heating(class 6), who are also characterized by low electricity and gas consumption, there is a remarkably high number of households living in up to 2-room flats built between 1970 and 1989, in urban condominiums or residential buildings with more than 10 flats in the larger rural cities and in the capital, and in urban areas. proportion of households living in condominiums. In terms of their social status, the proportion of those in the top income quintile and those with a general high-school diploma is high, while the proportion of graduates is also slightly higher than the sample average. In addition, the proportion of households living in rented flats is also high within this group.
The housing and socio-demographic characteristics of the low electricity and gas consumption group (class 5) are very similar to those ofclass 6: they also typically live in relatively small (up to 2 rooms and up to 75 m2) condominium flats in a slightly higher than average proportion in cities and the proportion of households living in rented (especially non-market rented) property is also high, but, in contrast to members of class 6, the proportion of couples raising children is low and that of retired households is high.
The low energy users (class 2) households are characterized by the fact that the owners typically have low-education but higher-income (4th income quintile), they are elderly without children (55–64 years old) or retired, living in detached-hose or rural residential areas in smaller rural towns and villages, in properties larger than average (above 75 m2 and with more than 3 rooms).
It is evident from Figure 8 that the pattern of energy use profiles in the sample shows very strong similarity in three periods. Three differences can be observed: in 2006 (compared to 2012 and 2017), high central heating use (class 6) was coupled with high—
well above average—electricity consumption, and in 2012 in the group of low energy consumption (class 2), not all energy sources uses are of low intensity, but the use of conventional fuels is high, and—also in 2012—the high use of conventional fuels and propane gas (class 1) is combined with high electricity consumption. Table2presents the descriptions of the classes of the three samples for convenience.
Figure 8.Cont.
Figure 8.Latent groups of households based on their energy consumption in three samples. Notes: (a) Non-standardized averages by energy type within each class in 2006; (b) Non-standardized averages by energy type within each class in 2012;
(c) Non-standardized averages by energy type within each class in 2017. Sources: Secondary processing of the National Household Budget Survey 2007, 2013 and 2018.
Table 2.The descriptions of the latent classes in three samples.
2006 2012 2017
Class % Energy Types Class % Energy Types Class % Energy Types
class 1 15.2 high T, high P class 1 19.1 high T, high P, high E class 1 18.6 high T, high P
class 2 6.9 low all types class 2 8.9 low E,G,P,D, high T class 2 8.8 low all types
class 3 11.9 high T class 3 14.4 high T class 3 17.8 high T
class 4 27.7 high E, high G class 4 30.8 high E, high G class 4 22.1 high E, high G
class 5 22.8 low E, low G class 5 13.5 low E, low G class 5 17.5 low E, low G
class 6 15.5 high D, high E, low G class 6 12.4 high D, low E, low G class 6 15.2 high D, low E, low G Sources: National Household Budget Survey 2007, 2013 and 2018.
We are aware of the fact that the comparison of individual household types and their proportions over time is limited; in any case, the dominant household type is the large electricity and gas consuming households (class 4) throughout the period under review, and our results show a positive change and decrease. It is also a positive result that the share of low electricity and gas consuming households (class 5) still constitutes a considerable proportion, presumably due to the introduction of stricter energy standards and public policy incentives to improve the energy efficiency of buildings/flats.
3.4. Factors of Domestic Energy Consumption
In the next part of the analysis, we explored the determinants of the household profiles generated as a result of the intensity configurations of the different types of energy used by households. Specifically, we examined how the living conditions and social background of the consumer groups (classes 1–6) identified by latent profile analysis affect their energy consumption behaviour, i.e., the fact of which group they belong.
Thus, thedependent variablesof our explanatory models are variables measuring mem- bership in each energy consumer class, and theindependent variables(predictors) can be divided thematically into two groups: (1) ‘building variables’ and (2) ‘socio-demographic variables’. (1) To characterize the buildings and flats, the following variables were included in the models: living environment, building type and year of construction, floor area of the flat, number of rooms, type of masonry, occurrence of technical problem in the flat (Is the property characterized by any of the following problems: the doors and windows are in bad condition, the masonry or floor is damp, the ceiling is leaking), and settlement type and regional location where the apartment is situated. (2) The socio-demographic
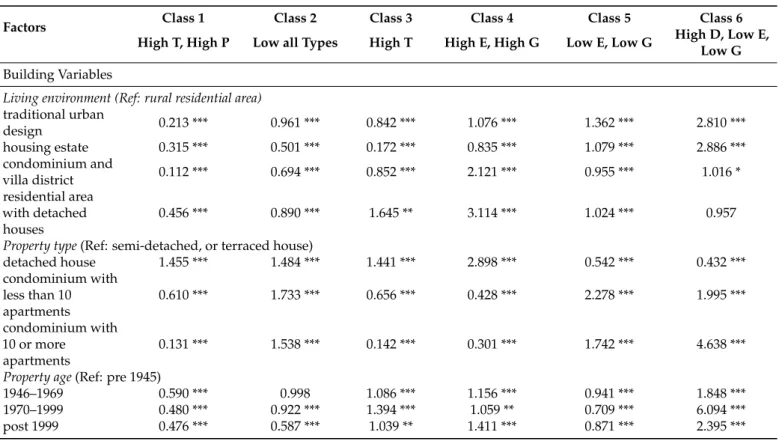
variables include variables describing household composition (The types of household composition were based on the age, marital status and number of dependent children of the reference person.), size, income status (The databases available to us contain variables of income deciles calculated from persons sorted by the disposable (net) income of the household/headcount of households, so we used this variable to describe the income situation of the household during the analysis), upon what grounds the property is used, educational attainment and economic activity of the reference person, and length of resi- dency. During the estimation procedure, each model was built step by step: the explanatory factors were included in groups, step by step, so that we could also examine the effect of each variable group on the dependent variable and on each other. A total of 18 model specifications were estimated (all significant). Models including only the characteristics of the properties (BUILDING MODELS) explain 11 to 68 per cent of each energy consumption behaviour; the most for high central heating consumption and the least for the ‘low all types’. The explanatory power of models made up of only socio-demographic variables (SOCIO-DEMOGRAPHIC MODELS) is lower in each case: 6–32 per cent of the dependent variable is usually explained by them. The final models combining building and socio- demographic factors (FINAL MODELS) explain 6–32 per cent of the variability (R2details can be found in AppendixA, TableA3). ANOVA showed that the difference in explanatory power between the models containing building variables only and that containing socio- demographic variables in addition was significant (p< 0.001) implying that the inclusion of socio-demographic variables increases the explanatory power of the models. All this proves that building and housing characteristics explain the largest variation of the energy consumption behaviours under review, but the inclusion of socio-demographic variables further increases the explanatory power of the models. The results of the complete models, including all predictors, are presented in Table3.
Table 3.Summary of the results from the logistic regression on the factors that have different impacts on the energy use behaviour patterns of households, Exp(B).
Factors Class 1 Class 2 Class 3 Class 4 Class 5 Class 6
High T, High P Low all Types High T High E, High G Low E, Low G High D, Low E, Low G Building Variables
Living environment (Ref: rural residential area) traditional urban
design 0.213 *** 0.961 *** 0.842 *** 1.076 *** 1.362 *** 2.810 ***
housing estate 0.315 *** 0.501 *** 0.172 *** 0.835 *** 1.079 *** 2.886 ***
condominium and
villa district 0.112 *** 0.694 *** 0.852 *** 2.121 *** 0.955 *** 1.016 *
residential area with detached houses
0.456 *** 0.890 *** 1.645 ** 3.114 *** 1.024 *** 0.957
Property type(Ref: semi-detached, or terraced house)
detached house 1.455 *** 1.484 *** 1.441 *** 2.898 *** 0.542 *** 0.432 ***
condominium with less than 10 apartments
0.610 *** 1.733 *** 0.656 *** 0.428 *** 2.278 *** 1.995 ***
condominium with 10 or more
apartments
0.131 *** 1.538 *** 0.142 *** 0.301 *** 1.742 *** 4.638 ***
Property age(Ref: pre 1945)
1946–1969 0.590 *** 0.998 1.086 *** 1.156 *** 0.941 *** 1.848 ***
1970–1999 0.480 *** 0.922 *** 1.394 *** 1.059 ** 0.709 *** 6.094 ***
post 1999 0.476 *** 0.587 *** 1.039 ** 1.411 *** 0.871 *** 2.395 ***
Table 3.Cont.
Factors Class 1 Class 2 Class 3 Class 4 Class 5 Class 6
High T, High P Low all Types High T High E, High G Low E, Low G High D, Low E, Low G Floor area(Ref: below 36 m2)
36–55 m2 2.980 *** 0.1140 ** 1.684 *** 1.388 *** 1.234 *** 1.510 ***
56–75 m2 3.376 *** 0.708 *** 2.657 *** 2.053 *** 1.517 *** 0.243 ***
76–100 m2 1.765 *** 1.731 *** 3.449 *** 2.659 *** 1.224 *** 0.117 ***
over 100 m2 1.780 *** 0.643 *** 4.021 *** 3.081 *** 0.793 *** 0.049 ***
Number of rooms(Ref: up to 1 room)
2 rooms 0.566 *** 1.210 *** 0.876 *** 2.275 *** 1.604 *** 1.484 ***
3–4 rooms 0.331 *** 1.535 *** 1.181 *** 2.657 *** 0.442 *** 0.049
5 rooms or more 0.274 *** 1.704 *** 1.296 *** 2.857 *** 0.486 *** 0.383 ***
Wall type(Ref: panel, medium- or large building blocks, concrete)
Brick, stone 1.805 *** 0.814 *** 1.156 *** 3.547 *** 4.906 *** 0.143 ***
Adobe 1.643 *** 1.033 * 0.893 *** 0.010 * 3.922 *** 0.070 ***
Technical problem in the propertya(Ref: Not typical)
Typical 1.996 *** 1.113 *** 0.734 *** 0.848 *** 0.765 *** 0.616 ***
Settlement type(Ref: village)
Capital 0.086 *** 0.170 *** 0.246 *** 3.057 *** 3.061 *** 2.627 ***
County capital 0.210 *** 0.287 *** 0.808 *** 2.315 *** 1.919 *** 2.510 ***
Other town 0.651 *** 0.856 *** 1.272 *** 1.385 *** 1.796 *** 0.967 **
Region(Ref: the Southern Great Plain)
Central-Hungary 0.800 0.417 *** 0.874 1.312 *** 2.939 1.945 ***
Central-
Transdanubia 2.966 *** 1.263 *** 1.036 ** 1.185 *** 0.332 *** 1.950 ***
Western-
Transdanubia 2.150 *** 0.605 *** 1.545 *** 0.430 *** 0.632 *** 2.036 ***
Southern-
Transdanubia 5.447 *** 1.258 *** 0.701 *** 0.489 *** 0.440 *** 2.610 ***
North-Hungary 3.104 *** 0.680 *** 1.763 *** 0.681 *** 0.576 *** 1.164 ***
Northern Great
Plain 1.124 *** 0.848 ** 3.580 *** 0.758 *** 0.796 *** 1.355 ***
Socio-Demographic Variables Household size(Ref: 5 people or more)
1 or 2 people 0.595 *** 2.745 *** 0.642 *** 2.789 *** 3.721 *** 1.204 ***
3 or 4 people 1.821 *** 0.650 *** 1.718 *** 1.959 ** 2.887 *** 0.888 ***
Household type(Ref: Elderly retired couple or single pensioner) Young couple
without a child or a young single person
1.595 *** 0.272 *** 0.822 *** 0.559 *** 1.886 *** 2.221 ***
Couple with
children (30–54 y.o.) 2.863 *** 0.665 *** 2.145 *** 0.745 *** 0.882 * 1.136 ***
Couple without
children (30–54 y.o.) 2.506 *** 0.624 *** 1.034 * 1.738 *** 0.896 *** 1.871 ***
Elderly couple without children (55–64 y.o.)
1.948 *** 0.858 *** 1.171 *** 0.751 *** 1.013 * 1.169 ***
Table 3.Cont.
Factors Class 1 Class 2 Class 3 Class 4 Class 5 Class 6
High T, High P Low all Types High T High E, High G Low E, Low G High D, Low E, Low G Income status(Ref: 5th quintile)
1st quintile 2.995 *** 0.714 *** 0.891 *** 0.329 *** 2.264 *** 0.729 ***
2nd quintile 1.746 *** 0.641 *** 1.212 *** 0.554 *** 1.905 *** 1.154 ***
3rd quintile 1.464 ** 0.785 *** 1.234 *** 0.757 *** 3.505 *** 0.998
4th quintile 0.981 * 1.114 *** 1.011 * 0.905 *** 1.287 *** 0.870 **
Grounds for using the property(Ref: free accommodation)
Owner 3.648 *** 1.403 *** 1.901 *** 2.410 *** 0.533 *** 1.808 ***
Private sector
tenant 1.446 *** 0.380 *** 1.069 1.001 1.645 *** 2.793 ***
Educational attainment of HRP(Ref: Higher)
Elementary 5.952 *** 1.2976 *** 0.910 *** 0.664 *** 0.706 *** 0.742 ***
Secondary without high-school diploma
4.109 *** 1.433 *** 1.244 *** 0.662 *** 0.687 *** 0.980
Secondary with high-school diploma
2.171 *** 1.218 *** 1.149 *** 0.847 *** 0.957 *** 0.995
Economic activity of HRP(Ref: Other inactive)
Employment 1.149 *** 0.938 *** 3.102 *** 1.277 *** 1.959 *** 1.663 ***
Pensioner 0.892 *** 1.624 *** 1.201 *** 1.064 * 1.611 *** 0.878 ***
Length of residency(Ref: more than 30 years)
4 years or less 0.553 *** 0.979 ** 0.721 *** 0.636 *** 1.925 *** 0.842 ***
5–10 years 1.720 *** 0.740 *** 1.167 *** 0.875 *** 1.175 *** 1.405 ***
11–20 years 1.671 *** 1.022 * 1.855 *** 1.270 *** 1.210 *** 0.937 **
21–30 years 0.890 *** 1.019 * 0.895 *** 0.991 1.240 *** 1.245 **
N 6444 6444 6444 6444 6444 6444
R2 0.415 0.184 0.301 0.440 0.312 0.692
Note: ***p< 0.001; **p< 0.01; *p< 0.05. (a) Technical problems occur: the doors and windows are in bad condition, the masonry or floor is damp, the ceiling is leaking.
Those of high-status (tertiary-educated, belong to the top-income quintile, middle- aged) childless middle-aged couples with their own real estate have the best chance of getting into the group of the largest consumers of electricity and gas (class 4), and use other energy sources to a lesser extent compared to the reference category of retired couples or to single retirees. Reviewing the effect of residence and building characteristics, it can be established that households situated in residential areas of detached houses, condominiums and villa districts, living in the larger-size properties with the higher number rooms and in the better condition, have the higher chance to become high energy consumers. The geographical location of the apartment is also decisive: the capital city has a significant impact, while other metropolitan settlements have a more moderate impact in the most developed regions of the country (Central Hungary, Central-Transdanubia and the Southern Great Plain).
In contrast, the intensive use of conventional fuel and propane gas (class 1), which is associated with low electricity and gas consumption, is strongly influenced by the low social background: it is more characteristic of larger households with low (at most secondary school without a high-school diploma) education and low income status, but active in the labour market (the increase in chances is linear with the increase in household size). Reviewing the effect of household composition compared to retired households used as a reference group, all other household types increase their chances of getting into this group, although couples with or without children between the ages of 30 and 54 have the best chance to do so. There is a significant difference between property owners, tenants and those using the homes for free: homeowners are almost four times more likely, tenants are slightly more moderately, i.e., one and a half times more likely to fall
into this cluster. Analysing the building characteristics, we found that the determining factor in the high use of conventional fuel and propane gas is the rural residential area, the small detached house, which was built of brick or adobe before 1945. The poor technical condition of the flat/house is also positively related to this pattern of energy use behaviour (compulsion). The economically less developed regional-territorial location also increases the probability of getting into the group (areas of highest odds ratios: Southern Transdanubia and, Northern Hungary).
High conventional fuel use(class 3), which, however, is not coupled with propane gas and intensive use of other energy sources, is more prevalent for homeowners with 3–4 years of secondary education in the 2nd and 3rd income quintiles, who are typically couples with children or children or elderly couples without children. In contrast to theclass 1 households of other traditional fuel users, these households live in brick, well-maintained, larger detached houses constructed between 1970 and 1999 and situated in the lowest economically developed regions of the country (Northern Great Plain, Northern Hungary).
Intensive use of central and district heating(class 6)—coupled with low electricity and gas consumption—is positively related to labour market activity, high (tertiary) education and belonging to the 2nd and highest (5th) income quintiles. In terms of their family background, young couples or singles without children are most likely to get in here and retired people have the least chance in this respect. Compared to free home users, tenants have a much higher (nearly three times) and homeowners a more moderate (almost double) chance of being included in this group as intensive central heating users. Living in the capital or rural big city (due to for example, the availability of district-heating infrastructure) in multi-apartment, panel housing estate and in smaller (2-room, 36–55 m2) apartment also increases the chances of belonging into this class.
Low electricity and gas consumers(class 5) have a high chance of having the highest level of education, but low chances of being in the highest income quintile (typically the ones belonging to the 3rd and 1st income quintiles are found here). Another decisive socio-demographic factor is the household size of 1–2 people: childless young couples or single young people and retired couples tend to be low energy and gas consumers. This energy consumption behaviour is more likely to occur among tenants and with less chance among homeowners. In terms of building and housing characteristics, traditional urban, multi-apartment condominiums, pre-1945 construction, metropolitan and big city (in the most developed region of the country) and smaller (up to 2 rooms) housing sizes have a significant impact in this respect.
Those using all energy sources with low intensity(class 2) are most likely to come from households belonging to the 4th income quintile and least likely to come from households with the highest educational attainment. The composition of the household also has a statistically significant effect: retired couples or single retirees are more likely to have low energy consumption. The assessment of the impact of building and housing characteristics shows that the location in rural residential area (mainly in Southern Transdanubia, Central Transdanubia and the Southern Great Plain), the construction of the house before 1945, the poor technical condition of the apartment and the medium (76–100 m2) size are all decisive factors in this energy consumption behaviour.
4. Discussion and Conclusions
Our study reviewed the energy using habits of Hungarian households and their de- velopment over time using the databases of three large-sample questionnaires. In addition to exploring the evolution of the intensity and structure of household energy consumption over time, we also analysed how different energy use behaviours correlate with factors re- lated to flats, buildings, as well as certain socio-demographic characteristics of households.
Despite the fact that the decisive factors of household energy consumption—especially the variables related to buildings and flats that can be targeted by energy interventions—has been widely researched abroad [20–22], few studies have been conducted in Hungary so far in this regard. An additional added value of our research is that it analyses the correlations
between energy use patterns of households and socio-demographic, as well as building and housing characteristics by taking into account the configurations of the intensity of energy sources used by households.
Our descriptive analysis results showed that the energy expenditures of Hungarian households decreased overall between 2006 and 2017, which is presumably related to the government’s overhead cost cut scheme introduced in 2013, however, this did not affect households using conventional fuels for heating. Wood prices have risen signifi- cantly over the past decade, and by 2017, spending on conventional fuels exceeded the spending on households using piped gas. The results also point out that the use of con- ventional fuels is much more common in financially disadvantaged groups than among privileged households.
Using latent profile analysis, we explored the consumer profiles of Hungarian house- holds based on the combination of the intensities of the energy sources used. Based on our results, the most significant pattern of energy consumer behaviour in Hungary is intensive electricity and gas consumption, which characterizes more than one-fifth of households, which do not use other energy sources. Our detailed analysis results also showed that these large consumers of electricity and gas are in fact (also) the highest global energy consumers.
On the other hand, the use of conventional fuels is dominant in two groups of Hungarian households of roughly similar size (approximately 19% and 18%), with the difference that the households of one of these groups supplement this with significant propane gas use.
One type appears to be marginal among households (with less than a tenth of households):
it includes households with low electricity and gas consumption, but households in this class also uses other energy sources with greater or lesser intensity. Furthermore, there are two groups of low-intensity electricity and gas consumers (17 and 15% of households), with the difference that one of these groups is also typically use central and district heating.
Our logistic regression analyses indicated that building and housing characteristics offer far the strongest explanation for different energy consumption behaviours, however, the inclusion of socio-demographic variables further increased the explanatory power of the models (we found that the effect of socio-demographic variables decreased significantly after house and flat characteristics had been controlled). In general, foreign studies [23–26]
also find that the building or flat-size and flat type are the most significant precursors of household energy consumption. Our analysis showed that different energy consumer behaviour patterns are differently related to the socio-demographic characteristics of housing and household.
According to our results, the households most at risk in term of energy vulnerability are “intensive conventional fuel and propane gas users”: those low-status (up to high school graduates with no high school diploma, and characterised by low income status) homeowners of brick or adobe detached small (not exceeding 75 m2) houses constructed before 1945, with poor technical condition and lacking technical upgrading, situated in rural areas in the less economically developed regions of the country. The “largest consumers of electricity and gas”, who are typically middle-aged couples without children, and with high status in terms of their social background (higher education, top income quintile), living in large and multi-room houses in detached-house residential areas of the capital and other large cities appear to be less vulnerable.
There are several limitations to our research. Our analysis was based on the energy expenditures of households. The databases analysed by us contain the expenditures of households on energy, broken down by different energy sources, whereby we revealed the types of energy consumers of Hungarian households. At the same time, the consumption data in the databases always include household expenditures at current prices of the period concerned, thus the comparability of these results over time is highly vulnerable to inflation and price changes for individual products. This is especially true for energy prices, where, according to the overhead cost cut scheme introduced in recent years by the government, for example, the prices of gas and electricity are unchanged, while there has been a significant increase in the price of conventional solid fuels, which has a significant
impact on the structure of household energy expenditure. A further limitation of our research is that we did not have the opportunity to fully apply the Expenditure-based Approach known in the literature, as the databases provided to us do not contain the variable measuring the net income of households, only the variable of income decile. Due to the lack of the variable income, the database did not provide an opportunity to form statements about the real burden of energy expenditures to Hungarian households. Further research is needed in the future, taking into account the evolution of both income and prices, to further explore the issue of access to energy in terms of Hungarian households.
Author Contributions:Conceptualization,Á.G.,Á.H. and K.B.; methodology,Á.G.,Á.H. and K.B.;
software,Á.G. and K.B.; validation,Á.G. and K.B.; formal analysis,Á.G.,Á.H. and K.B.; writing—
original draft preparation,Á.G. and K.B.; writing—review and editing,Á.G.,Á.H. and K.B.; visual- ization,Á.G. and K.B.; supervision,Á.G.; funding acquisition,Á.G. All authors have read and agreed to the published version of the manuscript.
Funding: This research was funded by the Ministry of Innovation and Technology of Hungary from the National, Research, Development and Innovation Fund (grant number K 128965) and by the Mobility Research Centre project of the Hungarian Academy of Sciences’ (HAS) Excellence Cooperation Programme.
Institutional Review Board Statement:Not applicable.
Informed Consent Statement:Not applicable.
Data Availability Statement:This document has been prepared by using the National Household Budget Survey 2007, 2013 and 2018 datasets of the Hungarian Central Statistical Office (HCSO). The datasets are avaiable at the safe centre of HCSO. The calculations in the study and the conclusions drawn are exclusively the intellectual products of the authors.
Conflicts of Interest:The authors declare no conflict of interest.
Appendix A
Table A1. Descriptive statistics of high and low energy consuming households by building and flat characteristics, 2006–2017.
High Energy Consumer (%) Low Energy Consumer (%)
2006 2012 2017 2006 2012 2017
Living environment
traditional urban design 6.9 19.2 14.9 21.3 16.3 11.6
housing estate 19.5 16.9 17.7 26.7 23.9 18.3
condominium and villa district 2.1 3.2 4.9 3.4 4.1 3.4
residential area with detached houses 46.0 45.9 42.7 28.7 31.8 36.2
residential area of rural character 22.6 14.0 16.9 16.2 22.1 23.5
suburbs and other 2.9 0.8 2.8 3.8 1.8 7.0
Property type
detached house 68.4 55.1 59.6 42.7 62.5 62.1
semi-detached or terraced house 4.6 4.9 6.5 4.7 4.9 6.7
condominium with less than 10 apartments 2.3 5.7 4.6 5.6 3.9 5.1
condominium with 10 or more apartments 24.4 34.0 28.1 45.9 27.3 25.0
other 0.3 0.3 1.2 1.1 1.4 1.1
Property age
Before 1945 10.5 16.6 16.2 29.4 22.1 21.1
1945–1969 21.9 20.0 24.6 35.2 37.7 35.7
1970–1989 63.6 58.9 51.1 34.1 37.4 37.6
After 1999 4.0 4.5 8.0 1.3 2.9 5.6
Table A1.Cont.
High Energy Consumer (%) Low Energy Consumer (%)
2006 2012 2017 2006 2012 2017
Floor-area
Below 36 m2 0.8 2.4 4.3 9.9 7.9 5.7
36–55 m2 12.7 17.9 17.3 36.8 27.2 25.8
56–75 m2 21.5 21.8 19.2 27.0 29.0 27.5
76–100 m2 36.9 32.1 30.9 22.6 27.9 30.9
Over 100 m2 28.1 25.8 27.3 3.7 8.0 10.1
Number of rooms
Up to 1 room 1.1 5.5 6.5 19.7 15.0 10.9
2 rooms 26.0 25.5 25.9 52.1 48.8 45.2
3–4 rooms 62.6 59.2 54.3 27.0 34.9 40.2
5 or more rooms 10.3 11.8 13.3 1.2 1.3 3.7
Settlement type
Capital 17.7 30.0 24.0 22.8 11.7 13.5
County capital 18.4 18.4 18.8 28.1 18.1 23.2
Other town 26.5 26.0 30.9 25.1 35.3 31.0
Village 38.1 25.7 26.4 24.0 34.9 32.3
Source: Secondary processing of the National Household Budget Survey 2018.
Table A2.Housing, building, household and socio-demographic characteristics of latent classes formed based on the energy consumption of Hungarian households.
Class 1 Class 2 Class 3 Class 4 Class 5 Class 6
N = 6960 = 100% 18.6% 8.8% 17.8% 22.1% 17.5% 15.2%
Living environment
traditional urban design 3.3 9.9 6.6 12.4 21.5 15.7
housing estate 1.2 9.0 0.6 6.4 23.1 76.0
condominium and villa district 0.4 1.9 0.9 5.4 7.6 3.8
residential area with detached houses 32.0 38.8 55.4 57.0 33.2 3.0
residential area of rural character 45.6 34.2 34.8 16.0 13.0 1.1
suburbs and other 17.5 6.2 1.7 2.8 1.6 0.3
Property type
detached house 90.2 79.5 93.9 74.4 40.9 3.7
semi-detached or terraced house 5.7 3.0 4.0 9.5 7.2 1.0
condominium with less than 10 apartments 1.2 3.2 1.3 4.3 10.9 3.7
condominium with 10 or more apartments 1.6 12.5 0.7 11.5 39.8 90.5
other 1.3 1.9 0.0 0.3 1.1 1.0
Property age
Before 1945 28.7 15.7 11.6 14.7 20.7 3.0
1945–1969 36.2 32.9 30.0 32.2 34.6 17.1
1970–1989 29.5 47.4 53.1 45.0 37.8 76.6
After 1999 5.6 4.0 5.2 8.2 6.8 3.3
Floor-area
Below 36 m2 1.5 2.0 0.2 0.7 6.0 8.9
36–55 m2 12.7 12.5 2.7 8.7 30.4 50.2
56–75 m2 29.5 18.5 13.7 21.0 30.6 35.5
76–100 m2 41.7 46.1 52.0 44.3 25.5 4.5
Over 100 m2 14.7 20.9 31.4 25.3 7.5 0.9
Table A2.Cont.
Class 1 Class 2 Class 3 Class 4 Class 5 Class 6
N = 6960 = 100% 18.6% 8.8% 17.8% 22.1% 17.5% 15.2%
Number of rooms
Up to 1 room 7.4 4.0 1.2 1.6 12.5 7.6
2 rooms 41.0 29.8 21.6 27.7 45.5 52.7
3–4 rooms 46.5 56.2 65.8 61.2 38.9 38.5
5 or more rooms 5.1 10.0 11.4 9.6 3.1 1.1
Settlement type
Capital 0.9 2.6 1.6 17.1 26.4 22.7
County capital 5.3 10.0 11.8 23.1 26.9 57.6
Other town 27.2 36.1 37.0 32.5 31.0 18.0
Village 66.6 51.3 49.7 27.3 15.7 1.7
Grounds for using the property
owner. beneficiary 91.7 94.0 97.8 95.9 88.3 83.4
flat rented on market price 3.3 2.4 1.4 2.5 4.7 7.5
flat rented not on market price 3.6 2.1 0.3 1.2 5.1 7.2
free user. other 1.4 1.4 0.5 0.3 2.0 1.9
Household type
Young couple without a child or a young single
person 3.8 1.4 1.3 1.6 2.9 4.6
Couple with children (30–54 y.o.) 26.1 22.3 23.5 21.4 17.1 25.7
Couple without children (30–54 y.o.) 21.6 12.3 13.4 15.2 12.7 13.0
Elderly couple without children (55–64 y.o.) 21.3 24.6 24.1 19.2 18.5 18.6
Elderly retired couple or single pensioner 27.2 39.3 37.8 42.5 48.9 38.2
Income status
1st quintile 33.2 13.6 10.5 6.3 14.5 9.3
2nd quintile 24.9 18.2 22.4 14.2 17.3 13.5
3rd quintile 21.7 22.9 26.1 23.0 21.6 22.6
4th quintile 12.8 24.2 23.2 27.6 22.9 25.7
5th quintile 7.5 21.1 17.8 28.9 23.6 28.9
Educational attainment of HRP
Elementary 46.3 24.9 22.3 15.9 21.4 11.0
Secondary without high-school diploma 34.8 34.5 35.3 25.4 21.9 23.4
Secondary with high-school diploma 15.5 28.7 29.4 31.8 35.7 39.5
Higher 3.4 11.9 13.0 26.8 20.9 26.1
Note: Values overrepresented compared to the national average are highlighted. Source: Secondary processing of the National Household Budget Survey 2018.
Table A3.Explanatory power of models (R2) through different model specifications.
Explanatory Power of Models Constructed to Explain Energy Consumer Types (R2)
Class 1 Class 2 Class 3 Class 4 Class 5 Class 6
Building model 0.347 0.117 0.286 0.397 0.231 0.671
Socio-dempgraphic model 0.312 0.063 0.114 0.141 0.207 0.255
Final model 0.415 0.184 0.301 0.440 0.312 0.692
Source: Secondary processing of the National Household Budget Survey 2018.
References
1. Owusu, P.A.; Asumadu-Sarkodie, S. A review of renewable energy sources, sustainability issues and climate change mitigation.
Cogent Eng.2016,3, 1167990. [CrossRef]
2. United Nations. The 17 Goals. Available online:https://sdgs.un.org/goals(accessed on 12 July 2021).
3. IEA.Energy Access Outlook 2017; IEA: Paris, France, 2017. Available online:https://www.iea.org/reports/energy-access-outlook- 2017(accessed on 12 July 2021).