DOI: 10.38146/BSZ.SPEC.2020.3.5
Ferenc Molnár
Security of Energy Supply with Knowledge of Expected Production and Consumption Trends
Abstract
The history of mankind is accompanied by the presence of energy, its ever-ex- panding uses and forms, and the ever-increasing need for energy. For the man of the present-day energy is present in so many forms of appearance and use that it could not be listed without being exhaustive. The use of energy is deci- sive in every segment of modern human life. Without exaggeration, it can be stated that the conditions of the urbanized man living today would basically change without energy. Without electricity, nothing would work, such as con- trol systems implemented by computing devices as well as the main and aux- iliary equipment of basic power systems. It is easy to see that the absence of electricity water and gas supply would be a cut off. Ventilation systems would not work. Traffic would stop and it would be total dark at night. There would be no heating and cooling systems for the apartments. Industrial and agricul- tural production would stop. There would be no drinking water or food. Com- munication and security systems would not work. National law enforcement would not be able to fulfil its function. Lack of energy would lead to economic and social disaster. Today’s global population of nearly 8 billion people is de- pleting the Earth’s energy supply and destroying its natural environment at the cost of ruthless energy use. If the current energy use trend of civilization will not be moderated and modified, the conditions of humanity as a whole will be jeopardized, in the immediate future. In this case, we will eliminate the living conditions of future generations. It is a popular saying that the Earth is not ours, we have just borrowed it from our grandchildren. It is our responsibility to pass on a liveable world to posterity.
Keywords: energy, sustainable development, energy supply, emission, electricity
Global trends
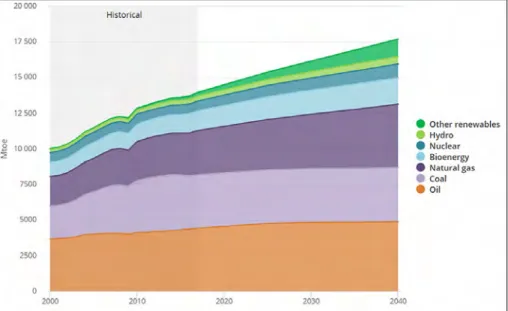
Of the world’s population the EU27 and the United Kingdom have more than 512 million inhabitants. As the population grows, the use of primary energy also increases, but energy consumption will increase at a much greater rate. In retrospect, according to a survey in 2000, 16% of the population was already using 80% of the total amount of energy consumed. According to a research of the University of California, the largest emitters of carbon dioxide are transport, with 49% and the energy sector with 30%. (Hejazi, 2017). According to the In- ternational Energy Agency, the world’s population consumed nearly 7,300 mil- lion tonnes of oil equivalent (Mtoe) in 1980. This value increased by more than two-thirds in 2008 to 12300 Mtoe. (WEO 2010) Yet between 1980 and 2008, there was a strong upward trend in primary energy consumption.
Figure 1: The increase in world primary energy demand by energy carriers (WEO, 2018).
From these quantities it can be deduced that the Earth’s energy reserves are be- ing exploited at a disastrous rate. More than 70% of the energy consumed comes from fossil fuels. The ratio between nuclear and renewable production is min- imized by fossil-based applications (Figure 1). The European Union expects that by 2050 the economies of all member states will achieve economic growth with zero emissions. According to the calculations of the Hungarian policy, the
implementation of this would cost Hungary HUF 50,000 billion. Hungary’s goal is that 90% of the electricity will be generated from carbon-free sources by 2030. By 2040, the energy demand of the Earth’s inhabitants will increase by 25% of the value of 2017. Without energy efficiency measures this would double the amount of energy consumed in 2017. India’s energy consumption could grow nearly double, while China’s consumption could increase by near- ly one-fifth over the same period.
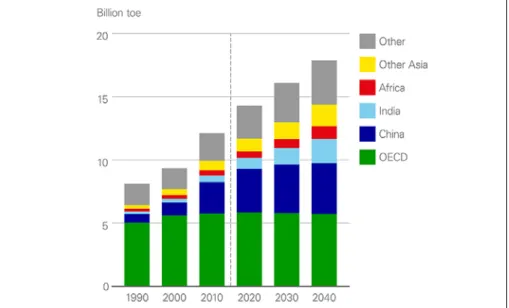
Figure 2: World energy consumption by region (URL1).
The current and expected trend in energy consumption in the developing world shows a steady and strong increase in energy demand, while in OECD coun- tries there will be a slight decline after stagnation. Beside India and China, also other countries in Asia are increasing their energy markets in proportion to the rise in their standard of living. Increasing well-being also leads to an increase in energy consumption per capita. Within ten years India will see the largest increase in energy demand. Slowing China’s energy demand growth rate is an indicator of sustainable economic development. However, by 2040 China’s energy demand will still double India’s energy demand (Figure 2). Africa may come as a surprise, as the continent which is expected to account for 25% of the world’s population by 2040, will account for only 6% of global energy con- sumption (URL1). In the context of sustainable development, the increasing share of electricity in final energy use will play an enhancing important role in
automating, maintaining air purity, reducing pollution, and improving climate parameters. Electricity consumption is projected to reach 45% of total energy demand by 2040, nearly 40.000 TWh per year.
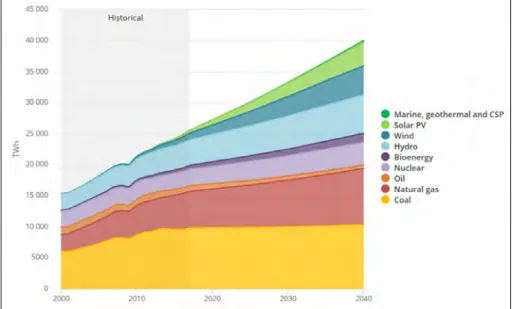
Figure 3: Global demand for electricity by technology breakdown (WEO, 2018)
Global electricity generation is expected to grow by almost two-thirds between 2017 and 2040. Fossil-based technologies will continue to provide a significant share of electricity generation, despite the fact that by 2040 their current share of almost 70% will be below 50%. The dominance of coal use will be replaced by renewable-based generation in the power generation structure. The 20% share of natural gas consumption is not expected to change. Hydropower will remain the largest carbon-free source by 2040, with a 15% share of the electricity mix.
More than 70% of the increase in electricity production will come from renew- able energies. Solar and wind energy will bring the biggest increase in produc- tion. The share of nuclear power is expected to be stabilized at 10% (Figure 3).
Two-thirds (220GW) of the currently operating nuclear power plants are over 30 years old. China will be the world’s largest nuclear energy producing region.
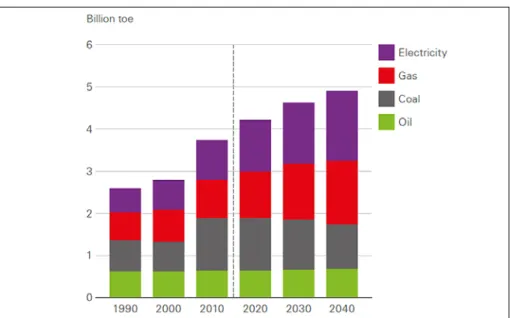
Within the growth trend of final primary energy consumption, industrial con- sumption accounts for almost half of total consumption. Residential and com- mercial buildings account for 29% of total consumption. The 21% share of transport is also significant (Figure 4).
Industrial consumers can easily see the increase in electricity demand due to automation and the rise of digital technologies (Figure5). In the next chapter, I would like to briefly introduce electricity technologies.
Figure 4: End use of primary energy by sector (URL1).
Figure 5: Use of industrial sector energy by type of energy (URL1).
The Hungarian electricity strategy
In December 2018, the Government adopted the concept of a new energy strat- egy integrating the National Energy and Climate Plan (NECT, 2018), which is coherent with the adopted Paris Agreement. As we see internationally, the do- mestic energy sector is undergoing a rapid and vigorous change. In this transi- tion process, the ministry intends to build a climate-friendly energy sector in Hungary, with consumer considerations in mind. Energy use is responsible for more than 70% of greenhouse gas emissions, both internationally and domes- tically. One way to reduce the need for oil and gas imports is to use nuclear and renewable energies along with energy saving measures. The government has envisaged the 3D principle for the development of the electricity sector. The components of 3D are decarbonization, decentralization, and digitization. In addition, they mean decarbonising the electricity sector, expanding domestic and industrial renewable production, and spreading digital technologies.
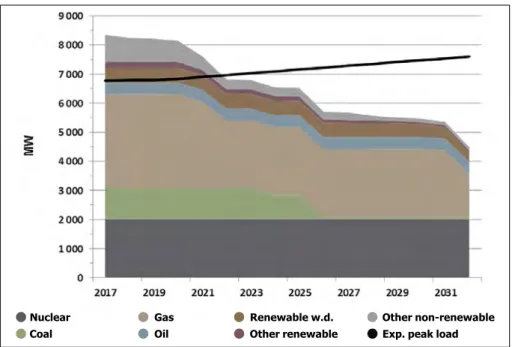
Figure 6: Domestic electricity production and consumption demand by 2031 (URL2).
The above figure illustrates the need to build a significant new power plant port- folio to replace aging power plants and to ensure ever-increasing electricity de- mand and reduce import dependency (Figure 6). The production of two units
Nuclear Gas Renewable w.d. Other non-renewable
Coal Oil Other renewable Exp. peak load
of the Paks2 power plant serving the maintenance of the domestic nuclear ca- pacity in Hungary can be supplemented by the production of renewable-based electricity without carbon emissions. In 2018, more than 50% of domestic elec- tricity production came from nuclear sources (Figure 7).
Figure 7: Distribution of Electricity Generated in 2018 (URL3).
The targets set by the European Union’s Technical Committees determine an EU-wide target of 40% emission reduction by 2030 and 80% by 2050 com- pared to 1990 emissions. The Second National Climate Change Strategy, born in 2018, will include domestic reductions of at least 52% and at most 85% by 2030 compared to 1990 emissions. A 40% reduction in EU requirements means that Hungary will emit up to 56.28 million tonnes of carbon dioxide per year in 2030. Domestic emissions in 2017 were 64.44 million tonnes of carbon di- oxide (NECT, 2018).
Decarbonisation also involves the exploitation of renewable energy sources.
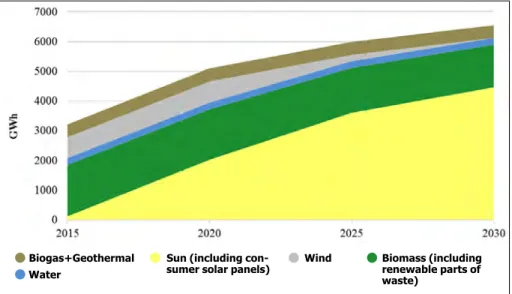
Hungary has committed to a 20% utilization rate by 2030. In the field of elec- tricity generation, 2018 will see 700MW of solar generation capacity expand to around 6000MW of installed solar power capacity by 2030. The share of residential production may increase from the current almost 400MW to over 1500MW (Figure 8).
Figure 8: Prediction of renewable electricity generation considering the impact of existing policy measures (NECT, 2018).
Figure 9: Predicting GHG emissions from the Energy industry considering the impact of existing policy measures (NECT, 2018).
The main goal of the policy is to reduce carbon emissions in energy generation (Figure 9). The ministry intends to involve consumers in carbon-free production from renewable sources, encouraging them to produce their own consumption
Biogas+Geothermal Sun (including con-
sumer solar panels) Wind Biomass (including renewable parts of waste)
Water
needs, preferably with their own storage capacity and smart devices, thus con- tributing to system security. The merger of ‘producer’ and ‘consumer’ activities will thus lead to a new entrant beside prosumer: the active user.
The main elements of the new energy strategy concept are as follows:
• Placing the consumer in the centre of the energy strategy
• Sustainability of overhead reductions
• Strengthening the security of supply and the use of domestic resources
• A need for the climate friendly transformation of the energy sector
• Stimulating energy innovation for carbon neutrality with smart technolo- gies, energy storage, etc.
• The Government will give priority to domestic solar energy utilization. It supports the supply of renewable energy from small-scale households, small and medium-sized enterprises, and the development of cost-effective renew- able power plants on an industrial scale.
With the rise of weather-dependent renewable-based producers, system con- trol tasks will become increasingly important. System regulation and network development are essential for integrating renewable producers into the system.
Expansion of the built-in flexibility reserve capacity and new technologies are needed to carry out the regulatory activity. These tasks are becoming increas- ingly urgent globally and domestically as a result of the transformation of power generation technologies. The development of new technologies and the promo- tion of related innovations must be a priority for all governments.
Summary
Almost 50% of the world’s energy is consumed by barely 7% of the population.
By 2040, Earth’s energy consumption will be increased by more than a quarter of its present value. With the highest consumption and emission growth, India and Asia will share, doubling current energy use by 2040. Hungary also has significant development potential in energy management. Energy consumption per capita GDP is more than twice the average for Western European countries.
Following the European Union’s energy and climate protection policy, Hungary is committed to implement the continent’s objectives. Our country has volun- tarily made stricter commitments than the tasks assigned to us by the EU. These include the rate of expansion of renewable energies and the reduction of green-
house gas emissions. The use of clean energies, extending energy efficiency and energy saving to all segments of the economy and society, and consistently ad- hering to them, are key to the sustainability of the Earth. Unused energy is the best way to protect our environment and our future. Sustainability means re- taining the ability for future generations to provide their own living conditions.
References
Hejazi, R. (2017): Nuclear energy, Sense or nonsense for environmental challenges. Science- Direct International Journal of Sustainable Built Environment, 6(2), 693-700. https://doi.
org/10.1016/j.ijsbe.2017.07.006
Hungarian National Energy and Climate Plan, 2018 (NECT, 2018) World Energy Outlook 2010, International Energy Agency. (WEO, 2010) World Energy Outlook 2018, International Energy Agency. (WEO, 2018)
Online links in this article
URL1: British Petrol Energy Outlook 2019. https://www.bp.com/en/global/corporate/energy-eco- nomics/energy-outlook/demand-by-region.html
URL2: Áttekintő ábra a Magyar villamosenergia-rendszer legfontosabb adatairól. [Overview diagram on the most important data of the electricitry system] http://www.mavir.hu/web/ma- vir/home
URL3: A teljes bruttó villamosenergia-felhasználás megoszlása 2018. [Componenets of the Total Gross Electricity Consumption 2018]. https://mavir.hu/documents/10258/229275463/
El%C5%91zetes+Termel%C3%A9smegoszl%C3%A1s++2018+MavirHonlapra+HU+20190131.
pdf/c7c5165f-9332-ddc1-93d9-f0bef4b08a3d