Quantifying Cyanothece growth under DIC limitation
Keisuke Inomura
a,⇑, Takako Masuda
b, Meri Eichner
b, Sophie Rabouille
c, Tomáš Zavrˇel
d,
Jan Cˇerveny´
d, Marie Vancová
e, Gábor Bernát
b,f, Gabrielle Armin
a, Pascal Claquin
g, Eva Kotabová
b, Susanne Stephan
h, David J. Suggett
i, Curtis Deutsch
j, Ondrˇej Prášil
baGraduate School of Oceanography, University of Rhode Island, Narragansett, Rhode Island, USA
bInstitute of Microbiology, The Czech Academy of Sciences, Trˇebonˇ, Czech Republic
cSorbonne Universite´, CNRS, Laboratoire d’Oce´anographie Microbienne, LOMIC, F-66650 Banyuls-sur-mer, France
dDepartment of Adaptive Biotechnologies, Global Change Research Institute, Czech Academy of Sciences, Brno, Czech Republic
eLaboratory of Electron Microscopy, Institute of Parasitology, Biology Centre of the Czech Academy of Sciences and Faculty of Science, University of South Bohemia, Cˇeské Budeˇjovice, Czech Republic
fBalaton Limnological Research Institute, Eötvös Loránd Research Network (ELKH), Tihany, Hungary
gLaboratoire de Biologie des ORganismes et Ecosystèmes Aquatiques (BOREA), UMR 8067, Muséum National d’Histoire Naturelle, CNRS, IRD Sorbonne Université, Université de Caen Normandie, Normandie Université, Esplanade de la Paix, F-14032 Caen, France
hDepartment Experimental Limnology, Leibniz Institute of Freshwater Ecology and Inland Fisheries, Stechlin, Germany
iUniversity of Technology Sydney, Climate Change Cluster, Faculty of Science, Ultimo, NSW 2007, Australia
jSchool of Oceanography, University of Washington, Seattle, WA, USA
a r t i c l e i n f o
Article history:
Received 28 June 2021
Received in revised form 22 November 2021 Accepted 22 November 2021
Available online 29 November 2021
Keywords:
Cyanothece DIC CO2
Nitrogen fixation Nitrate Diurnal cycle Carbon Carbon storage Photosynthesis Carbon allocation Quantitative model Mathematical model Computer simulation Cellular growth Biomass Growth limitation Culture Turbidostat
a b s t r a c t
The photoautotrophic, unicellular N2-fixer,Cyanothece,is a model organism that has been widely used to study photosynthesis regulation, the structure of photosystems, and the temporal segregation of carbon (C) and nitrogen (N) fixation in light and dark phases of the diel cycle. Here, we present a simple quan- titative model and experimental data that together, suggest external dissolved inorganic carbon (DIC) concentration as a major limiting factor forCyanothecegrowth, due to its high C-storage requirement.
Using experimental data from a parallel laboratory study as a basis, we show that after the onset of the light period, DIC was rapidly consumed by photosynthesis, leading to a sharp drop in the rate of pho- tosynthesis and C accumulation. In N2-fixing cultures, high rates of photosynthesis in the morning enabled rapid conversion of DIC to intracellular C storage, hastening DIC consumption to levels that lim- ited further uptake. The N2-fixing condition allows only a small fraction of fixed C for cellular growth since a large fraction was reserved in storage to fuel night-time N2fixation. Our model provides a frame- work for resolving DIC limitation in aquatic ecosystem simulations, where DIC as a growth-limiting factor has rarely been considered, and importantly emphasizes the effect of intracellular C allocation on growth rate that varies depending on the growth environment.
Ó2021 The Author(s). Published by Elsevier B.V. on behalf of Research Network of Computational and Structural Biotechnology. This is an open access article under the CC BY license (http://creativecommons.
org/licenses/by/4.0/).
1. Introduction
By reducing atmospheric CO2into bioavailable carbon (C), pho- tosynthesis is the driving process of global ecosystem productivity
and biogeochemical (nutrient) cycles. Phytoplanktonic organisms are responsible for most aquatic photosynthesis, and account for about half the primary production on earth[1]. A growing body of literature now reveals prokaryotic, nitrogen-fixing organisms as key players in the dynamics of phytoplanktonic communities and the world ocean’s primary production. In particular, by their phototrophic capacity and their ability to fix molecular nitrogen (N2), unicellular N2-fixing cyanobacteria (UCYN) directly or indi-
https://doi.org/10.1016/j.csbj.2021.11.036
2001-0370/Ó2021 The Author(s). Published by Elsevier B.V. on behalf of Research Network of Computational and Structural Biotechnology.
This is an open access article under the CC BY license (http://creativecommons.org/licenses/by/4.0/).
⇑Corresponding author at: Graduate School of Oceanography, University of Rhode Island, 215 S Ferry Road, Narragansett, Rhode Island 02882, USA.
E-mail address:inomura@uri.edu(K. Inomura).
j o u r n a l h o m e p a g e : w w w . e l s e v i e r . c o m / l o c a t e / c s b j
rectly contribute to and support primary production[2–4], exert- ing a direct coupling of the biogeochemical cycles of N and C[5,6].
One of the most intensively studied organismal models of uni- cellular cyanobacteria is Cyanothece sp. ATCC 51142 (hereafter Cyanothece), which also has a capability to fix dinitrogen (N2)[7]
to survive when bioavailable N, such as NH4+or NO3, is inaccessible.
As in other photo-autotrophic, unicellular N2-fixing cyanobacteria (UCYN-B and -C), N2 fixation in Cyanotheceis temporally segre- gated from carbon fixation[8–10], an evolution enabling protec- tion of the O2-sensitive, nitrogenase enzyme responsible for N2 fixation [11]. Recent studies show that N2fixation by UCYN-B is facilitated by the inactivation of PSII[12,13], which may apply to Cyanothece. There are cases with in-complete temporal segregation depending on the light periodicity and cellular energy require- ments, but the largest part of N2fixation tends to occur at night [9,14]. The temporal separation of photosynthesis and N2fixation imposes these strains to rely on fixed carbon stored within cells as polysaccharides and on their subsequent respiration, which sup- port the energy costs of N2fixation.Cyanotheceis not an obligate N2-fixer and grows well in the presence of bioavailable N, making it a relevant biological model of photo-autotrophic UCYN to inves- tigate the cellular requirements imposed by N2fixation on the cel- lular carbon metabolism, in comparison to nitrate-supported growth. The cellular growth ofCyanotheceand its resulting popula- tion dynamics thus closely depend on the metabolic pathways of photosynthesis, respiration, NO3 acquisition, and/or N2 fixation.
Similar to other phytoplankton, the growth of autotrophic cyanobacteria is limited by the availability of macronutrients (ni- trogen and phosphorus), trace metals (iron, copper)[15,16], light, and temperature[17]. However, the effect of CO2on their growth has only been started to be investigated intensively[10].
The effects of increasing CO2on primary production are widely debated in the literature and motivated by the growing concern of ocean acidification[18–22]. Low DIC concentrations are likely to transiently occur [23]in areas with dense phytoplanktonic com- munities like the coastal regions, whereCyanotheceare naturally present. Additionally, such low concentrations pose a potential, permanent risk in dense laboratory or industrial cultures and
photo-bioreactors running without CO2enrichment in the air sup- ply. In the natural environment, we expect CO2 limitation to be altered following the increasing temperatures the world ocean is facing globally, but how dissolved inorganic carbon (DIC: the sum of CO2, HCO3 and CO32) affects the growth of Cyanothece has not been analyzed in detail. Given the tight links between C and N metabolisms, what causes the growth difference between N2-fixing and NO3 assimilating conditions under DIC limitation [10]?
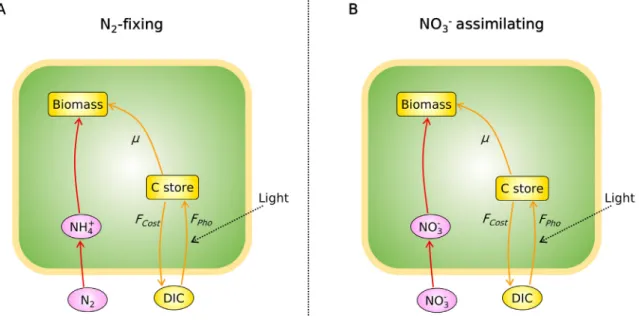
Here, we implement a simple, yet mechanistic model ofCyan- othece(Cell Flux Model ofCyanothece: CFM-Cyano) and quantita- tively simulate the growth of this model organism, focusing on the control that DIC exerts on carbon fixation and on the subse- quent C metabolism (Fig. 1: see Methods). This coarse-grained approach has an advantage in predicting concentrations of each metabolite pool [24,25]. The flexibility and simplicity of CFM- Cyano allows the model to be adapted to different contexts (e.g., different datasets) and has provided intuitive overviews of cellular metabolism in unicellular N2-fixers[25–28]. The present modeling work builds upon an experimental study of DIC limitation in the UCYNCyanotheceATCC 51142 grown in turbidostats, both under a non-limiting nitrate supply and under obligate N2-fixation[10].
This experimental approach addressed the additional energetic burden that cells face when growing with N2 fixation compared to a NO3-based growth. They also revealed how DIC limitation exerts a more severe control on N2-based growth compared with NO3-supplied cultures. In this study, we provide a simple, mecha- nistic and quantitative representation of DIC limitation. Model results illustrate that resultant growth rates differ significantly between these metabolic modes, in relation to the intracellular allocation of fixed C.
2. Methods 2.1. Key equations
The applied mechanistic model, CFM-Cyano, is based on a sim- plified metabolic flux network based on mass balances (Fig. 1) sim-
Fig. 1.Schematics of the cell flux model ofCyanothece(CFM-Cyano) in (A) N2-fixing cells and in (B) NO3assimilating cells. The green boxes represent the cell. Ovals and rectangular boxes represent inorganic and organic molecules, respectively. Orange color represents C-dominant molecules and fluxes; while pink and red color represent N- dominant molecules and fluxes, respectively.FPho, C fixation rate;FCost, biosynthesis cost, which covers the electron and energy costs for biosynthesis, N2fixation and NO3
assimilation, thus differs between these two cases. See the definition in the main text below [eq.(7)].
ilar to previous CFMs[24,29,30]and earlier modeling on marine N2
fixers[31–33]. Most of these studies are reviewed in a recent pub- lication[6]. CFM-Cyano simulated two metabolic scenarios: 1. N2- fixing (diazotrophic) and 2. NO3assimilating. Under the N2-fixing condition, N2 fixation accounted for the total N source, whereas under NO3 assimilating condition, NO3 was the total N source.
Parameter units and values are listed in Supplementary Material (Table S1, S2). In the CFM-Cyano model, we considered C as the main
‘‘currency” of cellular growth, and computed the rates of photosyn- thesis, C storage production, and growth (biosynthesis) for each time step. The developed model was calibrated to reproduce the experi- mental data (Fig. 2, Fig. 3andFig. 6).
Cellular C is fixed by photosynthesis, whose rate depends on external DIC concentration, following Monod kinetics[34]:
FPho¼FmaxPho ½DIC
½DIC þKDIC
ð1Þ
whereFPhois the rate of photosynthesis,FmaxPhois the maximum rate of photosynthesis,½DICis DIC concentration in the culture, andKDICis the half saturation constant of DIC uptake.FPhowas assumed zero during the night. While the intracellular CO2concentration is the one that directly affects the rate of photosynthesis, the data for intracellular CO2are not available and here we consider external DIC as a proxy for intracellular CO2. This implicitly assumes a linear relationship between internal and external pools of DIC. More com- plex relationships could arise from the presence of a carbon concen- trating mechanism, and could be easily be incorporated in the model if substantiated by more direct evidence.
Once we determined the rate of photosynthesis, we then com- puted the net rate of C storage production,FCsto, based on the dif- ference between maximum C storage capacity, CmaxSto , and the current level of C storage,CSto, into starch-like molecules[35]:
FCsto¼min FmaxCsto CmaxSto CSto
CmaxSto
;FPho
ð2Þ
where the rate is proportional toFmaxCsto, a maximum rate of C storage production. We adapted this formation from the Cell Flux Model of Crocosphaera(CFM-Croco)[30]. Since the storage production should not exceed the rate of photosynthesis,FCsto was capped byFPho . Based on the mass balance, the rest of fixed C is used for growth.
Thus, under N2fixing case:
l
¼FPhoFCsto1þE ð3Þ
where
l
is the net growth rate, andEis a constant factor for respi- ration for providing energy for biosynthesis[25,26,29]. In reality, it is possible that stored C is used for the growth. Thus, the termFCstoinstead represented the net C storage production: the difference between gross C storage production and the loss for the growth.
Under NO3assimilating case:
l
¼FPhoFCstoð1þEÞ1þECStoE ð4Þ
This formula counts the cost for NO3assimilation, to keep the cellular C:N constant as suggested by experimental data (see the section ‘‘3.4. Cellular C:N and N assimilation”). The derivations for [eq.(3)] and [eq.(4)] are inSupplementary text.
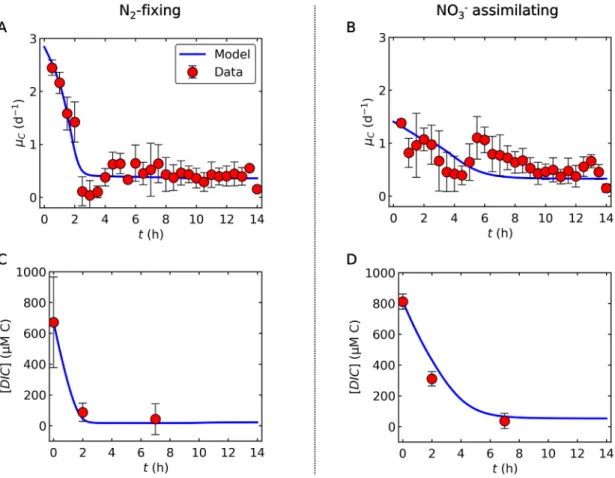
Fig. 2. Relations between C-based growth rate and DIC (dissolved inorganic carbon) concentrations during the light period. (A) and (B) C-based growth rate(lC) for N2-fixing and NO3assimilating cells, respectively. (C) and (D) DIC concentrations for N2-fixing and NO3assimilating cells, respectively. Blue curves are the results of model calculations, while red circles represent experimental data, deduced from growth rates determined by changes in OD720. Error bars represent standard deviation. The constancy of the DIC after h7 during the light period is supported by the observed constant pH[10].
In this study, we simulated two types ofCyanothececells: N2- fixing and non-N2-fixing (Fig. 1). We provided differentEvalues for the different N sources. Specifically, we followed the previously developed method, which computedEbased on the mass, electron and energy balance[36]. Under NO3added case, NO3concentra- tions were abundant in the cultures (NO3 culture; 16.16–
22.67 mM), allowing us to focus on the C limitation. When NO3 is not added, we assumed that there is sufficient N storage accu- mulated during the night to support biosynthesis. Since the data showed a decrease in biomass during the night, we allowed net cell growth only during the light periods (
l
= 0 at night), although we were aware that cell division may occur also in the dark. We con- sidered any excretion of carbohydrates as a part of carbon storage.2.2. Time variations and model solutions
We then applied these four equations [eq.(1)]-[eq.(4)] to equa- tions for the time variation in the experimental system of tur- bidostat cultures [10]. Here, the time variation of the non-C- stroage biomass concentrationXincrease based on the net growth rate[24]:
dX
dt ¼
l
X ð5Þhere, the loss term was not included since we compared the model results to the cumulative optical density. We use the following equation for the time dependence of cellular C storage per non-C- storage biomassCSto:
dCSto
dt ¼FCsto
l
CStoFN2fixCsto ð6Þwhere CSto increases with C storage production, FCsto , but decreases with cell growth (
l
CSto), asCStois converted to new cells during the light period. Also, during the dark period under N2- fixing conditions, CSto decreases with N2 fixation FN2fixCsto , which requires high consumption of C storage for intracellular O2man- agement and ATP generation[26,29,30,33]. Under the NO3based condition, FN2fixCsto is zero. Finally, the time dependence of culture DIC is represented as follows:d DIC½
dt ¼FGasDICkCellDICFPhoFCostFN2fixCsto
ð7Þ
which is determined by the rate of gas exchangeFGasDIC and the cellular DIC uptake (the second term). Here,FGasDIC, is proportional to the DIC disequilibrium with a rate coefficient kGasDIC : FGasDIC¼½DICEq½DIC
kGasDIC .½DICEq is the equilibrium concentra- tion of DIC in the environment,kGasDICis the gas exchange constant, andkCellDICis a constant factor for cellular DIC consumption, as a bal- ance between photosynthesis,FPho, respiratory C cost,FCost(¼
l
Efor N2-based case, and¼EðFCsto
l
CStoþl
Þfor NO3-based case:seeSupplementary text), and C consumption for N2fixation during the dark period,FN2fixCsto .
We solved [eq. (5)]-[eq. (7)] with a finite difference method withFPho,FCstoand
l
computed for each time step from [eq.(1)]- [eq.(4)] with light:dark periods of 14 h:10 h, following the tur- bidostat experiment described in the companion paper [10]. We note that whereas a more detailed representation of C chemistry could be resolved [37], we chose to represent DIC as a pool for compatibility with the available data. Also, this way enabled us to keep our model simple with regard to extracellular carbonate chemistry and focus on a more detailed representation of intracel- lular carbon allocation over time. We assumed that influences of DIC speciation are relatively small compared to the large overall changes in DIC concentrations observed over the diel cycle.Once we obtained the solutions for the time series, we com- puted cellular C content:
CCell
½ ¼Xð1þCStoÞ ð8Þ
the relative value of which was compared with the values for optical density (OD720). We also computed the C-based growth rate
l
C:l
C¼l
þFCsto1þCSto ð9Þ
l
Cis formulated based on the net carbon assimilation rate nor- malized by the cellular C.l
Cwas compared with the growth rate obtained from photobioreactor data, based on the change in the cumulative OD720[10](Fig. 3).2.3. Obtaining N related values for N2fixing case during the light period
During the light period under the N2-fixing condition, the rate of N2fixation is small and the predicted integrated rate of biosyn- thesis is relatively small compared to that of C storage accumula- tion (Fig. 5). Thus, we approximate the cellular C:N, assuming a constantNCell, the cellular N content per non-C-storage biomass C:
C:N¼1þCSto
NCell ð10Þ
2.4. Obtaining N related values for NO3added case during the light period
During the light period, the data showed largely constant cellu- lar C:N (see below). Thus, we assumed constant cellular C:N. This allowed the computation ofNCellwith the following equations:
NCell¼1þCSto
C:N ð11Þ
Also usingC:N, assuming all the N source is NO3, we could compute the NO3uptake rateVNO3:
VNO3¼
l
CC:N ð12Þ
2.5. Laboratory measurements
We tested model solutions and constrained its unknown using time-dependent observations of the variation of intracellular C and N content, obtained during GAP 10th International meeting [10,38]. Transmission electron microscopic (TEM) samples were processed as described in[38].
3. Results and discussion 3.1. C assimilation rate and DIC
The overall trend captures the data for both
l
C(C assimilation rate) and DIC concentrations (Fig. 2). Under the N2-fixing condi- tion, the model predicted a sharp decrease inl
C within 2 h (Fig. 2A), as DIC became depleted (Fig. 2C). In between these phases, experimental data showed a minimum, virtually zero growth after about 3 h in the light (h3), which was not captured by the model (Fig. 2A, B). This drop inl
Cmay indicate a lag phase [39–41]during which cells acclimate to a changed environment with low DIC by upregulating the activity of their CO2concentra- tion mechanisms, such as expression and synthesis of CO2uptake systems and HCO3 transporters[42–48]. This observation high- lights that DIC may become a limiting factor for growth even whenCO2 is supplied by air bubbling. In natural systems, severe DIC draw-down, comparable to our experimental set-up, may develop in freshwater systems with dense cyanobacterial blooms with pre- dicted steady-state DIC concentrations of 130 to 230mmol L1[37], in coastal regions[23], or within highly productive microenviron- ments such as cyanobacterial colonies in brackish water[49].
Under growth with NO3, the initial growth rate was much lower than with N2-fixation. However, it remained relatively high after h2 until h6-h7 compared to N2-fixing culture (Fig. 2B). This concurred with a relatively high DIC level during this period (Fig. 2D). Experimental data for NO3assimilating cells also exhib- ited a significant drop in
l
C, not seen in the model curve, likely due to the energy demand of acclimation (e.g., introduction of carbon concentration mechanism) as suggested above. The major differ- ence between the two growth regimes (N2vs. NO3) is the initial rate of photosynthesis, which is highlighted by a higherFmaxPho for the N2-fixing condition. This difference can be explained by the energy and electron cost for NO3assimilation and intracellular C allocation (see3.3. Fate of fixed C).3.2. Carbon storage and cellular C concentration
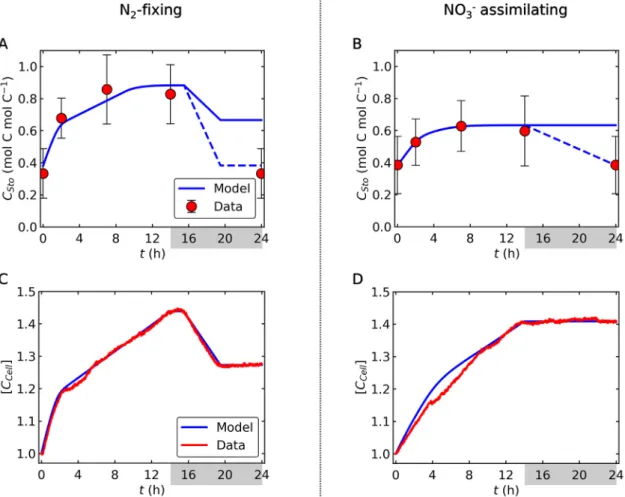
Model simulations ofCStoand [CCell] (Fig. 3) were comparable to cellular polysaccharide levels and OD720, respectively, from cul- tures. The data-model consistency (Fig. 3) suggests that most of the C storage is in the form of polysaccharides, while OD720is a proxy for total cellular C content rather than cell number. During
the dark period under N2-fixing conditions, OD720decreased dras- tically (Fig. 3C), reflecting the drop in polysaccharide content (Fig. 3A). At the beginning of the light period,CStoincreased rapidly but the increase was moderated as the rate of photosynthesis decreased due to DIC limitation (Fig. 2C, 3A). The cellular level of CStowas higher for the N2-fixing condition than for the NO3supple- menting treatment during the light period (Fig. 3A, B). However, the model predicts thatCStoin both treatments reaches the similar level at the end of the dark period due to the high C requirement for N2fixation and O2management.
Interestingly, whilst the model closely predicted the OD720and the total biomass C concentration, at the end of the dark period, CStomust return back to the initial value in the semi-steady state condition. This discrepancy may suggest that some of the C stored as polysaccharides is transformed to other molecules during the dark period. It is possible that a fraction of polysaccharides is used for synthesizing cyanophycin (N storing molecules with C:N of 2:1 [25]) or amino acids[38]or used to build structural elements such as the cell wall. In fact, protein synthesis from polysaccharides was observed during the night[38]. Such conversion must take place with negligible C consumption (i.e., small C storage loss to DIC) because the dark OD720under NO3availability is almost constant (Fig. 3D); high C loss would have appeared as in the N2-fixing sit- uation (Fig. 3C).
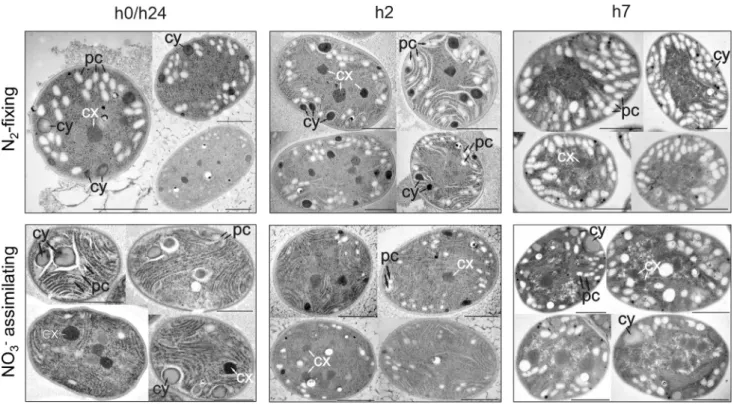
Transmission electron microscopic (TEM) images taken at the beginning of the light period (thus, the end of the dark period) (Fig. 4,S1) showed more polysaccharide granules in N2-fixing cells
Fig. 3.C storage and biomass C in N2-fixing and NO3assimilating cells. Blue curves are model results, while red circles and curves represent experimental data. The data for (A) and (B) are cellular polysaccharide content and those for (C) and (D) are OD720. The data of OD720are shown as a relative value to the initial state. The sudden change in the slope at h14 represent the onset of the dark period. Also, N2fixation is assumed between h14 and h20, which also causes the changes in the slope. In (A) and (B) error bars represent standard deviation and dashed lines shows the expected effect of C storage conversion to close the diurnal cycle.
than in the NO3grown ones, in contrast to bulk measurements of carbohydrate, OD720,and the modelledCSto(Fig. 3). This additional difference suggests that C, represented byCStoand detected by the bulk analysis of carbohydrate content, includes C forms that are not visible as polysaccharide granules by TEM. The other forms of C could possibly be precursors of starches/carbohydrates of lower molecular weight [50]. Following this hypothesis, under NO3-based conditions, more of the C would be present in this lower molecular weight form in the morning, potentially indicating a faster turnover of C under these conditions. Conversely, in the middle of the light phase (h7, Fig. 4, S1), TEM images show an increased number of polysaccharide granules in NO3assimilating cells, while bulk analysis of carbohydrate and modelledCSto are higher in N2 fixing cells, indicating that degradation or turnover of carbon may be higher in N2fixers at this time of day.
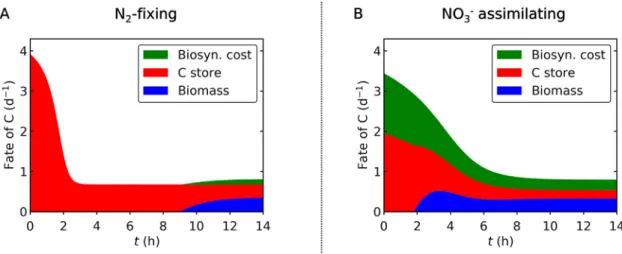
3.3. Fate of fixed C
The fate of fixed C is predicted to differ between the N2-fixing and NO3assimilating conditions (Fig. 5). Under N2-fixing condi- tion, a significant fraction of C is initially channeled into C storage, leaving only a small fraction of newly fixed C for biosynthesis (cel- lular growth) (Fig. 5A). For non-N2-fixing cyanobacteria, it has been previously reported that biosynthesis is prioritized over C storage [38]. In contrast, our model suggests that N2-fixing unicellular cyanobacteria preferentially allocate fixed C to storage to support later N2fixation through respiration at night. Indeed, during the early half of the light period, the model predicted that within the N2-fixing cells virtually all newly fixed C is accumulated in storage, while new C is allocated to biosynthesis only after the C storage reaches a certain threshold level at around h9 (Fig. 3A andFig. 5A).
Contrary to the N2-fixing condition, when NO3 is available, biosynthesis starts soon after the onset of the light period and con- tinues up to the end of the light period (Fig. 5B). This occurs because the maximum level ofCStois small and reaches its maxi- mum much faster during the early light period (Fig. 3B), costing
a significant amount of C. In the experiment, the total C fixation during the light period is similar between the two cases. However, given the high maximum rate of net C fixation under the N2-fixing conditions, if enough CO2were continuously added to the culture to prevent DIC limitation, the rate of C fixation in the N2-fixing case might exceed the NO3assimilating case (Fig. S2). However, this simulation does not consider limitation by the availability of fixed N, which, in reality, would likely become limited under the N2- fixing case and constrain the rate of C fixation, since the N2fixation occurs mainly during the night.
3.4. Cellular C:N ratios and N assimilation
Based on the modeled C metabolisms and C:N data, we have simulated cellular C:N and cellular N per biomass C (without C stor- age) for both the N2fixing case and the NO3added case (Fig. 6). The data and the model revealed quantitative differences in daytime N metabolisms between these two cases. In the N2fixing case, C:N of the cell increases (Fig. 6A) due to the accumulation of C storage (Fig. 3A). The cellular level of N is largely constant since N2fixation does not occur (or is small) during the light period (Fig. 6B).
On the other hand, when NO3is added, the cellular C:N is lar- gely constant (Fig. 6C) since the NO3uptake occurs simultaneously with the accumulation of C storage. Especially, during the early light period, the cellular N is enriched (Fig. 6D) due to NO3uptake (Fig. 6E). The model shows that the NO3uptake is about 200% lar- ger during the early light period than the later light period, consis- tent with NanoSIMS results from the same experiment[38].
Based on the rate of NO3uptake and C fixation, we computed the ratio of electron use for these purposes (Fig. 6F). Despite the considerable rate of NO3uptake and high electron requirement for NO3reduction (8e) relative to net C fixation (4e)[36], the electron consumption for NO3 is relatively small (1/2.57) (Fig. 6F). Thus, the use of electrons for NO3reduction is not suffi- cient to explain the difference in the rate of photosynthesis between the N2fixing case and the NO3case during the light per-
Fig. 4.Transmission electron microscopic images ofCyanothececells harvested at h0/h24, h2 and h7 in the light period. Top row – N2-fixing conditions; Bottom row – NO3
assimilating conditions. pc; polysaccharide (C storage), cy; cyanophycin (N storage), and cx; carboxysome. Black bars show 1mm. Additional images are available inFig. S1.
iod, since the maximum rate of photosynthesis is about 100%
higher for N2fixing case (Fig. 2). The remaining difference can be explained by the energy cost (not electron cost) for NO3assimila- tion to biomass and the preferential allocation of C to C storage under the N2-fixing condition (Fig. 5).
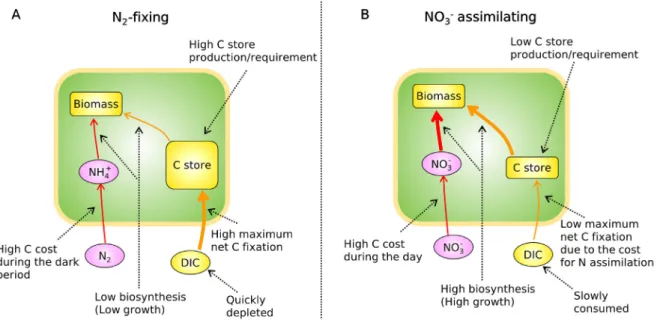
3.5. DIC and C-storage requirements co-limit fate of fixed C
Our model results highlight two major factors controlling cellu- lar growth when the growth ofCyanotheceis limited by inorganic C. Firstly, CO2(DIC) availability limits the rate of photosynthesis, and then, the storage requirement limits the portion of newly fixed C that is used for biosynthesis or growth (Fig. 7). Under N2-fixing conditions, the maximum rate of C fixation (FmaxPho) is higher. How- ever, a large part of C is channeled into C storage, limiting the biosynthesis of new cells, thus limiting the growth rate. Secondly,
despite the high maximum rate of photosynthesis in the N2-fixing condition, the photosynthesis rate rapidly decreases as it quickly depletes DIC. On the other hand, when NO3is available, a large part of fixed C is channeled directly into biosynthesis, thus resulting in higher growth (Fig. 7). The lower maximum rate of photosynthesis works favorably under DIC limitation since it keeps ambient DIC relatively high. However, if limitation by DIC becomes less severe, due to the high photosynthetic capacity, the cells under N2-fixing conditions might grow even faster, yielding a potential co- limitation of DIC and fixed N. This hypothesis needs to be tested with further experiments.
4. Conclusions
We have developed a simple, cellular model of Cyanothece (CFM-Cyano) focusing on DIC limitation. The model reproduced Fig. 5. Fate of newly fixed C during the light period. (A) N2-fixing case. (B) NO3assimilating case. Green: biosynthesis cost. Red: C storage. Blue: C for non-C-storage biomass.
Total value represents C fixation rates. The biosynthesis cost represents the sum of synthesis of non-C-storage biomass and the NO3assimilation.
Fig. 6.Cellular C:N ratio, N assimilation and electron allocation. (A) and (B) are under N2-fixing condition and (C) - (F) are under NO3added case. (A)(C) Cellular C:N. (B)(D) Cellular N per biomass C (which excludes C storage). (E) NO3uptake rate. (F) The ratio of electron used for C fixation to that for NO3reduction.
laboratory data both for N2-fixing and NO3 available conditions demonstrating that, under N2-fixing conditions, C storage is prior- itized during the early photoperiod to accumulate C in storage for N2fixation during the night, and later during the day, biosynthesis increases. This two-step growth limitation may apply to other pho- toautotrophic unicellular N2-fixers, such asCrocosphaera watsonii.
A recent study pinpointed the risk of significant biases brought by a lack of control of the DIC supply in cultures ofCyanothece[10].
Our study further emphasizes the potential for DIC limitation in laboratory studies, which may severely limit the growth rate of any photoautotrophs and may have been overlooked as a critical regulatory factor in previous studies. Our model is simple and effi- cient and can be incorporated into sophisticated ecological or physiological models to resolve intracellular carbon allocation, especially under conditions when DIC availability becomes limit- ing, such as dense cyanobacterial blooms or biotechnological mass cultures.
5. Model availability
CFM-Cyano is freely available from Zenodo athttps://zenodo.
org/record/3740245(DOI: 10.5281/zenodo.3740245).
Author contributions
KI developed and run the model with suggestions from TM, ME, SR and OP. KI, TM and OP administered the project. TM, ME, SR, TZ, JCˇ , MV, GB, PC, EK, SS, DJS, OP contributed to obtaining data. KI wrote the original manuscript, which is revised by KI, TM, ME, SR, TZ, MV, GB, GA, PC, EK, SS, DJS, CD, OP.
Declaration of Competing Interest
The authors declare that they have no known competing finan- cial interests or personal relationships that could have appeared to influence the work reported in this paper.
Acknowledgements
We thank Steven G. Ball for sharing useful insights about C stor- age in Cyanothece, José Bonomi-Barufi for contributing to data
acquisition, Douglas A. Campbell for providing feedback, Martin Lukeš for his help in measurements and interpretation of data. This project was supported by the Simons Foundation (Simons Postdoc- toral Fellowship in Marine Microbial Ecology, Award 544338, KI), the National Science Foundation under EPSCoR Cooperative Agree- ment (Award OIA-1655221, KI, GA), the Czech Research Founda- tion GACˇR (Award 20-17627S, OP, TM and Award 18-24397S, TZ, JCˇ ), MEYS CR (LM2018129 Czech-BioImaging, MV), the Ministry of Education, Youth and Sports of the Czech Republic (OP RDE grant number CZ.02.1.01/0.0/0.0/16–588 026/0008413, TZ, JCˇ ), and the National Research, Development and Innovation Office of Hungary, NKFIH, (Award K 128950 and NKFIH-471-3/2021, GB). We thank the generous support from these foundations.
Appendix A. Supplementary data
Supplementary data to this article can be found online at https://doi.org/10.1016/j.csbj.2021.11.036.
References
[1]Field CB, Behrenfeld MJ, Randerson JT, Falkowski P. Primary production of the biosphere: Integrating terrestrial and oceanic components. Science 1998;281 (5374):237–40.
[2]Zehr JP, Waterbury JB, Turner PJ, Montoya JP, Omoregie E, Steward GF, et al.
Unicellular cyanobacteria fix N2in the subtropical North Pacific Ocean. Nature 2001;412(6847):635–8.
[3]Montoya JP, Holl CM, Zehr JP, Hansen A, Villareal TA, Capone DG. High rates of N2fixation by unicellular diazotrophs in the oligotrophic Pacific Ocean. Nature 2004;430(7003):1027–31.
[4]Moisander PH, Beinart RA, Hewson I, White AE, Johnson KS, Carlson CA, et al.
Unicellular cyanobacterial distributions broaden the oceanic N2 fixation domain. Science 2010;327(5972):1512–4.
[5]Gruber N, Galloway JN. An Earth-system perspective of the global nitrogen cycle. Nature 2008;451(7176):293–6.
[6]Inomura K, Deutsch C, Masuda T, Prášil O, Follows MJ. Quantitative models of nitrogen-fixing organisms. Comput Struct Biotechnol J 2020;18:3905–24.
[7]Reddy KJ, Haskell JB, Sherman DM, Sherman LA. Unicellular, aerobic nitrogen- fixing cyanobacteria of the genus Cyanothece. J Bacteriol 1993;175 (5):1284–92.
[8]Meunier PC, Colón-lópez MS, Sherman LA. Temporal changes in state transitions and photosystem organization in the unicellular, diazotrophic cyanobacterium Cyanothece sp. ATCC 5112. Plant Physiol 1997;115:991–1000.
[9]Rabouille S, Van de Waal DB, Matthijs HCP, Huisman J. Nitrogen fixation and respiratory electron transport in the cyanobacterium Cyanothece under different light/dark cycles. FEMS Microbiol Ecol 2014;87(3):630–8.
Fig. 7.Summary of this study: differences in metabolisms between N2-fixing and NO3assimilating situations. (A) N2-fixing case. (B) NO3assimilating case. Under DIC limitation, N2-fixing cells have a lower growth rate despite the higher net maximum photosynthesis rate due to high C storage requirement.
[10] Rabouille S, Campbell DA, Masuda T, Zavrˇel T, Bernat G, Polerecky L, et al.
Electron and biomass dynamics ofCyanotheceunder interacting nitrogen and carbon limitations. Front Microbiol 2021;12:617802.
[11]Gallon JR. Tansley Review No. 44 Reconciling the incompatible: N2fixation and O2. New Phytol 1992;122(4):571–609.
[12]Rabouille S, Claquin P. Photosystem-II shutdown evolved with nitrogen fixation in the unicellular diazotroph Crocosphaera watsonii. Environ Microbiol 2016;18(2):477–85.
[13]Masuda T, Bernát G, Becˇková M, Kotabová E, Lawrenz E, Lukeš M, et al. Diel regulation of photosynthetic activity in the oceanic unicellular diazotrophic cyanobacteriumCrocosphaera watsoniiWH8501. Environ Microbiol 2018;20 (2):546–60.
[14]Dron A, Rabouille S, Claquin P, Talec A, Raimbault V, Sciandra A. Photoperiod length paces the temporal orchestration of cell cycle and carbon-nitrogen metabolism in Crocosphaera watsonii. Environ Microbiol 2013;15:3292–304.
[15]Moore CM, Mills MM, Arrigo KR, Berman-Frank I, Bopp L, Boyd PW, et al.
Processes and patterns of oceanic nutrient limitation. Nat Geosci 2013;6 (9):701–10.
[16]Huertas M, López-Maury L, Giner-Lamia J, Sánchez-Riego A, Florencio F. Metals in cyanobacteria: Analysis of the copper, nickel, cobalt and arsenic homeostasis mechanisms. Life 2014;4(4):865–86.
[17]Dechatiwongse P, Srisamai S, Maitland G, Hellgardt K. Effects of light and temperature on the photoautotrophic growth and photoinhibition of nitrogen-fixing cyanobacterium Cyanothece sp. ATCC 51142. Algal Res 2014;5:103–11.
[18]Riebesell U, Wolf-Gladrow DA, Smetacek V. Carbon dioxide limitation of marine phytoplankton growth rates. Nature 1993;361(6409):249–51.
[19]Gattuso JP, Magnan A, Billé R, Cheung WWL, Howes EL, Joos F, et al.
Contrasting futures for ocean and society from different anthropogenic CO2
emissions scenarios. Science 2015;349:aac4722.
[20] Yang Y, Hansson L, Gattuso J-P. Data compilation on the biological response to ocean acidification: An update. Earth Syst Sci Data 2016;8(1):79–87.
[21]Gao K, Beardall J, Häder DP, Hall-Spencer JM, Gao G, Hutchins DA. Effects of ocean acidification on marine photosynthetic organisms under the concurrent influences of warming, UV radiation, and deoxygenation. Front Mar Sci 2019;6:1–18.
[22]Eichner M, Rost B, Kranz SA. Diversity of ocean acidification effects on marine N2fixers. J Exp Mar Biol Ecol 2014;457:199–207.
[23]Evans W, Hales B, Strutton PG. Seasonal cycle of surface ocean pCO2on the Oregon shelf. J Geophys Res Oceans 2011;116:C05012.
[24]Inomura K, Masuda T, Gauglitz JM. Active nitrogen fixation byCrocosphaera expands their niche despite the presence of ammonium – A case study. Sci Rep 2019;9:15064.
[25]Inomura K, Omta AW, Talmy D, Bragg J, Deutsch C, Follows MJ. A Mechanistic model of macromolecular allocation, elemental stoichiometry, and growth rate in phytoplankton. Front Microbiol 2020;11.
[26]Inomura K, Bragg J, Riemann L, Follows MJ, Virolle M-J. A quantitative model of nitrogen fixation in the presence of ammonium. PLoS One 2018;13(11):
e0208282.
[27] Inomura K, Wilson ST, Deutsch C, Gilbert J. Mechanistic model for the coexistence of nitrogen fixation and photosynthesis in marineTrichodesmium.
mSystems 2019;4(4).https://doi.org/10.1128/mSystems.00210-19.
[28] Inomura K, Follett CL, Masuda T, Eichner M, Prášil O, Deutsch C. Carbon transfer from the host diatom enables fast growth and high rate of N2fixation by symbiotic heterocystous cyanobacteria. Plants 2020;9(2):192.https://doi.
org/10.3390/plants9020192.
[29]Inomura K, Bragg J, Follows MJ. A quantitative analysis of the direct and indirect costs of nitrogen fixation: a model based onAzotobacter vinelandii.
ISME J 2017;11(1):166–75.
[30] Inomura K, Deutsch C, Wilson ST, Masuda T, Lawrenz E, Bucˇinská L, et al.
Quantifying oxygen management and temperature and light dependencies of
nitrogen fixation by Crocosphaera watsonii. mSphere 2019;4(6).https://doi.
org/10.1128/mSphere.00531-19.
[31]Rabouille S, Staal M, Stal LJ, Soetaert K. Modeling the dynamic regulation of nitrogen fixation in the cyanobacterium Trichodesmium sp. Appl Environ Microbiol 2006;72(5):3217–27.
[32]Agawin NSR, Rabouille S, Veldhuis MJW, Servatius L, Hol S, van Overzee HMJ, et al. Competition and facilitation between unicellular nitrogen-fixing cyanobacteria and non-nitrogen-fixing phytoplankton species. Limnol Oceanogr 2007;52(5):2233–48.
[33]Grimaud GM, Rabouille S, Dron A, Sciandra A, Bernard O. Modelling the dynamics of carbon – nitrogen metabolism in the unicellular diazotrophic cyanobacteriumCrocosphaera watsoniiWH8501, under variable light regimes.
Ecol Model 2014;291:121–33.
[34]Monod J. The growth of bacterial cultures. Ann Rev Mar Sci 1949;3:371–94.
[35]Deschamps P, Colleoni C, Nakamura Y, Suzuki E, Putaux J-L, Buleon A, et al.
Metabolic symbiosis and the birth of the plant kingdom. Mol Biol Evol 2008;25 (3):536–48.
[36]Rittmann BE, McCarty PL. Environmental Biotechnology: Principles and Applications. New York, NY: McGraw-Hill; 2001.
[37]Ji X, Verspagen JMH, van de Waal DB, Rost B, Huisman J. Phenotypic plasticity of carbon fixation stimulates cyanobacterial blooms at elevated CO2. Sci Adv 2020;6:eaax2926.
[38]Polerecky L, Masuda T, Eichner M, Rabouille S, Vancová M, Kienhuis MVM, et al. Temporal patterns and intra- and inter-cellular variability in carbon and nitrogen assimilation by the unicellular cyanobacteriumCyanothecesp. ATCC 51142. Front Microbiol 2021;12:620915.
[39]Swinnen IAM, Bernaerts K, Dens EJJ, Geeraerd AH, Van Impe JF. Predictive modelling of the microbial lag phase: A review. Int J Food Microbiol 2004;94:137–59.
[40]Mulderij G, Mooij WM, Smolders AJP, Donk EV. Allelopathic inhibition of phytoplankton by exudates from Stratiotes aloides. Aquat Bot 2005;82 (4):284–96.
[41]Rolfe MD, Rice CJ, Lucchini S, Pin C, Thompson A, Cameron ADS, et al. Lag phase is a distinct growth phase that prepares bacteria for exponential growth and involves transient metal accumulation. J Bacteriol 2012;194(3):686–701.
[42]Miller AG, Colman B. Active transport and accumulation of bicarbonate by a unicellular cyanobacterium. J Bacteriol 1980;143(3):1253–9.
[43]Miller AG, Espie GS, Canvin DT. Physiological aspects of CO2 and HCO3
transport by cyanobacteria: a review. Can J Bot 1990;68(6):1291–302.
[44]Kaplan A, Badger MR, Berry JA. Photosynthesis and the intracellular inorganic carbon pool in the bluegreen algaAnabaena variabilis: Response to external CO2concentration. Planta 1980;149(3):219–26.
[45] Badger MR, Spalding MH (2000) CO2acquisition, concentration and fixation in cyanobacteria and algae. In: Leegood RC, Sharkey TD and von Caemmerer S (eds), Advances in Photosynthesis, Vol 9. Photosynthesis: Physiology and Metabolism. 9: 399–434.
[46]Price GD, Badger MR, Woodger FJ, Long BM. Advances in understanding the cyanobacterial CO2-concentrating-mechanism (CCM): Functional components, Ci transporters, diversity, genetic regulation and prospects for engineering into plants. J Exp Bot 2008;59:1441–61.
[47]Ogawa T, Kaplan A. Inorganic carbon acquisition systems in cyanobacteria.
Photosynth Res 2003;77:105–15.
[48]Eichner M, Thoms S, Kranz SA, Rost B. Cellular inorganic carbon fluxes in Trichodesmium: A combined approach using measurements and modelling. J Exp Bot 2015;66:749–59.
[49]Ploug H, Adam B, Musat N, Kalvelage T, Lavik G, Wolf-Gladrow D, et al. Carbon, nitrogen and O2 fluxes associated with the cyanobacterium Nodularia spumigena in the Baltic Sea. ISME J 2011;5:1549–58.
[50]Zavrˇel T, Ocˇenášová P, Sinetova M, Cˇ erveny´ J. Determination of Storage (Starch/
Glycogen) and Total Saccharides Content in Algae and Cyanobacteria by a Phenol-Sulfuric Acid Method. Bio-Protocol. 2018;8:1–13.