MŰHELYTANULMÁNYOK DISCUSSION PAPERS
INSTITUTE OF ECONOMICS, CENTRE FOR ECONOMIC AND REGIONAL STUDIES, HUNGARIAN ACADEMY OF SCIENCES - BUDAPEST, 2018
MT-DP – 2018/11
Forced reduction of pension contribution rate?
ANDRÁS SIMONOVITS
2
Discussion papers MT-DP – 2018/11
Institute of Economics, Centre for Economic and Regional Studies, Hungarian Academy of Sciences
KTI/IE Discussion Papers are circulated to promote discussion and provoque comments.
Any references to discussion papers should clearly state that the paper is preliminary.
Materials published in this series may subject to further publication.
Forced reduction of pension contribution rate?
Author:
András Simonovits research advisor Institute of Economics
Centre for Economic and Regional Studies, Hungarian Academy of Sciences also Mathematical Institute of Budapest University of Technology
E-mail: simonovits. andras@krtk.mta.hu
June 2018
Forced reduction of pension contribution rate?
András Simonovits
Abstract
Due to various causes, the pension contribution rate can be reduced temporarily below its long-term value. We call a reduction forced if the balance of the public pension system is preserved through excessive wage-hikes and irritable relative devaluation of pensions in progress. A very simple overlapping cohorts model shows the limits of this policy and the resulting unfairness among cohorts.
Keywords: public pensions, pension contribution rate, indexation, fairness among cohorts
JEL: D10, H55
4
A nyugdíjjárulékkulcs erőltetett csökkentése?
Simonovits András
Összefoglaló
Különféle okokból a nyugdíjjárulékkulcs időlegesen egyensúlyi értéke alá csökkenhet.
A csökkentést erőltetettnek nevezzük, ha a társadalombiztosítási nyugdíjrendszer egyensúlya túlzott bérnövekedéssel és a már megállapított nyugdíjak irritáló mértékű relatív leértékelésével valósul meg. Egy nagyon egyszerű együtt élő korosztályok modellje mutatja meg e politika korlátait és a korosztályok között keletkező méltánytalanságot.
Tárgyszavak: társadalombiztosítási nyugdíjak, nyugdíjjárulékkulcs, indexálás, korosztályok közti méltányosság
JEL: D10, H55
Forced reduction of pension contribution rate?
by
Andr´as Simonovits
Institute of Economics, CERS, Hungarian Academy of Sciences also Mathematical Institute of Budapest University of Technology,
Budapest, T´oth K´alm´an 4, Hungary, 1097 June 20, 2018
Abstract
Due to various causes, the pension contribution rate can be reduced temporarily below its long-term value. We call a reduction forced if the balance of the public pension system is preserved through excessive wage-hikes and irritable relative devaluation of pensions in progress. A very simple overlapping cohorts model shows the limits of this policy and the resulting unfairness among cohorts.
Keywords: public pensions, pension contribution rate, indexation, fairness among cohorts
JEL-codes: D10, H55
i
1. Introduction
In a pay-as-you-go public pension system, the balanced pension contribution rate is determined as the product of the system old-age dependency ratio (the ratio of the number of pensioners to that of workers) and of the aggregate replacement ratio (the ratio of average pension to average wage). Though the rise of normal (and effective) retirement age can slow down the secular rise of the system dependency ratio, the de- crease of the aggregate replacement ratio is also needed to keep the pension contribution rate constant or even reduce its value. There are two methods to achieve this aim:
(a) to diminish the newly granted benefits and (b) to devalue the benefits in progress with respect to the average wage. Method (a) is very difficult politically and is very slow; method (b) can be rather easy politically and is very fast in practice; only the indexation of benefits in progress should be linked to prices rather than wages and the real growth rate of the average wage should be fast enough. We call the reduction of pension contribution rateforced if the balance of the public pension system is preserved through excessive wage-hikes and irritable relative devaluation of pensions in progress.
We shall study such a policy in the present paper.
During 2016 and 2018 in Hungary, the gross and net real wages grew much faster than the GDP: altogether by 28% vs. 10%. One part of this rise was caused by the improved economic conditions and the labor shortage due to emigration. The other part was due to the forced reduction of the employer’s pension contribution rate from 22 to 14.5% (the employee’s counterpart remained 10% and the employer’s health care contribution rate was fixed at 5%). Due to the falling employer’s contribution rate, the accumulated growth of total wage cost was only 20.3% while the price indexation temporarily preserved the balance of the pension system. A further continuation of the reduction is envisaged for another three years, ending with a corresponding employer’s pension contribution rate of 8.5%.
In this paper, we consider the simplest overlapping cohorts model to analyze this unorthodox process: every cohort is represented by a single person; and every cohort’s life expectancy is constant; only the cohort’s total wage cost rises and the employer’s contribution rate decreases, raising the net wage and the initial pension even faster.
(Section 5 also takes into account the impact of the rising normal retirement age in- cluding longer contributive period and later retirement.) We shall neglect the following important factors: lower contribution rates may raise the labor participation rate, real wage acceleration increases the optimal flexible retirement age (both favorable to re- duction) but secular aging of population and the negative balance of migration increase the system dependency ratio (both unfavorable to reduction).
The model shows the infeasibility of the forced reduction of pension contribution rate and the unfairness of even the less radical policy. (We call a pension policyunfair among cohortsif subsequent cohorts receive strongly different benefit streams.) Seven tables of the paper numerically illustrate the various possible outcomes of the process started by the Hungarian government. Even those optimistic paths which are theoretically feasible, signal a dramatic rise in the inequality among subsequent cohorts.
Though the model depicts the forced reduction of pension contribution rate in a single country in a single period, namely in Hungary during 2016–2021, probably other countries had or will have similar problems. Just to give a well-known example: the long-run unsustainability of the U.S. Social Security system has been well-known but
1
no U.S. administration outlined the resolution of the problem: raising the contribution rate or reducing the benefit rate (Diamond and Orszag, 2005, especially Chapter 5). A similar idea of a radical reduction of the Social Security contribution rate through partial privatization was modeled by Feldstein (1996) and Kotlikoff (1997) but its realism is also questionable (Diamond and Orszag, 2005, especially Chapter 8; Simonovits, 2003, Chapter 15).
Since the indexation of benefits in progress plays a dominant role in the issue, we have to refer to the corresponding literature. Simonovits (2003, Chapter 14) mod- eled the temporary budgetary saving of replacing wage indexation by price indexation.
Legros (2006) studied related issues when comparing the French and the German pen- sion systems. Barr and Diamond (2008, Subsection 5.1.4) discussed the same problem in a general context. Lovell (2009) dissected the design errors of the US Social Secu- rity. Simonovits (2018, Section 14.4) analyzed the impact of indexation on the lifetime income redistribution from ex ante short-lived and lower earners to ex ante long-lived and higher earners. For the problems of proper wage indexation in NDC under rising life expectancy and cohort-specific retirement age, see Knell (2018).
The structure of the remainder the paper is as follows. Section 2 presents a rough estimate on the required real wage growth rate to reach the targeted contribution rate.
Section 3 discusses the dynamics of the time-invariant pension system. Sections 4 and 5 study time-variant pension systems with endogenous vs. exogenous gross wages. Section 6 draws the conclusions.
2. A rough estimate
In the folklore of the pension economics, there is a well-known identity: the balanced pension contribution rate (τ) is determined as the product of the system old-age de- pendency ratio (µ, the ratio of the number of pensioners to that of workers) and of the aggregate replacement ratio (γw, the ratio of average pension to average total wage cost, subindex w refers to the type of wage):
τ =µγw, where µ= P
W and γw = ¯b
¯
w, (1)
P andW denote the number of pensioners and workers, respectively, and ¯band ¯wdenote the average pension and total wage cost, respectively. If the balanced contribution rateτ is significantly reduced, then at least the dependency ratioµor the average replacement ratio γw should also be reduced.
To give an elementary numerical illustration on the planned parametric changes in terms of gross wage u in Hungary during 2018–2021, we shall heroically presume that the number of workers and pensioners and the latter’s benefits are invariant, therefore
τ2016u2018 =τ2021u2021.
The annual gross wage growth factor needed to reduce the pension contribution rate to the target one is given as
gu = 3 ru2021
u2018 = 3 rτ2018
τ2021. 2
Furthermore, anticipating from Section 4 the connection between the gross wage and the more relevant total wage cost: wt =ϕtut (see (4) below), the latter’s growth factor is equal to
gw = 3
rw2021
w2018 = 3
rϕ2021u2021
ϕ2018w2018.
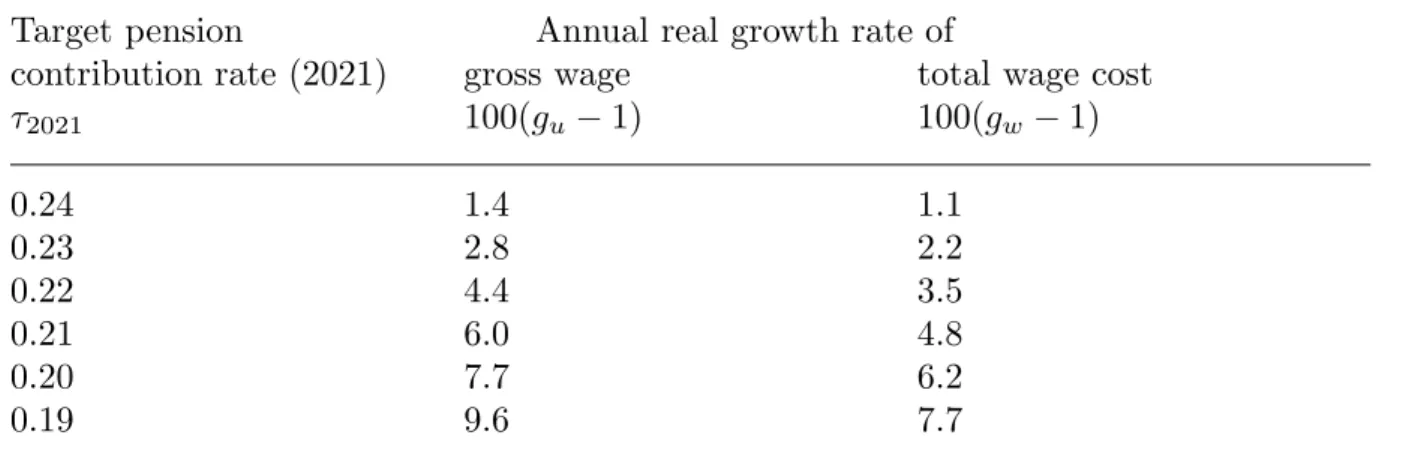
Inserting τ2018 = 0.25,ϕ2018= 1.2 and runningτ2021 from 0.24 to 0.19, Table 1 displays the steeply rising wage growth rates.
Table 1. Target pension contribution rate – wage growth rates Target pension Annual real growth rate of
contribution rate (2021) gross wage total wage cost
τ2021 100(gu −1) 100(gw −1)
0.24 1.4 1.1
0.23 2.8 2.2
0.22 4.4 3.5
0.21 6.0 4.8
0.20 7.7 6.2
0.19 9.6 7.7
In the remainder, we shall analyze three related models each showing that assuming on a number of favorable factors, such a reduction is temporarily possible with wage growth slower than given in Table 1. But the presumed wage growth is still unrealistic;
and beyond the grace period, the process should be suspended or even reversed.
3. Time-invariant system
As a prelude to the analysis of the current time-variant Hungarian pension system, we turn to the much simpler dynamic time-invariant system. Let S and T be the time spent in work and in retirement, respectively, which remain constant over time. We assume that in year 0, the gross wage is equal to 1, the net wage is equal to ψ ∈(0,1).
Let τ be the pension contribution rate, 0 < τ <1. Further details on the contribution rates are given in next Section.
Let us assume that the annual real growth factor of the gross wage is equal tog >1, i.e. the net real wage of year−k was ψg−k, and the corresponding pension benefit first granted in year −k+ 1 (following lagged price-indexation)b−k =δSψg−k, where δ >0 is the annual accrual rate and k = 1,2, . . . , T.
In total, S cohorts pay Sτ contribution, while the annual pension expenditure is equal to
B= XT
k=1
b−k =δSψ XT
k=1
g−k. 3
We use the formula for the sum of the geometric series and introduce notation T(g) =
XT
k=1
g−k= 1−g−T
g−1 for g >1 and T(1) =T. (2) Equalizing the contributions and the revenues yield
Theorem 1. In a time-invariant system with a given growth factor g≥1, there is a unique balanced pension contribution rate
τ(g) =δψT(g). (3)
To understand the operation of the price-indexed benefit system, it is worth compar- ing it with a wage-indexed one without a one-year delay, i.e. b∗−k =δSψ,k = 1,2, . . . , T. In such a system, the balanced contribution rate is equal to
τ(1) =δψT. (3∗)
Comparing (3) and (3*) we can interpret T(g) as the number of years in a hypothetical wage indexation system generating the same pension contribution rate as the actual price indexed system does.
Note also that the higher the growth rate, the lower the T(g). If τ ∈(0,1) is given, then there exists a unique balanced growth factor g, for which τ(g) =τ.
In our framework, the dependency ratio and the average replacement ratio are re- spectively equal to
µ= T
S <1 and γv = τ µψ.
Finally, we introduce the benefit ratio of the youngest to the oldest pensioners: r = b−1/b−T =gT.
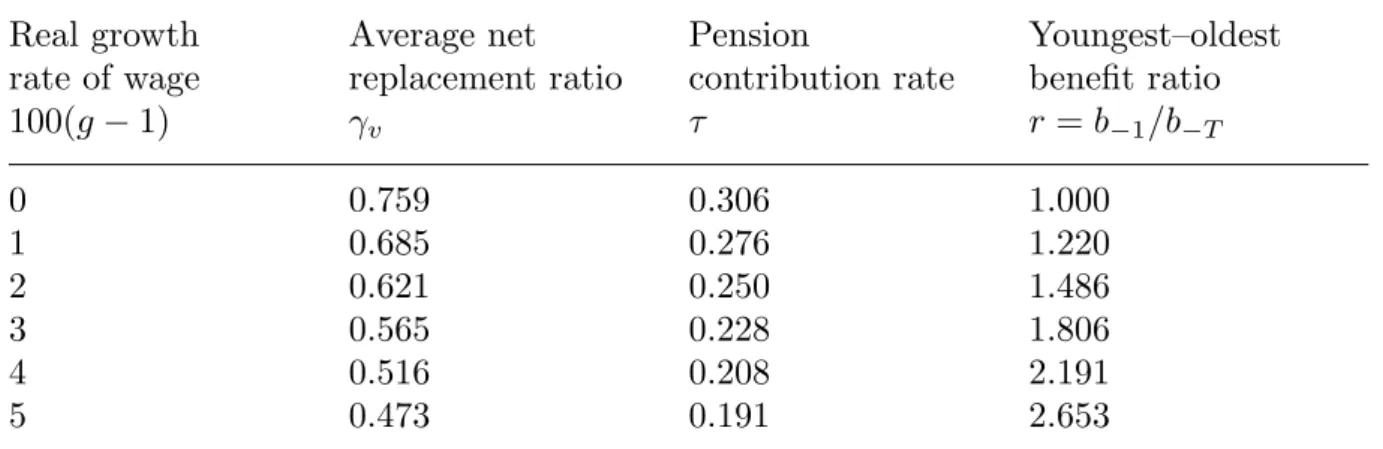
Table 2 helps understanding a well-known pitfall and an advantage of price indexa- tion: the higher the wage growth rate, the lower the average replacement ratio (bad), also the lower the pension contribution rate (good). The lag in valorization [(6)] causes a small part of the drop, and the lagging of pensions in progress [(7)] behind the initial one in indexation causes the large part. Quantitatively, with T = 20, S = 33 years and δ = 0.023 (as in Hungary), the replacement ratio drops from 0.621 to 0.473 as the growth rate rises from 2 to 5%, while the pension contribution rate drops from 0.250 to 0.191. The same distortion arises with r which rises from 1.486 to 2.653.
4
Table 2. The impact of the real growth rate of wage
Real growth Average net Pension Youngest–oldest
rate of wage replacement ratio contribution rate benefit ratio
100(g−1) γv τ r =b−1/b−T
0 0.759 0.306 1.000
1 0.685 0.276 1.220
2 0.621 0.250 1.486
3 0.565 0.228 1.806
4 0.516 0.208 2.191
5 0.473 0.191 2.653
Without struggling with dynamic effects, the equivalence of low pension contribution rate and high growth has been established. Now we move to the genuine dynamic analysis.
4. Exogenous contribution rate and endogenous gross wage
The main objective of the paper is to model the impact of the unorthodox Hungarian wage and contribution policy on the pension system. In this Section, we shall determine the evolution of the paths of the total, the gross and the net wages, and the cohort- specific pension benefits when the pension and the health contribution rates and the personal income tax rate are given exogenously. This requires the separation of val- orization of initial pensions and of indexing of pensions in progress on the one hand and the employee’s (E) and the employer’s (firm, F) contribution rates, on the other hand.
LetθE andθF be the exogenously given and constant health care contribution rates paid by the employee and the employer (the former also includes the personal income tax rate), respectively. Let τE and τtF be the exogenously given pension contribution rates paid by the employee and the employer, respectively, their sum being the pension contribution rate τt = τE +τtF—the latter two time-variant. By definition, for a given gross wage ut, the total and the net wages in year t are respectively equal to
wt =ϕtut, ϕt = 1 +θF +τtF (4) and
vt =ψut, where ψ = 1−θE −τE. (5) Reflecting the logic of the current Hungarian pension system, the initial representa- tive benefit in year t is proportional to the net representative wage in year t−1:
bt =δSvt−1. (6)
N.B.: (6) is not valid for individual wage paths like (ωt−k); vt−1 is replaced by Q−1PQ
k=1ωt−kvt−1/vt−k, Q >1 is the number of contributive years counted.
5
Due to the price indexation of benefits in progress, in year t (in real terms) the representative benefit set k−1 years earlier is still equal to
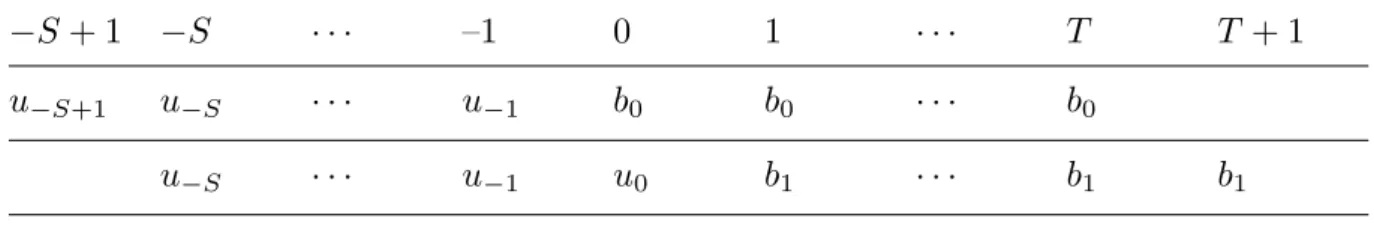
bt−k =δSvt−k, k = 2, . . . , T. (7) Table 3 compares two overlapping cohorts retiring in years 0 and 1 and having almost the same earning path except for the start and the ending but totally different (flat) benefit paths.
Table 3. Overlapping wage and benefit paths
−S+ 1 −S · · · –1 0 1 · · · T T + 1
u−S+1 u−S · · · u−1 b0 b0 · · · b0
u−S · · · u−1 u0 b1 · · · b1 b1
Note. b0 =βψu−1 vs. b1 =βψu0, u0 > u−1.
The balance equation of the pension system in year t is given by τtSut =
XT
k=1
bt−k. (8)
Substituting (5)–(7) into (8) results in τtut =δψ
XT
k=1
ut−k, t = 0,1, . . . . (9)
Since we consider time-variant systems which after a short transition become time- invariant, we return to the time-invariant system of Section 3, when τt ≡ τ. Then (9) simplifies to
ut = δψ τ
XT
k=1
ut−k, (10)
and a kind of stability can be proved for the relative gross wages (xt) = (ut/gt). For- mally, we have
Theorem 2. The time-invariant adjustment process (10) is globally relatively sta- ble.
Proof. Introducing notation ak= δψ
τ g−k >0, k= 1, . . . , T; (10) reduces to
xt = XT
k=1
akxt−k, t = 0,1, . . . (11) 6
where x−1 = 1, . . . , x−T are given. Note that due to (2)–(3), PT
k=1ak = 1 holds, and x−1 =· · ·=x−T = 1 forms a fixed point. Introducing
yt = min(xt−1, . . . , xt−T) and zt = max(xt−1, . . . , xt−T), (11) implies
yt−1 < yt < zt < zt−1 unless xt−1 =· · ·=xt−T.
From the bounded T-vector sequence we can choose a convergent subsequence (xtl−1, . . . , xtl−T) with a limit (x∗−1, . . . , x∗−T). If it is not flat, then for the corre- sponding maximum, z∗∗ < z∗ holds, contradicting the implication.
Returning to the time-variant adjustment process, it can be made more compact by making a transformation. Introducing notationUt−1 =PT
k=1ut−k, (9) can be rewritten as
τtut =δψUt−1.
Repeating it as τt−1ut−1 = δψUt−2, we obtain a more compact T + 1-order difference equation:
ut = 1 τt
δψ[ut−1−ut−T−1+Ut−2] = [δψ+τt−1]ut−1−δψut−T−1
τt
. (12)
Theorem 3. For exogenously varying employer’s and total pension contribution rates, the gross wage path is endogenously determined by either (9) or (12).
Remark. Having solved either (9) or (12) for the gross wage path (ut), (4)–
(7) yield the path of total wage (wt), net wage (vt) and cohort-specific benefits (bt), respectively.
Our minimodel can be used to illustrate numerically the latest Hungarian devel- opments in a stylized way. We neglect a number of complications: gender differences including Females 40 and the permanently changing retirement rules (cf. Czegl´edi, Si- monovits, Szab´o and Tir, 2017). Rather than struggling with the actual initial states (τt for t < 0) we choose τE = 0.10,τ−1F = 0.22, furthermore, θE = 0.15 + 0.085 = 0.235 and θF = 0.05 implying δ = 0.023 (close to the steady state parameter values of Table 2, first row, g = 1.0).
The most important parameter values of the shock concerning the gross wage cost dynamics are as follows: there is an acceleration from the long-term growth rate of 2%.
It is assumed that the employer’s pension contribution rateτtF drops from 0.22 (t =−1) to 0.09 (t= 5) at a decelerated rate and then stays there (column 2 of Table 4). (While in the real process, a year of fast wage growth prepared the way for a 5%point reduction in the next year, here the reduction is distributed between two years.) As the mirror image, the endogenous real growth rate of the total wage suddenly rises step by step to 11.7% (in t = 5) and then drops to 3.8% by t = 6. Note, however, that the low contribution rate can only be sustained if the total wage cost accelerates again from 3.8 to 5.9% and when the youngest pensioner of the older regime dies int= 19, the implied growth rate is already equal to 5.9%. A terrifying consequence of this policy is that the ratio of the youngest to the oldest pensioner’s benefit is equal to 3.35!
7
Table 4. Forced reduction of contribution rate: long Employer’s
pension R e a l g r o w t h Initial
contribution r a t e o f pension
Year rate net wage total wage benefit
t τtF 100(gvt −1) 100(gwt −1) bt
–1 0.22 0 0 0.528
0 0.19 10.3 7.7 0.528
1 0.17 8.0 6.2 0.583
2 0.15 9.0 7.2 0.629
3 0.13 10.3 8.5 0.686
4 0.11 11.8 9.9 0.756
5 0.09 13.7 11.7 0.846
6 0.09 3.8 3.8 0.962
· · · · · ·
12 0.09 4.8 4.8 1.232
· · · · · ·
19 0.09 5.9 5.9 1.769
Remark. τt =τE+τtF.
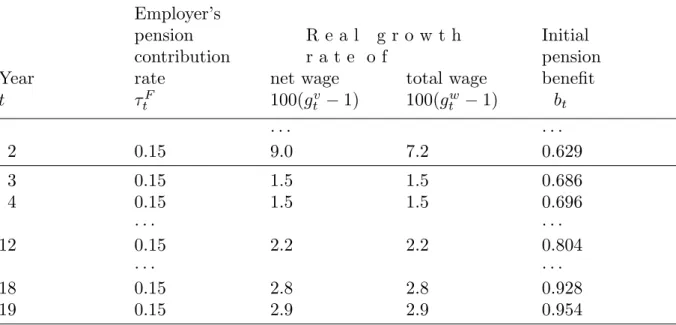
Table 5 displays a sensible solution of the emerging crisis: stop the reduction process at τ2F = 0.15, i.e. with the total rate τ2 = 0.2 (the previous rows are the same as those in Table 5 above, therefore they are dropped). Then the induced real wage growth rates would be rather modest: the long run growth rate diminishes to 2.9%—close to row 4 of Table 2. Then the adaptation is not so erratic than before but its realism is still doubtful.
Table 5. Forced reduction of contribution rate: short Employer’s
pension R e a l g r o w t h Initial
contribution r a t e o f pension
Year rate net wage total wage benefit
t τtF 100(gvt −1) 100(gwt −1) bt
· · · · · ·
2 0.15 9.0 7.2 0.629
3 0.15 1.5 1.5 0.686
4 0.15 1.5 1.5 0.696
· · · · · ·
12 0.15 2.2 2.2 0.804
· · · · · ·
18 0.15 2.8 2.8 0.928
19 0.15 2.9 2.9 0.954
8
5. Exogenous contribution rates and total wages
In Section 4, we determined the evolution of gross wages induced by the exogenously varying contribution rates. Now we give up this assumption and let the gross wage and the contribution rate vary together, allowing for temporary imbalance between revenues and expenditures. (For example, the imbalance can be absorbed by the quite flexible health budget.) We also model rising normal retirement age. (N.B. In Hungary, NRA rises from 63 years (2016) to 65 years (2022) by four months every year.) We do not model its impact on the time spent in retirement (as if it were annulled by a parallel rise in the life expectancy) but we allow for rising length of contribution until 2019:
St = 33 + 0.5(t−2016) for t= 2016,2017,2018 and St = 35 later. (13) Also, we diminish the entry of new pensioners by half until 2022, represented by multi- plierat in (14) below, being equal to 0.7 until 2022 and then 1 (an ad hoc assumption).
To get rid of the complex problem of benefits in 2016 granted k = 1,2, . . . , T years earlier, we model the pension expenditures like
Bt =Bt−1+δ(atStvt−1−S2015v2015). (14) Furthermore, pension revenues are given as
Rt =τtStut. (15)
We do not insist on the equilibrium of the system.
We compare three scenarios: Scenario 1 depicts the forced reduction of pension contribution rate as a feasible process due to high wage growth. Scenario 2 describes the process as infeasible due to slower wage growth. Scenario 3 stops the forced reduction to maintain the equilibrium. The numbers are given in percentages. Revenues and expenditures are given in terms of the initial revenue.
Scenario 1. Persistently fast wage growth and fast reduction of pension contribution rate
The first scenario (displayed in Table 6) is consistent with the government plan but it assumes very fast real total wage growth, namely 5% per year.
9
Table 6.
Persistently fast wage growth and fast reduction of pension contribution rate Pension contrib- Real growth rate P e n s i o n
Year ution rate of total wage revenues expenditures
t τt 100(gwt −1) Rt Bt
2016 0.32 7.4 100.0 95.6
2017 0.27 5.9 94.4 94.5
2018 0.245 5.8 93.9 93.9
2019 0.225 5.2 93.6 93.6
2020 0.205 5.2 91.3 93.6
2021 0.185 5.1 88.1 93.9
2022 0.185 5.1 92.5 94.6
2023 0.185 5.0 97.2 97.8
2024 0.185 5.0 102.0 101.4
2025 0.185 5.0 107.1 105.3
Scenario 2. Decelerating wage growth and fast reduction of pension contri- bution rate
The second scenario (Table 7) reduces the total wage growth rate to a feasible value namely 3% starting with 2019 but the government continues its reduction program.
Then the gap between the revenues and the expenditures widens and by 2022 reaches 8% of the initial revenues, amounting to 1% of the GDP.
Table 7.
Decelerating wage growth and fast reduction of pension contribution rate Pension contrib- Real growth rate P e n s i o n
Year ution rate of total wage revenues expenditures
t τt 100(gwt −1) Rt Bt
2019 0.225 3.2 91.9 93.6
2020 0.205 3.2 87.9 93.5
2021 0.185 3.2 83.3 93.7
2022 0.185 3.0 85.8 94.0
2023 0.185 3.0 88.3 96.7
2024 0.185 3.0 91.0 99.5
2025 0.185 3.0 93.7 102.6
10
Scenario 3. Decelerating wage growth and reduction of pension contribution rate
The third scenario (Table 8) adjusts the pension contribution rate to the decelerating total real wage growth. Stopping at 20.5 rather than 18.5, the equilibrium is more or less preserved.
Table 8.
Decelerating wage growth and pension contribution rate Pension contrib- Real growth rate P e n s i o n
Year ution rate of total wage revenues expenditures
t τt 100(gwt −1) Rt Bt
2019 0.225 3.2 91.9 93.6
2020 0.205 3.2 87.9 93.5
2021 0.205 3.0 90.5 93.7
2022 0.205 3.0 93.2 93.9
2023 0.205 3.0 96.0 96.4
2024 0.205 3.0 98.9 99.2
2025 0.205 3.0 101.9 102.1
Even this scenario maintains a distorted pension profile where the benefits of those who retired in 2019 are cc. 28% higher than the benefits of those who retired in 2016.
Note that these runs are quite primitive and further examinations are needed to corroborate their robustness.
5. Conclusions
Under price indexation of pensions in progress, a temporary acceleration of the total real wage dynamics makes room for a similar reduction of the pension contribution rate, further accelerating the gross and net real wage dynamics. We underline that such a policy presupposes a permanently high potential growth (5–6% vs. 2–3% per year), moreover, it creates unbearable unfairness among subsequent cohorts. It would be interesting to know if the ‘social planner’ is aware of these problems or not.
References
Barr, N. and Diamond, P. (2008): Reforming Pensions: Principles and Policy Choices, Oxford, Oxford University Press.
Czegl´edi, T; Simonovits, A, Szab´o, E. and Tir, M. (2016): “What has been Wrong with the Retirement Rules in Hungary?”,Acta Oeconomica 67, 359–387.
Diamond, P. A. and Orszag, P. R. (2005): Saving Social Security: A Balanced Approach, Washington D.C., Brookings Institution Press.
11
Feldstein, M. (1996): “The Missing Piece in Policy Analysis: Social Security Reform”, American Economic Review 861–14.
Knell, M. (2018): “Increasing Life Expectancy and NDC Pension Systems”, Journal of Pension Economics and Finance 17:2, 170–199.
Kotlikoff, L. (1997): “Privatization of Social Security: How it Works and Why it Mat- ters”, Tax Policy and the Economy 10, ed. by J. Poterba, Cambridge, MA, MIT Press 1–32.
Legros F. (2006): “NDCs: A Comparison of French and German Point Systems,” Holz- mann, R. and Palmer, E. eds. (2006): Pension Reforms: Issues and Prospects of Nonfinancial Defined Contribution (NDC) Schemes. Washington, D.C., World Bank. 203–238.
Lovell, M. (2009): “Five OAIAS Inflation Indexing Problems”, Economics: Open Ac- cess, Open Assessment E-Journal, 3.
Simonovits, A. (2003): Modeling Pension Systems, Houndsmill, Basingstoke, Palgrave, Macmillan.
Simonovits, A. (2018): Simple Models of Income Redistribution, Palgrave, Macmillan.
12