Full Terms & Conditions of access and use can be found at
https://www.tandfonline.com/action/journalInformation?journalCode=tjas20
Italian Journal of Animal Science
ISSN: (Print) 1828-051X (Online) Journal homepage: https://www.tandfonline.com/loi/tjas20
Application possibilities of selection indices in Pannon White rabbits’ breeding programme
Virág Ács, Katalin Szendrő, Hervé Garreau, Tamás Donkó, Zsolt Matics &
István Nagy
To cite this article: Virág Ács, Katalin Szendrő, Hervé Garreau, Tamás Donkó, Zsolt Matics & István Nagy (2018) Application possibilities of selection indices in Pannon White rabbits’ breeding programme, Italian Journal of Animal Science, 17:4, 884-889, DOI:
10.1080/1828051X.2018.1436007
To link to this article: https://doi.org/10.1080/1828051X.2018.1436007
© 2018 Kaposvár University. Published by Informa UK Limited, trading as Taylor &
Francis Group.
Published online: 15 Feb 2018.
Submit your article to this journal
Article views: 766
View related articles
View Crossmark data
PAPER
Application possibilities of selection indices in Pannon White rabbits ’ breeding programme
Virag Acs a, Katalin Szendr}ob , Herve Garreauc, Tamas Donkod, Zsolt Maticsa and Istvan Nagya
aAllatnemes ıtesi Intezeti Tanszek, Kaposvar University, Kaposvar, Hungary;bMarketinges Kereskedelem Tanszek, Kaposvar University, Kaposvar, Hungary;cEgeszseg€ugyi K€ozpont Diagnosztikaies Onkoradiologiai Intezet, Kaposvar University, Kaposvar, Hungary;
dGenPhySE, INRA, INPT ENVT, Tolouse University, Castanet Tolosan, France
ABSTRACT
Genetic parameters for 21-d litter weight (LW21) and thigh muscle volume (TMV) were esti- mated, and based on these traits a two-trait selection index was created with the purpose of increasing the efficiency of the Pannon White rabbits’ breeding programme. Litter weight at 21 d of age (LW21,n¼22,002) and thigh muscle volume (TMV,n¼8124) measurements (based on computed tomography–CT) were analysed that were recorded between 1992 and 2016. The evaluated animals were reared in 4178 litters and the total number of rabbits involved in the pedigree file was 14,124. LW21 and TMV records were analysed jointly in a two-trait animal model. The estimated heritability for LW21 and TMV were 0.10 ± 0.01 and 0.21 ± 0.02, respect- ively, and the estimated genetic correlation between these traits was0.24 ± 0.07. The common environmental effect had the same magnitude (0.10 ± 0.01) as the additive genetic effect. The created selection index constructed to have 50 and 50% contribution of the measured traits.
Application possibility of the created index was tested on a given kindling batch. In this case, the first step of the selection procedure was performed either according to the current breeding programme (based on the LW21 breeding values) or based on the two trait selection index. The second step of selection was not changed (based on the TMV breeding values). The consequen- ces of using index scores instead of the regular procedure were obtaining 27.8% higher average breeding value for TMV and 11.4% lower average breeding value for LW21. These results suggest that introduction of the index may improve economic efficiency.
ARTICLE HISTORY Received 13 September 2017 Revised 30 November 2017 Accepted 29 December 2017 KEYWORDS
Rabbit; selection index;
litter weight; thigh muscle volume
Introduction
In the Pannon rabbit breeding programme of the Kaposvar University, Pannon White breed is one of the dam crossing partners. The breed was selected to average daily gain (ADG) and L-value (defined anatom- ical points of the surface of the longitudinal cross- section of the long thoracic backbone measured in the interstitial plane of the limbs 2, 3, 4 and 5, respect- ively) previously with computed tomography (CT). In 2004, the thigh muscle (TMV) rellaced L-value in the selection criteria because its average volume is greater than the volume of the back muscle (longissimus dorsi) Thus selection can improve more the muscle volume of the carcase. On the other hand, direct selection for growth and carcase traits led to serious reduction in reproduction. In 2014, ADG was changed by litter weight at day 21 in the breeding programme.
At present, the Pannon White rabbits are pre-selected to litter weight at 21 d of age (LW21) and the second selection step is performed for thigh muscle volume (TMV) (Matics et al.2014).
Conventional selection for slaughter traits (progeny test) can lengthen the generation interval but at the Kaposvar University, CT-aided rabbit selection is being used since 1992 (Szendr}o et al. 1992) thus progeny test can be avoided. Contrary to the favourable results, Szendr}o et al. (2010) and Gyovai et al. (2012) pointed out that TMV has a negative correlation with the LW21 (from 0.37 to 0.7). As a result, individuals with the best TMV may not have the best LW21 in the first step of selection. This unfavourable correlation between the two traits increases the difficulty to make simultaneous improvements in LW21 and TMV, and the selection process of the breed needs to make compromises among the selection criteria traits.
CONTACTMiss ViragAcs acs.virag@ke.hu Faculty of Agricultural and Environmental Sciences, Kaposvar University, Guba Sandor Str. 40, Kaposvar H7400, Hungary
This article was originally published with errors. This version has been corrected. Please see corrigendum (http://dx.doi.org/10.1080/1828051X.2018.
1467999).
ß2018 Kaposvar University. Published by Informa UK Limited, trading as Taylor & Francis Group.
This is an Open Access article distributed under the terms of the Creative Commons Attribution-NonCommercial License (http://creativecommons.org/licenses/by-nc/4.0/), which permits unrestricted non-commercial use, distribution, and reproduction in any medium, provided the original work is properly cited.
https://doi.org/10.1080/1828051X.2018.1436007
For the improvement of genetic value of livestock, individuals with the best breeding values have to be chosen as the parents of the next generation. When the information derives from several relatives the breeding values can be estimated with regression the- ory, but in animal breeding, the multiple regression theory for estimating the breeding values is called selection index.
Application of selection indices may be a good solution to the problem mentioned by Gyovai et al.
(2012), since profitability is an appropriate parameter to express the importance of the traits in the final evaluation. TMV is also an interesting parameter in an economic point of view, due to its great amount of muscle it gives more profit with the same input.
Selection indices take the genetic and economic val- ues into account and determine the weighting, based on how much profit can be made by increasing the measured trait with one unit. According to Hazel (1943), the aim of the selection index method is to maximise the genetic progress towards a stated eco- nomic goal. However, the improvement of the traits in the breeding goal may differ inheritability, variability and profitability. Later, the method was completed with some modifications, such as separating the index- ing in two steps by Kyle and Chapman (1953), who added the breeding values for the traits of each indi- vidual at the first step and adding the economic val- ues in the second step.
Economic values had been calculated in rabbit breeding previously for prolificacy and growth traits (Armero and Blasco 1992; Prayaga and Eady 2000;
Cartuche et al. 2014), but so far no index was devel- oped including reproductive and carcase traits simultaneously.
Pesek and Baker (1969) created a ‘desired gain’ index by modifying the indexing theory and added substitute desired gains which made it possible to improve the traits in the breeding goal without the exact knowledge of the economic values. Hence, the aim of this study was to develop a selection index for 21-d litter weight and for thigh muscle volume.
Materials and methods
Data collection and production system
This analysis is based on 22,002 LW21 and 8124 TMV measurements from Pannon White rabbit does and growing rabbits, respectively. Records were collected between 1992 and 2016 at the Experimental Rabbit farm of Kaposvar University, Hungary. Animals were reared in 4178 litters and the total number of rabbits
involved in the pedigree file was 14,124. The applied reproduction rhythm was 49 d and the generations were overlapping. To avoid inbreeding a circular mat- ing scheme was applied dividing the population into four subgroups. This method was described in detail by Nagy et al. (2010).
In the course of the breeding programme, litter weights were measured at 21 d of age on 122 litters.
Besides, TMV data were measured in the Kaposvar University Health Center Institute of Diagnostic Imaging and Radiation Oncology. A Siemens Somatom Cardiac type multidetector CT was used to make the scans with the following settings: tube voltage: 120 kV, current: 140 mAs, data collection mode: spiral. The scanned rabbits were 11 weeks old and fixed with belts in a special plastic container without anaesthesia.
During the CT measurement, the scans were taken of the whole body and segmented with 3D Slicer’sauto- matic segmentation module (Fedorov et al. 2012) between thecrista iliacaof theos iliumand the patella with 2 mm slice thickness. Each CT scan had between 0 and þ140 (on HU scale) voxel frequency on the density scale for the muscle tissue.
Animal models
REML and BLUP methods were used to estimate the genetic parameters and breeding values for LW21 and TMV, and these traits were analysed jointly using a two-trait animal model. PEST software (Neustadt, Germany) (Groeneveld,1990) was used for data coding and the variance components were estimated with VCE 6 (Groeneveld et al.2008).
The matrix equation of the applied model was as follows:
y1
y2 !
¼ X1 0 X2
! b1
b2 !
þ Z1 0 Z2
! a1
a2 !
þ W1 0 W2
! c1 c2
! þ e1
e2
!
where yi¼vector of the observations of the ith trait, bi¼vector of the fixed effects of the ith trait, ai¼the vector of random effects for theith trait, ci¼vector of common litter effects for the ith trait, ei¼vector of random residual effects for the ith trait. Xi, Zi and Wi
are the incidence matrices relating the records of the ith traits to fixed effects.
The descriptive statistics of the examined traits are summarised in Table1.
The structure of the applied animal model is given in Table2.
ITALIAN JOURNAL OF ANIMAL SCIENCE 885
Selection procedure and selection index
The selection procedure of the Pannon White breed is conducted in two consecutive steps for every kindling batch. In the first step, the expected LW21 breeding values of the growing rabbits are predicted based on the ancestors’ performances. Based on this prediction whole litters can be ranked within every population subgroup (i.e. all full-sibs have the same expected breeding value). In the first step of selection from a given litter with a high LW21 breeding value generally, 1–2 males and 2–3 females are selected for the second selection step unless the parents of this litter already contributed a sufficient number of breeding animals (2 breeding males per buck and 5 breeding females per doe) to the population. The second step of selection is performed based on the TMV breeding values follow- ing CT scans.
In order to test the modification possibility of the breeding programme a two-trait BLUP index (involving LW21 and TMV) was calculated using the software SEL-ACTION (Animal Breeding and Genetics Group, Department of Animal Sciences, Wageningen University, WUR, Wageningen, Netherlands) (Rutten and Bijma 2001). The characteristics of the group of animals which provide information of the selected
candidates are summarised in Table3. Identical indices were created for both males and females, considering both sexes were selected to the same selection crite- ria. The contribution of each trait was set to 50%
because selection to the carcase traits decreased sig- nificantly the reproduction and both traits are neces- sary to maintain the breed as a successful crossing partner. Besides the targeted improvement of each trait was one additive genetic standard deviation (i.e.
‘desired gain’ index (Pesek and Baker 1969). The final selection index was transformed to obtain index mean and standard deviation of 100 and 20, respectively, as it is used in the Hungarian pig breeding sector (MFSE 2017).
Index¼ 244:458þ522:523LW21 þ6:017TMV:
Testing the efficiency of the selection index
The selection process based on the current breeding programme and on the calculated index scores was compared to a chosen kindling batch where the date of insemination was 29 January 2016. In the kindling batch, 928 kits were born from 121 dams and the number of bucks was 42. Using both selection alterna- tives in the first step of selection 69 litters (122 indi- viduals) were selected for CT scan based on either on the LW21 expected breeding values or on the calcu- lated BLUP index scores. As the two methods resulted in different rankings, altogether 139 rabbits were sent to CT scan and the proportion of the male and female individuals were 1:1. Regardless of the method of the Table 1. Descriptive statistics of the measured
traits.
Trait LW21, kg TMV, cm3
Number of records 22,002 8124
Maximum 5.51 534
Minimum 0.32 176
Mean 2.64 326
SD 0.65 40.50
CV, % 24.80 12.40
LW21: litter weight at 21 d; TMV: thigh muscle volume.
Table 2. The structure of the applied animal model.
Effect Type Levels Traits
LW21 TMV
PARITY F 4 –
YEARMONTH1 F 261 –
AGE21 C 1 –
LITTERSIZE21 C 1 –
PE R 11,594 –
SEX F 3 –
CT_WEIGHT C 1 –
YEARMONTH2 F 94 –
PIXEL F 5 –
CE R 4178 –
A R 14,124
LW21: litter weight at 21 d; TMV: thigh muscle volume; PARITY: parity number of the doe; YEARMONTH1: year and month of kindling; AGE21:
exact age of the kits at 21 day of measurement; LITTERSIZE21: litter size at 21 days; PE: permanent environmental effect; SEX: sex of the growing rabbits; CT_WEIGHT: body weight at CT measurement; YEARMONTH2: year and month of CT measurement; PIXEL: density range of muscle; CE: com- mon environmental effect of the doe; A: additive genetic effect.
Table 3. Characteristics of the group of animals which pro- vide information of the selection candidates.
Population size
Number of selected male parents 12
Number of selected female parents 28
Number of male selection candidates per dam
100 Number of female selection candidates
per dam
40 Total selected proportion female parents 013 Total selected proportion male parents 013 Characteristics of the used groups
Full sib group 1 with 7 animals
Half-sib group 1 with 1 dam producing 8 animals Progeny group 1 with 1 dam producing 8 progeny Number of selected male and female parents: number of selected animals after the final stage of selection; Number of male/female selection candi- dates per dam: number of male/female offspring born per dam; Total selection proportion male/female parents: the selected proportion among male and female candidates (0<p<1); Full sib group 1 with 7 animals:
1 full sib group is defined because the male and female selection candi- dates are both selected to LW21 and TMV; Half-sib group 1 with 1 dam producing 8 animals: number of discint half-sib group; Progeny group 1 with 1 dam producing 8 progeny: number of the progeny group where the proportion of the male/female selection candidates may be full sibs.
first step selection after the CT scans the second step of selection was performed based on TMV breeding values.
Results and discussion
Heritabilities, genetic correlations
The estimated heritabilities (diagonal), genetic correla- tions (off-diagonal) and standard errors are presented in Table4.
The estimated heritability for LW21 was low. The heritability of litter traits, such as LW21 were compar- able with the previous studies conducted at the Kaposvar University (Gyovai et al. 2012; Nagy et al.
2013) where the heritability for LW21 varied between 0.10 and 0.17. It is also in accordance with the herit- ability measured by Lukefahr and Hamilton (1997) and Al-Saef et al. (2008) where it ranged between 0.02 and 0.17, which shows that the non-genetic and environ- mental factors represent the major source of the trait.
TMV showed higher heritability than LW21 but con- sidering that this trait can be defined as a carcase trait, it was lower than expected. On the other hand, look- ing the results of comparable studies, Gyovai et al.
(2008) and Nagy et al. (2013) observed similar results
(0.21 ± 0.03) for the heritability of thigh muscle volume for Pannon White rabbit breed.
The estimated common environmental effect, per- manent environmental effect and their standard errors for LW21 and TMV are provided in Table4.
The magnitude of permanent environmental effect exceeded that of the heritability resulting moderate repeatability of LW21. On the contrary, the common environmental effect had the same magnitude as the additive genetic effect. Rastogi et al. (2000), Gyovai et al. (2008, 2012) and Al-Saef et al. (2008) reported also low magnitude for the permanent environmental effect for litter weight with repeatability animal models.
The estimated correlation between the selection index and the examined traits are provided in Table5.
Possibilities for selection
The first step of the selection based on the current and alternative methods are presented in Tables6and 7. In this stage, the LW21 breeding values decreased significantly with the index selection due to the nega- tive correlation and the weighting to the TMV. The other consequence was that preselecting the rabbits based on the two trait index scores resulted somewhat higher TMV breeding values and higher index scores.
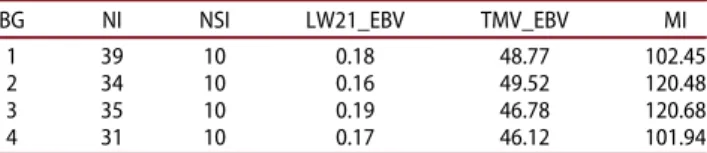
The average breeding values for LW21 and TMV by the population subgroups (depending on the method of selection in the first selection step) are presented in Tables 8 and 9. After the CT measurements the esti- mated breeding values of the LW21 decreased by Table 4. Estimated heritabilities, permanent environmental
effect and genetic correlations between the traits.
Trait h2 PE rgLW21-TMV
LW21 0.10 0.18 ± 0.01 0.24 ± 0.07
TMV 0.21 – –
h2: heritabiliy of the trait; PE: permanent environmental effect; rgLW21- TMV: measured genetic correlation between the traits in the breeding goal.
Table 5. Correlation coefficients between the selection index and the examined traits.
Trait LW21 TMV Index score
LW21 1.00 0.24 0.28
TMV – 1.00 0.84
Index score – – 1.00
LW21: 21 days litter weight; TMV: Thigh muscle volume.
Table 6. The number of litters and the selected litters in each line, the average of the calculated breeding values of the traits and the index based on regular selection.
BG NoL NoSL LW21_EBV TMV_EBV MI
1 39 20 0.23 42.40 100
2 28 17 0.20 44.20 109
3 28 16 0.22 44.20 110
4 26 16 0.22 40 99.30
BG: buck groups; NoL: number of litters; NoSL: number of selected litters;
LW21_EBV: estimated breeding values of LW21 in the parental gener- ation; TMV_EBV: estimated breeding values of TMV in the parental gener- ation; MI: mean of index scores.
Table 7. The number of the litters and the selected litters in each line, the average of the calculated breeding values of the traits and the index based on index selection.
BG NoL NoSL LW21_EBV TMV_EBV MI
1 39 20 0.17 48.40 104
2 28 17 0.17 47.80 112
3 28 16 0.19 45.10 117
4 26 16 0.15 41.90 113
BG: buck groups; NoL: number of litters; NoSL: number of selected litters;
EBV_LW21: mean of the estimated breeding values of LW21 in the paren- tal generation; EBV_TMV: mean of the estimated breeding values of the TMV in the parental generation; MI: mean of index scores.
Table 8. The selected individuals after the computed tomog- raphy (CT) measurement based on regular selection.
BG NI NSI LW21_EBV TMV_EBV MI
1 39 10 0.18 48.77 102.45
2 34 10 0.16 49.52 120.48
3 35 10 0.19 46.78 120.68
4 31 10 0.17 46.12 101.94
BG: buck group; NI: number of individuals; NSI: number of selected indi- viduals; LW21_EBV: mean of the estimated breeding values of LW21;
EBV_TMV: mean of the estimated breeding values of own TMV; MI: mean of the index scores.
ITALIAN JOURNAL OF ANIMAL SCIENCE 887
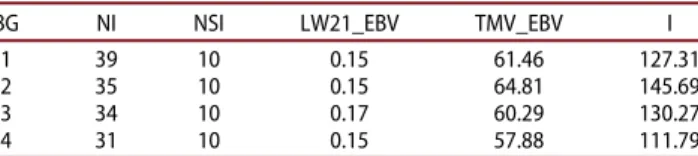
11.4% with the index selection after the two-stage selection process, on the other hand, own TMV values increased substantially by 27.8%. It can be seen that group 4 showed the worst performance after both selection steps, while groups 2 and 3 were superior.
These differences between the subgroups’ index scores were originated from the applied selection method which also focuses on maintaining the genetic diversity. In the first step of the selection process, the litters were ranked by the LW21 data and the best bucks in the parental generation were selected which produced the best litters. The main criterion was that the dams of the selected litters had to be the most distant relatives. In some cases, the dams were half- sibs due to the lack of diversity. According to this sort- ing system, after the CT examinations maximum two female and one male offspring went for further breed- ing from one sire. The consequences of the different selection strategies can be originated from the nega- tive correlation between LW21 and TMV, which was reported in our study (Table 4) and by Gyovai et al.
(2012). Despite of the small reduction of the LW21, the economic efficiency of the selection process can be increased by using indexing LW21 and TMV in the pre-selection stage, since the economic importance of the LW21 is much lower than that of TMV, as reported previously by Szendr}o et al. (2016). Prayaga and Eady (2000) and Eady and Garreau (2008) reported the prof- itability of the price per kg of growing rabbits between 1.6 and 1.75ein this case the thigh fillet pro- duces 11 e/kg revenue which gives this trait a great economic importance. In an earlier study, Miko et al.
(2010) reported the average weight difference of the thigh fillet based on a divergent selection experiment using Pannon White rabbits. These authors found that the weight of the thigh muscle was 8.5% higher in the positive groups, and there was also a 1.1% increase in the dressing out percentage compared to the negative group. These findings resulted in 0.1 e/kg additional revenue for the meat fillet and 0.03e/kg for the whole carcase. Thus the benefits achieved by Miko et al.
(2010) and by this study can be substantial through a multiplier level from the aspect of the slaughterhouse.
Considering 1,000,000 slaughtered rabbits per year the increased TMV can result 675,000 EURO profit for the slaughterhouse (Miko et al. 2010).
Conclusions
Implanting the selection index method in rabbit breeding is reasonable, especially when a special breed is selected for both production and reproduc- tion traits which are not positively correlated. The indexing technique with ‘desired gains’ can be avail- able for those traits which were not determined before from an economic point of view. For the slaughter- house, the valuable meat parts represent the main source of the profit, so it is feasible to put a selection index between the thigh muscle volume and one of the reproduction traits, even if the only relevance of this trait is to maintain the breed as a possible cross- ing partner in the future.
Ethical Approval
The Animal Care and Use Comittee approval was not obtained for this study. The analyses were carried out under standard farm management and existing data. The analyzed records were controlled by the head of the experimental farm of Kaposvar University between 1992 and 2016.
Disclosure statement
No potential conflict of interest was reported by the authors.
Funding
The research was supported by Janos Bolyai Research Scholarship [BO/01022/15]. Article publishing charge was covered by the EFOP-3.6.1-16-2016-00007 project by the European Union and the European Social Fund.
ORCID
Katalin Szendr}o http://orcid.org/0000-0002-0025-1059
References
Al-Saef AM, Khalil MH, Al-Homidan AH, Al-Dobaib SN, Al- Sobayil KA, Garcıa ML, Baselga M. 2008. Crossbreeding effects for litter and lactation traits in a Saudi project to develop new lines of rabbits suitable for hot climates.
Livest Sci. 118:238–246.
Armero Q, Blasco A. 1992. Economic weights for rabbit selection indices. J Appl Rabbit Res. 15:637–642.
Cartuche L, Pascual M, Gomez EA, Blasco A. 2014. Economic weights in rabbit meat production. World Rabbit Sci.
22:165–177.
Table 9. The selected individuals after the computed tomog- raphy (CT) measurement based on index selection.
BG NI NSI LW21_EBV TMV_EBV I
1 39 10 0.15 61.46 127.31
2 35 10 0.15 64.81 145.69
3 34 10 0.17 60.29 130.27
4 31 10 0.15 57.88 111.79
BG: buck group; NI: number of individuals; NSI: number of selected indi- viduals; LW21_EBV: mean of the estimated breeding values of LW21;
EBV_TMV: mean of the estimated breeding values of own TMV; MI: mean of the index scores.
Eady SJ, Garreau H. 2008. An enterprise gross margin model to explore the influence of selection criteria for breeding programs and changes to management systems.
Presented at 9.World Rabbit Congress, Verone, Italy (2008- 06-10 - 2008-06-13). Brescia, Italy: Fondazione Iniziative Zooprofilattiche e Zootecniche.
Fedorov A, Beichel R, Kalpathy-Cramer J, Finet J, Fillion-Robin JC, Pujol S, Bauer C, Jenings D, Fenessy F, Sonka M, et al.
2012. 3D slicer as an image computing platform for the quantitative imaging network. Magn Reson Imaging.
30:1323–1341.
Gyovai P, Nagy I, Gerencser Z, Metzger S, Radnai I, Szendr}o Z. 2008. Genetic parameters and trends of the thigh muscle volume in Pannon White rabbits. In Proc. 9th World Rabbit Congress, Verona, Italy. p. 115–129.
Groeneveld E. 1990. PEST Users’ manual. Institute of animal husbandry and animal behaviour Neustadt: Federal Research Centre.
Groeneveld E, Kovac M, Mielenz N. 2008. VCE User’s guide and reference manual. Version 6.0. Neustadt, Germany:
Institute of Farm Genetics; p. 1–125.
Gyovai P, Nagy I, Gerencser Z, Matics Z, Radnai I, Donko T, BokorA, Farkas J, Szendr} o Z. 2012. Genetic parameters for litter weight, average daily gain and thigh muscle volume measured by in vivo computer tomography technique in Pannon White rabbits. Livestock Sci. 144:119–123.
Hazel LN. 1943. The genetic basis for constructing selection indices. Genetics. 20:476–490.
Kyle WH, Chapman AB. 1953. Effectiveness of selecting experimental check of the effectiveness of selection for rapid and slow growth rate in Hampshire swine. J Animal Sci. 5:3–15.
Lukefahr SD, Hamilton HH. 1997. Heritability and repeatabil- ity estimates of maternal performance traits in purebred and crossbred does. World Rabbit Sci. 5:99–105.
Matics Z, Nagy I, Gerencser Z, Radnai I, Gyovai P, Donko T, Dalle Zotte A, Curik I, Szendr}o Z. 2014. Pannon breeding program in rabbit at Kaposvar university. World Rabbit Sci.
22:287–300.
MFSE. 2017. Hungarian Pig Performance Testing Code.
Hungarian Purebred Pig Breeders’ Association. Kaposvar, Hungary. 1–39.
Miko A, Radnai I, Gerencser Z, Matics Z, Nagy I, Szendr}o K, Szendr}o Z. 2010. The profit of the slaughterhouses real- ized in the course of CT-aided selection of rabbits. Acta Agr Kapos. 14:103–108.
Nagy I, Gyovai P, Radnai I, Nagyne Kiszlinger H, Farkas J, Szendr}o Z. 2013. Genetic parameters, genetic trends and inbreeding depression of growth and carcass traits in Pannon terminal line rabbits. Arch Tierz. 56:191–199.
Nagy I, Curik I, Radnai I, Cervantes I, Gyovai P, Baumung R, Farkas J, Szendr}o Z. 2010. Genetic diversity and popula- tion structure of the synthetic Pannon White rabbit revealed by pedigree analyses. J Anim Sci. 88:1267–1275.
Pesek J, Baker RJ. 1969. Desired improvement in relation to selection indices. Can J Plant Sci. 49:803–804.
Prayaga KC, Eady S. 2000. Rabbit farming for meat produc- tion in Australia: preliminary estimates of economic values for production traits. Asian Australasian J Anim Sci.
13:357–359.
Rastogi RK, Lukefahr SD, Lauckner FB. 2000. Maternal herit- ability and repeatability for litter traits in rabbits in a humid tropical environment. Livest Prod Sci. 67:123–128.
Rutten JM, Bijma P. 2001. SEL-ACTIONVR manual. Animal Breeding and Genetics Group. Wageningen, Netherlands:
Wageningen University, Department of Animal Sciences.
Szendr}o K, Szendr}o Z, Gerencser Z, Radnai I, Horn P, Matics Z. 2016. Economic value of rabbit lines selected for differ- ent criteria. Proceedings of the 11th World Rabbit Science Conference; 2016.06.15-2016.06.18, Peking. Europe, Hungary: Repository of the Academy’s Library.
Szendr}o Z, Horn P, K€over G, Berenyi E, Radnai I, Bırone Nemeth E. 1992. In vivo measurement of the carcass traits of meat type rabbits by X-ray computerised tomography.
J Appl Rabbit Res. 15:799–809.
Szendr}o Z, Matics Z, Gerencser Z, Nagy I, Lengyel M, Horn P, Dalle Zotte A. 2010. Effect of dam and sire genotypes on productive carcass traits of rabbits. J Anim Sci.
88:533–543.
ITALIAN JOURNAL OF ANIMAL SCIENCE 889