https://doi.org/10.1007/s10342-020-01272-w ORIGINAL PAPER
The legacy of management approaches and abandonment on old‑growth attributes in hardwood floodplain forests in the Pannonian Ecoregion
László Demeter1 · Ákos Bede‑Fazekas1,2 · Zsolt Molnár1 · Gábor Csicsek1 · Adrienne Ortmann‑Ajkai3 · Anna Varga1 · Ábel Molnár4 · Ferenc Horváth1,2
Received: 23 September 2019 / Revised: 30 January 2020 / Accepted: 2 March 2020
© The Author(s) 2020
Abstract
In the absence of primeval floodplain forests, near-natural remnants are key references for close-to-nature forestry and nature conservation. Old-growth forest characteristics (OGCs) were quantified in 16 managed (rotation or selection) and abandoned semi-natural floodplain forests by taking snapshot inventories of structural features. Principal component analysis revealed a short gradient from closed-canopy managed stands dominated by large trees (mainly oaks) and hornbeams, with less deadwood, to abandoned older stands with more gaps, very large trees and different kinds of deadwood. All the studied forests are mainly in the early and late biostatic phases of forest development, with innovation and degradation phases almost completely absent. Results showed that selection forests had significantly more very large trees compared to rotation stands.
The difference in structure between abandoned selection stands and abandoned rotation stands was more pronounced than in their counterparts that are still managed. Based on diameter distribution and the amount of very large trees and deadwood, abandoned selection stands were closest to the structure of natural forests. Selection forests may recover certain OGCs more rapidly than rotation forests. We concluded that after 100–150 years of homogenising rotation forestry, OGCs are slow to develop in just 25 years of non-intervention. Based on our results, we recommend: (i) an increase in the rotation cycle with selective logging in order to restore and maintain OGCs in managed rotation forests and (ii) total abandonment in certain well-preserved, near-natural forests with natural flooding regimes. However, the failure of oak to regenerate naturally remains a challenge.
Keywords Central Europe · Oak-elm-ash forest · Stand structure · Rotation forestry · Sanitary selection system · Deadwood
Introduction
For around 200 years, forest management in Europe has been dominated by the age-class rotation forestry system rooted in Franco-German forestry philosophy (Jacobsen 2001;
Messier et al. 2015). Almost 70% of forests are reported as even-aged, while the mature developmental phase (older than 90% of the recommended rotation age) amounts to only around 13% (Forest Europe 2015). As a result, the conser- vation status of European forests is mostly unfavourable or poor in terms of structure and function (EEA 2014).
Intensive rotation systems applying large-scale clear cuts, artificial regeneration and different types of thinning are well documented as having a uniformising effect on forest struc- ture. Such practices completely eliminate the late develop- mental phases (e.g. late biostatic or degradation phase). Tree size and diversity, the abundance of very large trees, the
Communicated by Lluís Coll.
Electronic supplementary material The online version of this article (https ://doi.org/10.1007/s1034 2-020-01272 -w) contains supplementary material, which is available to authorized users.
* László Demeter
demeter.laszlo@okologia.mta.hu
1 Institute of Ecology and Botany, MTA Centre for Ecological Research, Alkotmány u. 2–4., Vácrátót 2163, Hungary
2 GINOP Sustainable Ecosystems Group, MTA Centre for Ecological Research, Klebelsberg Kuno u. 3., Tihany 8237, Hungary
3 Institute of Biology, University of Pécs, Ifjúság u. 6, Pécs 7624, Hungary
4 Mátyás király u. 20., Sopron 9400, Hungary
number of microhabitats and the biodiversity associated with structural and functional complexity of old-growth stands are all considerably lower (Bauhus et al. 2009; Dieler et al.
2017; Percel et al. 2018). The tree diameter distribution of selection forests is also considered to be similar to that of old-growth forests (Boncina 2000; Keren et al. 2017).
Rotation systems are better than selection systems at promoting the development of natural regeneration of light- demanding species (Mölder et al. 2019). At the same time, through thinning and giving preference to one or two eco- nomically valuable tree species, the ratio of admixing native species can be significantly reduced (Solymos 1993; Mölder et al. 2019). While the amount of deadwood is also very low, this often depends more on management decisions and on the intensity and frequency of forest use (Kapusta et al.
2020).
In order to prevent further loss of structural and func- tional diversity in forests, a wide variety of approaches have been implemented in Eastern European countries in recent decades. One such approach is the designation of strict forest reserves, left to free development (Parviainen et al. 2000).
This has contributed significantly to the recovery and main- tenance of old-growth characteristics (OGCs) in near-natural forests (Horváth et al. 2012; Burrascano et al. 2013; Paillet et al. 2015). It is widely recognised that in stands subject to intensive rotation management, recovery of the main OGCs (shape of diameter distribution, number of very large trees, volume of well-decayed large deadwood, etc.) after abandon- ment is a slow process (Vandekerkhove et al. 2009; Horváth et al. 2012; Paillet et al. 2015; Sabatini et al. 2018). Long- term abandonment or long rotation cycles therefore seem unavoidable if the aim is to restore old-growth structure in stands that were previously intensively managed (Parviainen et al. 2000; Bauhus et al. 2009). Due to the drastic decrease and disappearance of old-growth forests, however, while this reservation approach remains vital, it is still not sufficiently effective in the large-scale conservation and maintenance of OGCs (Bauhus et al. 2009). Additionally, it is always limited by the need for sustainable wood production. There is therefore an urgent need to apply alternative silvicultural approaches in managed forests that will simultaneously diversify forest structures, maintain at least some old-growth attributes in managed forests and provide timber for soci- ety (Bauhus et al. 2009; Messier et al. 2015). Alternative approaches, such as selection system, retention forestry and active restoration, are attracting increasing attention (Kee- ton 2006; Bauhus et al. 2009, Mölder et al. 2019), but the dominance of the rotation approach is changing at a very slow rate in much of Europe (Jacobsen 2001; Puettmann et al. 2015; Messier et al. 2015).
Despite the growing body of literature on the effects of alternative, close-to-nature management systems (e.g.
selection system) on stand structures and old-growth
characteristics (e.g. Boncina 2011), most studies focus on boreal forests or on the beech and spruce forest zone (Dieler et al. 2017). Such forests contain fewer large old trees and less deadwood than primeval forests (Motta et al. 2014; Pach and Podlaski 2015), while they can be richer in large trees, gaps, and patches of natural regeneration than rotation for- ests and recently abandoned rotation forests (Dieler et al.
2017; Keren et al. 2017; Mölder et al. 2019).
In Europe, one of the key distribution areas of surviving remnants of near-natural forests is Eastern Europe (Forest Europe 2015; Mikac et al. 2018; Sabatini et al. 2018), where substantial old, near-natural stands also exist in the matrix of commercially managed forests, outside strictly protected areas (Drescher et al. 2003; Prots 2010).
The Pannonian Ecoregion offers a wide range of ‘found experiments’ or ‘experiments by chance’, i.e. landscapes with similar ecological features that are driven by different local and national-level drivers. After the First World War, the Kingdom of Hungary was split up and lost more than 80% of its forested lands. A shortage of wood in Hungary led to a significant intensification of forest management, with the intensive rotation system becoming dominant (Keresztesi 1991). Territories in the north-eastern part of the Pannon- ian Ecoregion were annexed to the Ukrainian Soviet Social- ist Republic in 1945. Among the enormous forest asset of the Soviet Union, the floodplain forests of this area served an ecological, non-commercial function with low-intensity forest use (Nordberg 2007; Soloviy and Cubbage 2007).
Until the early 2000s, clear-cutting was permitted only in rare cases (Demeter 2016). This means that after 1945, only the Soviet system of moderately intense forest management (called sanitary selective logging; see Online Resource 1.
Appendix 1) was followed (Uuttera et al. 1996, for Finnish vs. Russian systems in Karelia), involving the removal of dead and desiccating trees at 10-yearly intervals (Demeter 2016).
Despite the growing number of studies, the effects of dif- ferent silvicultural systems (e.g. selection vs rotation sys- tems) and the abandonment of these systems on old-growth characteristics are hardly documented (Paillet et al. 2015;
Dieler et al. 2017). The general aim of this paper is to fill this research gap.
Primeval floodplain forests practically no longer exist in Europe (Sabatini et al. 2018). Therefore, natural hardwood floodplain forests are among the two most endangered forest habitat types (Schnitzler 1994; Cox and Temple 2016). The available data on the structure of old-growth stands is spo- radic and focuses on single forests (Vrška et al. 2006). How- ever, near-natural/old-growth remnant stands have survived along the great rivers and their tributaries in the Pannonian Ecoregion (Hughes et al. 2012; Sabatini et al. 2018) due to low-intensity forest management (Drescher et al. 2003;
Prots 2010; Demeter 2016) and the establishment of strict
forest reserves (Bobinac 2000; Vrška et al. 2006; Klimo et al. 2008; Horváth et al. 2012). We studied old-growth forest attributes in 16 managed and abandoned semi-natural floodplain forests located in two countries of the Pannonian Ecoregion, on the border of Central and Eastern Europe, by taking snapshot inventories of structural features.
Our objectives were:
1. to survey and document the structural characteristics of certain near-natural but altered hardwood floodplain forests in the Pannonian Ecoregion,
2. to collect quantitative data on the stand structure of old- growth forest from historical forestry literature, 3. to examine the effects of the two most typical manage-
ment systems (intensive rotation and selective sanitary cutting) on the OGCs of stand structures, and
4. to examine the effect of short-term abandonment of both systems on stand structure, old-growth characteristics and natural regeneration.
Materials and methods
Description of study area and sites
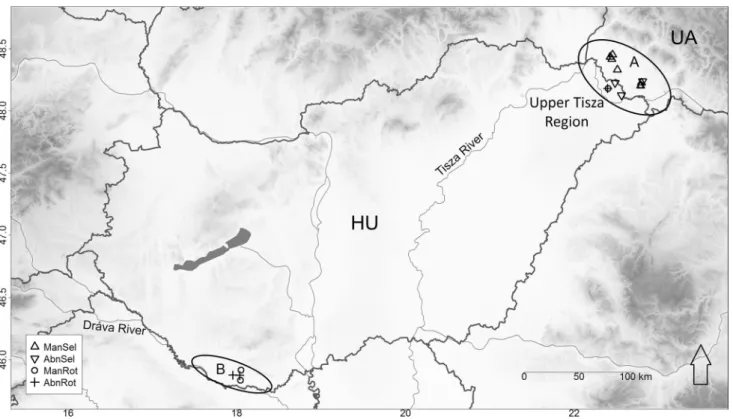
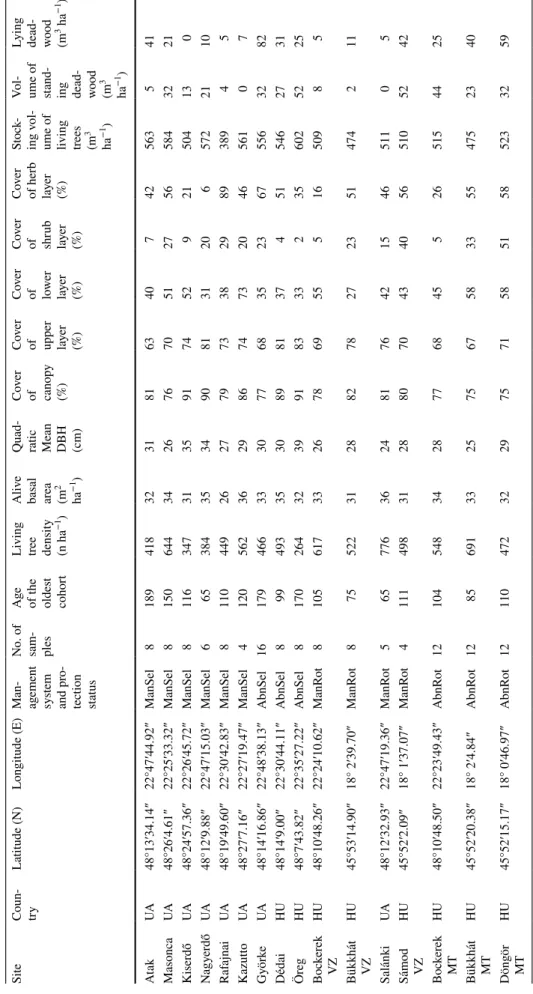
The oak-elm-ash forests we studied are located on two peripheral lowlands of the Pannonian Ecoregion (Fig. 1, Table 1). The Bereg Plain lies on the floodplain of the River Tisza at the foothills of the north-eastern Carpathians in two countries (NE Hungary and W Ukraine). The Drava Plain site belongs to the floodplain of the River Drava in South Hungary. The altitude of the studied landscapes ranges between 96 and 120 m a. s. l. The climate is temper- ate with an average annual temperature of 9.5–10.4 °C and 600–750 mm of precipitation. The soils can most often be classified as Histosols and Luvisols (FAO-UNESCO 1997) developed on recent Holocene sandy and clayey sediments on fluvial gravel.
The dominant phytosociological associations are horn- beam-pedunculate oak forests (Circaeo-Carpinetum Borhidi em. Kevey 2006) and oak-ash-elm hardwood alluvial forests (Carici brizoidis-Ulmetum Kevey 2008) (Kevey 2007). The dominant tree layer consists mainly of Quercus robur L. and Fraxinus angustifolia Vahl. with some Populus species at wetter sites at lower elevation. The most frequent tree spe- cies of the codominant layer and undercanopy are Carpinus
Fig. 1 Geographical location of study sites. A—The location of Bereg Plain; B—The location of Dráva Plain. See Table 1 for acronyms of forest management categories
Table 1 General characteristics of the studied stands ManSel selection forest, AbnSel abandoned selection forest, ManRot rotation forest, AbnRot abandoned rotation forest, DBH diameter at breast height
SiteCoun- tryLatitude (N)Longitude (E) Man- agement system and pro-
tection status No. of sam
- ples
Age of the oldest cohort
Living tree density (n ha
−1)
Alive
basal area 2 (m −1 ha)
Quad-
ratic Mean DBH (cm)
Cover
of canop
y (%)
Cover
of upper layer (%)
Cover
of lower layer (%)
Cover
of shrub layer (%)
Cover
of herb layer (%)
Stock- ing vol-
ume of living trees (m3 −1 ha)
Vol-
ume of stand
-
ing dead
-
wood (m3 −1 ha)
Lying dead
-
wood (m3
ha−1) AtakUA48°13′34.14″22°47′44.92″ManSel81894183231816340742563541 MasoncaUA48°26′4.61″22°25′33.32″ManSel8150644342676705127565843221 KiserdőUA48°24′57.36″22°26′45.72″ManSel81163473135917452921504130 NagyerdőUA48°12′9.88″22°47′15.03″ManSel66538435349081312065722110 RafajnaiUA48°19′49.60″22°30′42.83″ManSel81104492627797338298938945 KazuttoUA48°27′7.16″22°27′19.47″ManSel41205623629867473204656107 GyörkeUA48°14′16.86″22°48′38.13″AbnSel16179466333077683523675563282 DédaiHU48°14′9.00″22°30′44.11″AbnSel89949335308981374515462731 ÖregHU48°7′43.82″22°35′27.22″AbnSel817026432399183332356025225 Bockerek VZHU48°10′48.26″22°24′10.62″ManRot8105617332678695551650985
Bükkhát VZ HU45°53′14.90″18° 2′39.70″ManRot87552231288278272351474211 SalánkiUA48°12′32.93″22°47′19.36″ManRot5657763624817642154651105
Sámod VZ
HU45°52′2.09″18° 1′37.07″ManRot4111498312880704340565105242 Bockerek MTHU48°10′48.50″22°23′49.43″AbnRot1210454834287768455265154425
Bükkhát MT
HU45°52′20.38″18° 2′4.84″AbnRot1285691332575675833554752340 Döngör MTHU45°52′15.17″18° 0′46.97″AbnRot12110472322975715851585233259
betulus L., Acer campestre L. and Ulmus minor Mill. The most characteristic species in the shrub layer are Crataegus monogyna Jacq., Euonymus europaeus L. and Cornus san- guinea L.
Six sites in Ukraine are within the dykes of the tributaries of the River Tisza and experience floods two to five times a year. The duration of inundation can last from several days up to 2 months. The rest of the surveyed forests are outside dykes with a lower water table, and have not been regularly flooded for decades.
History of forest use, drivers and human impacts Until the mid-nineteenth century, most of the wood obtained from the hardwood floodplain forests of the studied land- scapes was used by locals and in neighbouring unwooded landscapes. Timber for building was selectively cut from the forests (Fekete 1890; Roth 1935). Some of the forests examined, until the 1920s, bore the structural characteristics of “primeval forests, or to be more precise, of selectively logged forests of shade-tolerant trees […] where selective logging takes place irregularly but not excessively” (Fekete 1890, Online Resource 2. Appendix 1).
The interest of the European timber market in high- quality oak timber led to intensified forest management in the mid-nineteenth century (Mahura et al. 2009). Irregular selective logging was replaced by regular selection forest management (Roth 1935). The completion of river regula- tion and the construction of the railway network facilitated intensive forestry production by the end of the nineteenth century (Fekete 1888; Elbakidze and Angelstam 2007).
Within a few decades, the majority of the oldest and most valuable stands had been depleted.
Before 1920, the studied forests were managed in accord- ance with very similar principles, as all of them belonged to the Kingdom of Hungary. After the First World War, for- est management in the studied landscapes developed in two directions. In Hungary (the Hungarian part of the Drava and Bereg Plains), the intensive rotation system spread and became dominant. The larger part of the Bereg Plain was ceded to the Soviet Union (more precisely, to the Ukrainian Soviet Socialist Republic). The forests there were managed in accordance with the less intensive methods preferred by the Soviets. The first strict forest reserve on the Ukrainian side of the plain was created 20 years ago, where the extrac- tion of any type of timber or deadwood is strictly forbidden.
Thanks to nature conservation efforts, several protected areas were established on the Hungarian side of the Bereg Plain in the 1950s, since when only sanitary selective log- ging has been permitted in these forests. In the 1990s, Hun- gary established the national Strict Forest Reserves Pro- gramme, which also covered a few former rotation forests on the Hungarian side of the Bereg Plain and on the Drava Plain
(for more information about historical uses and the flooding regime of the sites, see Online Resource 1. Table S1). All management activity was abandoned and the stands were left to develop freely in the core areas (Horváth et al. 2012;
https ://www.erdor ezerv atum.hu/en).
The majority of the studied forests belonged to private landlords or to the church until 1945, when they were all nationalised. They are still owned by the state in both countries.
Sampling design and selection of structural indicators
We surveyed 16 forests in two landscapes (Bereg and Drava Plain) (Fig. 1, Table 1).
Stand structure and species composition of the tree layer were inventoried from 2014 to 2016. We selected the old- est stands from each of the forests according to the forest management plans. In each forest, separate rectangular or linear clusters of permanent sampling plots (SPs) were established, measuring 50 by 50 m, containing 4, 6, 8, 12 or 16 circle-shaped SPs, and representing 1–4 hectares of typical old stands. The location of the clusters of SPs was selected based on the following three a priori criteria: (i) one cluster should be located within one compartment of the forest, which should have a homogeneous management his- tory; (ii) the stand should be large enough to accommodate at least 4 SPs, so that the boundary of the compartment is at least 50 m away from the edge of the closest SPs; (iii) the stand should have a homogeneous canopy structure (based on current Google Earth satellite images). Photographs of the stands of the four management categories (see below) are provided in Online Resource 1 (Fig. S1).
Actively managed and abandoned stands were sampled in two management types, forming four different a priori cat- egories: selection (ManSel), rotation (ManRot), abandoned selection (AbnSel), and abandoned rotation forests (Abn- Rot). In the ManSel category, we surveyed six Ukrainian forests. In the AbnSel category, we included one forest in Ukraine and two forests in Hungary, abandoned 20–25 years ago. Among ManRot forests, we examined four old (on aver- age 88.36 years old) stands of commercially managed forests in Hungary and one in Ukraine. In the AbnRot category, we surveyed three forests in Hungary where there has been a complete absence of cutting or any other usage of wood or timber for 25 years. For detailed descriptions of the man- agement categories see Online Resource 1. Appendix 1.
From the SPs surveyed in the four categories, we considered separately the SPs containing small-diameter oak ingrowth (YoungOak; Q. robur trees between 5 and 20 cm DBH) that had grown successfully to become part of the stand struc- ture. These SPs constitute part of the original group and part of the subset.
We selected indicators of old-growth status by including those reported to be the most important ones for forest biodi- versity (Nilsson et al. 2002; Bauhus et al. 2009; Burrascano et al. 2013; Ziaco et al. 2012). We analysed a total of 26 OGCs in three indicator groups: 15 live tree structural indi- cators (LTSIs), 9 dead tree structural indicators (DTSIs), and 2 gap-related structural indicators (GRSIs) (Table 2). We selected indicators expected to have a relationship between the silviculture systems under investigation and abandon- ment. For example, GRSIs and density of thinners (stems 5–20 cm DBH) were expected to be higher in selection forests due to the creation of gaps by selective logging of mature trees, aiming to enhance the establishment of natural regeneration. The mixture ratio of different tree species and the amount of large trees were expected to be influenced by positive selection in favour of Q. robur in rotation systems, while DTSIs and the amount of large trees were expected to be influenced by abandonment.
Measurement of stand structure and tree composition
There were three modules of data acquisition:
1. General description of forest stand, stand canopy clo- sure, percentage cover of lower and upper canopies, percentage cover of shrub and regeneration layer. The height of the canopy was estimated by measuring and averaging the height of several dominant trees (1.4 trees on average per SPs). Canopy gap categories were noted as no gap (L0), single gap (L1—cca 10% coverage of gaps), double/triple gap (L23—cca 25%) or larger gap (LX—min 50%). Coverage of canopy gaps was noted by visual estimation.
2. Living and standing dead trees, shrubs and standing broken trees (hereafter stumps) were identified and recorded with a diameter at breast height (DBH) ≥ 5 cm at all SPs with a combination of circular plot sampling (radius = 8.92 m, area = 250 m2, tree factor = 40, from 5 to 25.2 cm DBH) for the smallest trees and horizontal point (angle-count) sampling with a basal area factor k = 2 at DBH ≥ 25.2 cm for the largest trees (Bitterlich 1952; Horváth et al. 2012) in order to estimate the local stand parameters as stock density (N) and basal area (G). We applied the regional tree volumetric function depending on DBH and tree height (Király 1978), in order to calculate stock volume (V). The height (H) of all trees not measured was estimated by interpolation based on logarithmic function: H=A∗ln(DBH) +B , where A and B are local parameters. The mixture ratios of tree species and of different DBH classes were cal- culated according to basal area. The age of stands was
determined from the forest management plans for all management categories.
3. Lying dead wood (or coarse woody debris—CWD) was estimated using the line intercept sampling method (Warren and Olsen 1964; Ståhl et al. 2001). We estab- lished three sampling lines (each 20 m in length) radi- ating from the centre of the SP in the directions of 0 (North), 120 and 240 degrees. Each interception of the sampling line and any lying dead wood (width ≥ 5 cm, longer than 0.5 m) was recorded and evaluated to esti- mate the CWD volume density.
Data analysis
The 26 indicators in the initial set were tested for pairwise Pearson correlations, and highly correlated variables were removed. The following variables showed high correlation:
OAKs versus NGT80, Nliv versus N5–20, Vliv versus NGT80, Vsnag versus Vdead and DeadtoLive, Vstump versus Gstump, Vdead versus Vcwd (for the abbreviations see Table 2). NGT80 was preferred over OAKs and Vlive, because it was more directly measurable and had a stronger link to forest biodi- versity. We retained N5–20, because it was a better indica- tor of natural regeneration dynamics. DeadtoLive was kept because the amount of standing dead trees was represented by Gsnag and Nsnag, which had low correlation to the other variables. Similarly, Gstump was preferred over Vstump. Finally, between Vdead and Vcwd, we selected Vcwd because it was a component of Vdead and more directly measur- able. Principal component analysis (PCA) was performed on the 20 old-growth indicators that were retained. The results were visualised using centring, half-change scaling and rotation to the axes of PCA. PCA was used also for calculating the significance of the 20 variables by 1000 per- mutations. Non-metric Multidimensional Scaling (NMDS) was selected to study whether the 126 sampling plots are separated according to their management history (i.e., four management categories) in the two-dimensional ordination space of the 20 retained stand structure variables, using the Bray–Curtis dissimilarity measure (Bray and Curtis 1957).
To achieve convergence to a non-local optimum, several (maximum 100) NMDSs were run from random starts. Prior to the ordinations, the 20 variables of different scales were rescaled (divided by their root mean square) to preclude under-/over-representation.
Multiple comparisons of the four site subsets to each other were made by means of Tukey (Tukey’s HSD; Tukey 1949) for all 26 variables to examine the management effect.
The significance level (α) was set to 0.05. Generalised linear multivariate (GLM) analysis was applied in order to deter- mine the influence of management approaches, flooding
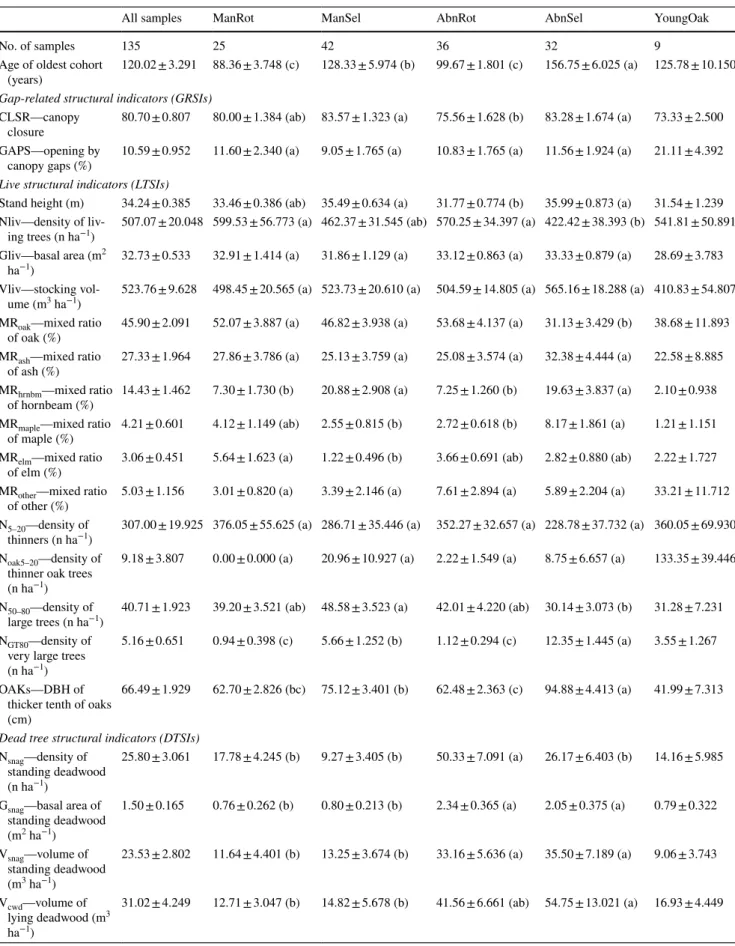
Table 2 Old-growth structural indicators (mean and standard error) and pairwise comparison of the studied hardwood floodplain forest groups with different management history
All samples ManRot ManSel AbnRot AbnSel YoungOak
No. of samples 135 25 42 36 32 9
Age of oldest cohort
(years) 120.02 ± 3.291 88.36 ± 3.748 (c) 128.33 ± 5.974 (b) 99.67 ± 1.801 (c) 156.75 ± 6.025 (a) 125.78 ± 10.150 Gap-related structural indicators (GRSIs)
CLSR—canopy
closure 80.70 ± 0.807 80.00 ± 1.384 (ab) 83.57 ± 1.323 (a) 75.56 ± 1.628 (b) 83.28 ± 1.674 (a) 73.33 ± 2.500 GAPS—opening by
canopy gaps (%) 10.59 ± 0.952 11.60 ± 2.340 (a) 9.05 ± 1.765 (a) 10.83 ± 1.765 (a) 11.56 ± 1.924 (a) 21.11 ± 4.392 Live structural indicators (LTSIs)
Stand height (m) 34.24 ± 0.385 33.46 ± 0.386 (ab) 35.49 ± 0.634 (a) 31.77 ± 0.774 (b) 35.99 ± 0.873 (a) 31.54 ± 1.239 Nliv—density of liv-
ing trees (n ha−1) 507.07 ± 20.048 599.53 ± 56.773 (a) 462.37 ± 31.545 (ab) 570.25 ± 34.397 (a) 422.42 ± 38.393 (b) 541.81 ± 50.891 Gliv—basal area (m2
ha−1) 32.73 ± 0.533 32.91 ± 1.414 (a) 31.86 ± 1.129 (a) 33.12 ± 0.863 (a) 33.33 ± 0.879 (a) 28.69 ± 3.783 Vliv—stocking vol-
ume (m3 ha−1) 523.76 ± 9.628 498.45 ± 20.565 (a) 523.73 ± 20.610 (a) 504.59 ± 14.805 (a) 565.16 ± 18.288 (a) 410.83 ± 54.807 MRoak—mixed ratio
of oak (%) 45.90 ± 2.091 52.07 ± 3.887 (a) 46.82 ± 3.938 (a) 53.68 ± 4.137 (a) 31.13 ± 3.429 (b) 38.68 ± 11.893 MRash—mixed ratio
of ash (%) 27.33 ± 1.964 27.86 ± 3.786 (a) 25.13 ± 3.759 (a) 25.08 ± 3.574 (a) 32.38 ± 4.444 (a) 22.58 ± 8.885 MRhrnbm—mixed ratio
of hornbeam (%) 14.43 ± 1.462 7.30 ± 1.730 (b) 20.88 ± 2.908 (a) 7.25 ± 1.260 (b) 19.63 ± 3.837 (a) 2.10 ± 0.938 MRmaple—mixed ratio
of maple (%) 4.21 ± 0.601 4.12 ± 1.149 (ab) 2.55 ± 0.815 (b) 2.72 ± 0.618 (b) 8.17 ± 1.861 (a) 1.21 ± 1.151 MRelm—mixed ratio
of elm (%) 3.06 ± 0.451 5.64 ± 1.623 (a) 1.22 ± 0.496 (b) 3.66 ± 0.691 (ab) 2.82 ± 0.880 (ab) 2.22 ± 1.727 MRother—mixed ratio
of other (%) 5.03 ± 1.156 3.01 ± 0.820 (a) 3.39 ± 2.146 (a) 7.61 ± 2.894 (a) 5.89 ± 2.204 (a) 33.21 ± 11.712 N5–20—density of
thinners (n ha−1) 307.00 ± 19.925 376.05 ± 55.625 (a) 286.71 ± 35.446 (a) 352.27 ± 32.657 (a) 228.78 ± 37.732 (a) 360.05 ± 69.930 Noak5–20—density of
thinner oak trees (n ha−1)
9.18 ± 3.807 0.00 ± 0.000 (a) 20.96 ± 10.927 (a) 2.22 ± 1.549 (a) 8.75 ± 6.657 (a) 133.35 ± 39.446
N50–80—density of
large trees (n ha−1) 40.71 ± 1.923 39.20 ± 3.521 (ab) 48.58 ± 3.523 (a) 42.01 ± 4.220 (ab) 30.14 ± 3.073 (b) 31.28 ± 7.231 NGT80—density of
very large trees (n ha−1)
5.16 ± 0.651 0.94 ± 0.398 (c) 5.66 ± 1.252 (b) 1.12 ± 0.294 (c) 12.35 ± 1.445 (a) 3.55 ± 1.267
OAKs—DBH of thicker tenth of oaks (cm)
66.49 ± 1.929 62.70 ± 2.826 (bc) 75.12 ± 3.401 (b) 62.48 ± 2.363 (c) 94.88 ± 4.413 (a) 41.99 ± 7.313
Dead tree structural indicators (DTSIs) Nsnag—density of
standing deadwood (n ha−1)
25.80 ± 3.061 17.78 ± 4.245 (b) 9.27 ± 3.405 (b) 50.33 ± 7.091 (a) 26.17 ± 6.403 (b) 14.16 ± 5.985
Gsnag—basal area of standing deadwood (m2 ha−1)
1.50 ± 0.165 0.76 ± 0.262 (b) 0.80 ± 0.213 (b) 2.34 ± 0.365 (a) 2.05 ± 0.375 (a) 0.79 ± 0.322
Vsnag—volume of standing deadwood (m3 ha−1)
23.53 ± 2.802 11.64 ± 4.401 (b) 13.25 ± 3.674 (b) 33.16 ± 5.636 (a) 35.50 ± 7.189 (a) 9.06 ± 3.743
Vcwd—volume of lying deadwood (m3 ha−1)
31.02 ± 4.249 12.71 ± 3.047 (b) 14.82 ± 5.678 (b) 41.56 ± 6.661 (ab) 54.75 ± 13.021 (a) 16.93 ± 4.449
regime and the age of stands on the 26 OGC variables. See Online Resource 3. Appendix 1. for more methodological details.
The diameter distribution of living trees was studied with regression for the five site subsets (the four management subsets plus the YoungOak subset) and separately for the entire database. All the studied species were aggregated and the mean prevalence (trees/ha) was calculated for all DBH classes (at 5 cm intervals).
The self-thinning rule-based power function model (stem density = ax−2, where x: DBH class, and a: density of DBH1cm) was selected as the theoretical reference for comparison of DBH-class distributions. According to Shi- mano (2000), this clearly represents the patch-mosaic struc- ture of natural deciduous broad-leaved forests, although the negative exponential function (Meyer 1952) or the rotated sigmoid distribution curve (Westphal et al. 2006) are also good alternatives. Both prevalence and the mean diameter of the diameter classes were log-transformed with base 10, and the linear model was fitted to the log–log data with the slope fixed at − 2. The intercept and coefficient of determination (R2) were recorded.
Analyses of stand structure and species composition data were conducted in R statistical software (R Core Team 2017), using the packages ‘vegan’ (Oksanen et al. 2016) for ordination, ‘agricolae’ (de Mendiburu 2016) for Tukey’s HSD test, ‘tidyr’ (Wickham 2017) for data transformation, and ‘ggplot2’ (Wickham 2009) for graphic display.
Collecting historical data on stand structure
Primeval floodplain forests practically no longer exist in Europe (Sabatini et al. 2018) and the published reference data describe stands that are likely to have been significantly altered. Hence, historical data may provide important refer- ences for contextualising our data. A total of 130 historical papers were collected from the archive of the Hungarian Forestry Bulletin (http://epa.niif.hu/01100 /01192 ), checking all volumes from 1862 to 1920. The papers were thoroughly read by the first author. Nine of them contained quantita- tive data on stand structure from the Carpathian Basin and before the period of river regulations. These data are shown in the Online Resource. Table S1 and Online Resource 2.
Appendix 1.
Results
Structure and composition of near‑natural hardwood floodplain forests
The studied stands are on average 120 years old. The average density of live trees (DBH ≥ 5 cm) fluctuated between 422 and 599 trees ha−1. The number of large trees (N50–80) and very large trees (NGT80) per hectare, including all species, was on average 40.71 ± 1.92 and 5.16 ± 0.65, respectively.
The horizontal structure of these forests had high over- lap and robust dominance of high and more or less closed upper layer with fine-scale small canopy gaps (Table 1).
The total amount of deadwood (Vdead) was on average
Table 2 (continued)
All samples ManRot ManSel AbnRot AbnSel YoungOak
Nstump—density of stump deadwood (n ha−1)
7.59 ± 1.580 4.80 ± 2.654 (a) 4.00 ± 1.681 (a) 12.26 ± 4.679 (a) 9.23 ± 2.635 (a) 23.72 ± 14.148
Gstump—basal area of stump deadwood (m2 ha−1)
0.51 ± 0.098 0.04 ± 0.026 (b) 0.40 ± 0.169 (ab) 0.62 ± 0.214 (ab) 0.93 ± 0.234 (a) 2.03 ± 0.836
Vstump—volume of stump deadwood (m3 ha−1)
0.84 ± 0.171 0.05 ± 0.027 (b) 0.51 ± 0.257 (ab) 1.20 ± 0.403 (ab) 1.51 ± 0.416 (a) 2.37 ± 1.114
Vdead—total volume of deadwood (m3 ha−1)
55.40 ± 5.064 24.40 ± 6.986 (b) 28.58 ± 6.722 (b) 75.92 ± 7.893 (a) 91.77 ± 12.961 (a) 28.35 ± 6.129
DeadToLive—Dead- to-living wood ratio (%)
11.05 ± 1.126 4.94 ± 1.408 (b) 5.50 ± 1.165 (b) 15.76 ± 1.830 (a) 17.82 ± 3.285 (a) 7.16 ± 1.367
Abbreviations: YoungOak—subset of samples with small-diameter oak ingrowth; All samples—all samples measured. See the capture of Table 1 for acronyms of management categories. Groups that share no common letter differ significantly (α = 0.05) from each other according to the studied OGC based on Tukey’s HSD
55.40 ± 5.064 m3 ha−1 (Table 2), but there were large dif- ferences among the individual stands (from 24.40 ± 6.99 to 91.77 ± 12.96 see Table 1 for more details about different forest sites).
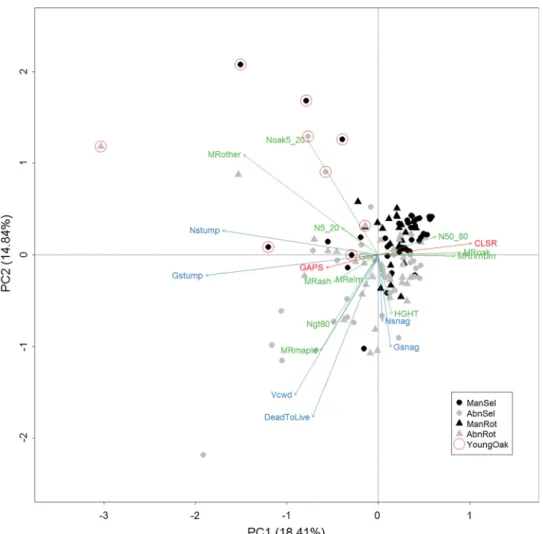
The multivariate analysis revealed that the majority of SPs were actually arranged along a diagonal gradient from top right to bottom left on the PCA plot. (Fig. 2). This gradi- ent represents closed-canopy managed stands, dominated by large trees (N50_80) (mainly oaks) and hornbeam with less deadwood at the upper right section, and abandoned older stands with more gaps (GAPS), very large trees (NGT80) and a higher amount of different kinds of deadwood in the bottom-left quarter. A small number of SPs were located outside this gradient, and bore a close correlation with the density of small-diameter ingrowth (Noak5_20, N5_20), non- dominant tree species (MRother) and stumps (Nstump).
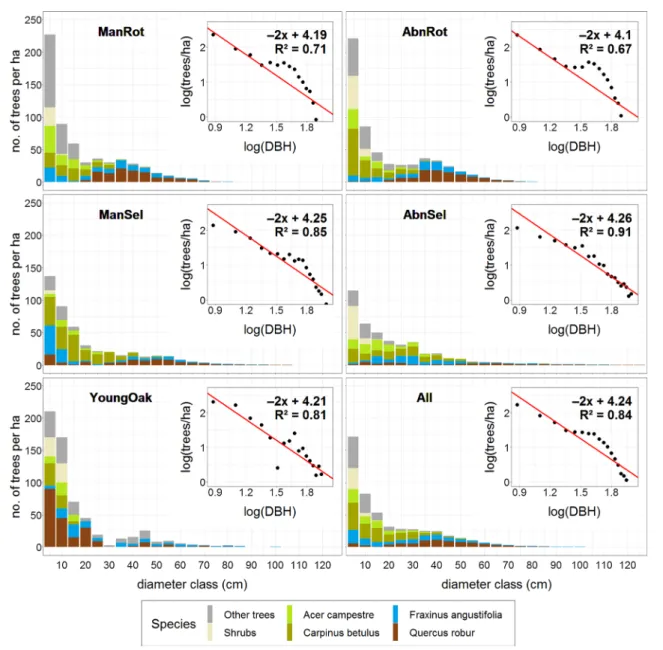
The diameter classes of all woody stems of the tree layer (DBH ≥ 5 cm) showed a rotated sigmoid curve, with a smooth bump between 25 and 55 cm (All sam- ples in Fig. 3). Both sides of the distribution deviated
from the value indicated by the negative power function model. However, the goodness of fit of the model was high (R2 = 0.84). Both the thinnest and thickest diameter classes had a lower density than predicted by the model.
In every studied group, small-diameter ingrowth (of every species) was present at a lower density (307 tree ha−1 on average) than the value predicted by the model (Fig. 3).
The diameter distribution of Quercus robur exhibited a very broad and low normal distribution with almost no recent regeneration, while the Fraxinus angustifolia popu- lation showed bimodality: large trees in a vast range and few trees in the small-diameter categories. In the regen- eration layer, there was a predominance of shade-tolerant and flood-intolerant species (Acer campestre and Carpinus betulus) (Fig. 3).
Regeneration of Quercus robur was found in only nine of the 135 SPs (in 5, 2 and 2 SPs of the selection, aban- doned selection and abandoned rotation groups, respec- tively) (Fig. 3).
Records containing small-diameter oak ingrowth were located outside the point cloud, showing a strong positive correlation with the quantities both of non-dominant tree
Fig. 2 PCA ordination of indi- vidual samples and stand struc- ture variables. Dot and triangle symbols indicate selection and rotation forests, respectively.
The colour grey shows aban- donment, while dots with red circles indicate sampling plots regenerating with Q. robur.
Variables with green, blue and red colours indicate LTSIs, DTSIs, and GTSIs, respectively.
See Table 2 for acronyms of variables. (Color figure online)
species (MRother) and of stumps (Nstump, Gstump) (Figs. 2, 4).
Effects of management and abandonment on old‑growth characteristics
The four historical groups studied were widely scattered on the NMDS ordination plot, indicating great variation (Fig. 4). The SP cloud of the two managed groups almost completely overlapped. The SPs in the selection stands were scattered more than those in the rotation stands. The SPs of the abandoned and the managed stands were dif- fusely separated from each other. The SPs of the ManRot
and the AbnSel stands were the most markedly separated.
SPs containing small-diameter oak ingrowth fell outside the grouping ordination ellipse of all of the studied groups.
The quantity of very large trees (NGT80) per hectare was significantly higher in ManSel and AbnSel stands than in their rotation counterparts (Table 1). OAKs was significantly higher only in AbnSel. However, generalised linear models revealed that stand age has by far the highest explanation power for the variables NGT80 and OAKs, while the flooding regime has lower explanation power (Online Resource 3.
Table S1). The ratio of basal area of Quercus robur (MRoak) and the density of living trees (Nliv) was significantly lower in AbnSel than in AbnRot. Small-diameter oak ingrowth
Fig. 3 Diameter distribution of studied management categories with the fitted negative power function model. The YoungOak subset con- sists of 9 samples only. A dot represents the average density of trees
(trees ha−1) in a DBH class (at 5 cm intervals from 5 to 125 cm).
Trees with DBH ≥ 100 cm and empty diameter classes (with 0 preva- lence) were excluded from the analysis. (Color figure online)
(Noak5–20) per hectare was markedly higher in ManSel stands than in ManRot stands (5 times higher), but the result was not significant.
The ratio of basal area of hornbeam was significantly higher in both the selection groups than in the rotation stands (Table 2). However, the flooding regime was also a deter- mining factor (Online Resource 3. Table S1). Whereas there were five significant differences in the OGCs between the AbnRot stands and their managed counterparts (only DTSIs:
Nsnag, Gsnag, Vsnag, Vdead, DeadToLive), in the case of aban- doned and managed selection stands, there were ten (five LTSIs and five DTSIs). The greatest number of significant differences in OGCs, 13 in total, were between the AbnSel group and the ManRot group (Table 2). With regard to dead- wood (e.g. DeadToLive, Vdead), the decisive explanatory variable was abandonment (Online Resource 3. Table S1).
The effects exerted by management on diameter distri- bution are quite obvious. The empirical diameter distribu- tions for every group were greatly similar to the rotated sig- moid curve. However, the rotation and abandoned rotation groups exhibited stronger kurtosis among diameter classes between 25 and 55 cm. On the other hand, the distribu- tion of selection and abandoned selection stands fitted the
reference model more closely and with lower kurtosis than their rotation counterparts (Fig. 3). The regenerating group with small-diameter oak ingrowth showed the best visual fit (R2 = 0.81) to the slope of the theoretical power function model, although the highest R2 value was found in the diam- eter distribution of the abandoned selection group (R2 = 0.91;
Fig. 3).
Discussion
Old‑growthness in hardwood floodplain forests All the studied forests are mainly in the early and late bio- static phases of forest development (see Emborg et al. 2000 for patch mosaics of developmental phases), as confirmed by the OGCs and diameter distribution data. The majority of SPs were characterised by closed stand structures consisting mostly of Q. robur with a DBH in the range of 50-80 cm and mature C. betulus, and small amounts of deadwood (Fig. 2).
The reasonably good fit of the compound diameter distribu- tion (All samples in Fig. 3) to the negative power function model (R2 = 0.85) also indicated a semi-natural (ageing)
Fig. 4 Two-dimensional NMDS ordination plot of stand structure samples with different forest management histories.
See the capture of Table 1 for acronyms of the management categories. YoungOak—stands with small-diameter oak ingrowth. Grouping ordina- tion ellipses were drawn based on standard deviation of point scores, where the directions of the major axis of the ellipse were defined by the weighted correlation. Solid line—rotation stands; dashed line—selection stands
structure. However, the under-representation of the smaller (5–20 cm DBH) and the largest (> 80 cm DBH) diameter classes may also indicate a low proportion of innovation and degradation phases. About a quarter of the SPs repre- sented more open stands containing more tree species, more very large trees and deadwood, and younger patches (Fig. 2).
This kind of structure may be a sign of a shift taking place from the late biostatic towards the degradation phase. Firstly, these SPs were from the oldest abandoned stands of our sample. Secondly, the high amounts of very large trees and deadwood, together with the presence of naturally regener- ating patches, are all typical attributes of the degradation phase in old-growth forests (Vrška et al. 2006; Vandekerk- hove et al. 2009, Online Resource 1. Table S1). On the other hand, canopy openness and the ratio of light-demanding and shade-tolerant species in natural stands remain in question.
In the case of hardwood floodplain forests, the progression of shade-tolerant (flood-intolerant) species seems to be the result of the elimination of floods (Trémolières et al. 1998;
Cestaric et al. 2017).
The main reason for the absence of the degradation and innovation phases and the overdominance of the early bio- static phase is the fact that the tree species in the domi- nant layer are in the middle of their potential lifespan (see Table 2 for stand age). According to data from two Czech floodplain forest reserves (Vrška et al. 2006) and historical sources (Online Resource 1. Table S1), trees in old-growth stands have the potential to reach an age of 350–400 years.
Furthermore, all of the rotation stands and some of the selec- tion stands have homogeneous age structures owing to their clear-cut origins. The stands still had sufficient vitality for the canopy to fill in the gaps through lateral growth (Emborg et al. 2000). This vitality prevents the disintegration of the upper canopy layer and the emergence of patches where there is dense regeneration. The main driver of forest devel- opment was density-related natural mortality. According to Emborg et al. (2000), the early and late biostatic phases in a temperate deciduous forest (incl. Q. robur and F. excelsior) may last as long as 200 years. Stands do not enter the deg- radation phase until they reach an age of around 270 years.
The historical literature of these forests, however, points to the possibility of developmental cycles of longer duration (Online Resource 1. Table S1).
The number and size of very large trees are important indicators of old-growth structure from the perspective of nature conservation (Mölder et al. 2019). Despite this, little is known about the density and dimension of old trees in a natural, hardwood floodplain forest (Bobinac 2000; Janik et al. 2008, 2011). In our study, the thickest tree (135 cm DBH) was found in a stand of 179 years of age, which is a former selection forest that was abandoned 20 years ago. In this stand, the number of very large trees (> 80 cm DBH) per
hectare fluctuated between 9 and 32 trees ha−1 (on average 16 trees ha−1).
The historical forestry literature suggests that in a 300-year-old oak floodplain forest (Slavonian region, Serbia), there could be up to 40–60 trees ha−1 with DBH ≥ 80 cm (mainly Q. robur) (Table 2). The thickest individuals sometimes exceeded a DBH of 200 cm (Online Resource 1. Table S1). According to the recent literature, Q. robur has the potential to reach a DBH of 200–260 cm, and there can be up to 17–25 very large trees ha−1 (Bobinac 2000; Vrška et al. 2006; Mikac et al. 2018). Taking into consideration both the historical and the recent reference literature on the number and density of very large trees, it is possible to conclude that even the oldest oak forest we studied (180 years) cannot be regarded as a true old-growth forest, given the number of very large trees.
Another important question for restoration ecology is the amount of time needed for the number and size of very large trees to recover in a stand after the abandonment of tim- ber extraction (Mölder et al. 2019). Under favourable con- ditions, the annual radial growth of mature Q. robur may vary between 1.4 and 6.4 mm (Lévy et al. 1992; Nechita and Popa 2012). We may conclude that even the oldest, regularly flooded stocks we examined would need at least 100–150 years for the species in the upper layer to reach their potential DBH sizes (200–260 cm DBH). Recovery of the number of very large trees might be achievable in less time. Since natural mortality is low in the early biostatic phase, it is possible that individuals with a DBH between 50 and 80 cm (on average 30 tree/ha in AbnSel) could grow to their thickest DBH categories within 25–75 years.
Oak regeneration failure and rise of shade‑tolerant species
All of the examined groups had a much lower amount of small-diameter Quercus robur and Fraxinus angustifolia ingrowth than predicted by the fitted model (Fig. 3). No sig- nificant effect was exerted by the type of management nor by its abandonment. Our results support the view (Bobinac 2000; Janik et al. 2008; Ortmann-Ajkai et al. 2017) that the pedunculate oak is hardly able to regenerate beneath its own closed canopy during the early and late biostatic develop- mental phases. Small-diameter oak ingrowth was found in just nine of the 135 SPs (Figs. 2, 4). The nine SPs in ques- tion were characterised by the presence of a gapped canopy, stumps and pioneer tree species, and a low number of mother trees per hectare. The reasons for the weak natural regenera- tion of oak remain difficult to specify.
By contrast, there was good regeneration of shade-toler- ant and flood-intolerant tree species (Carpinus betulus, Acer campestre), which have successfully colonised habitats that have dried out in the wake of river regulation (Trémolières
et al. 1998; Cestaric et al. 2017; Janik et al. 2011). The dry- ing might create a trade-off for nature conservation. As the stands lose their vitality, they become more susceptible to disturbances. Desiccating and falling trees result in a pro- liferation of deadwood and gaps. As a result, the ratio of degradation phases increases, which is beneficial from the perspective of nature conservation. At the same time, the gaps are filled in by numerous flood-intolerant species (e.g.
Carpinus betulus, Acer campestre), thus suppressing the regeneration of Quercus robur (Janik et al. 2011). The only species that is capable of competing with flood-intolerants is Fraxinus angustifolia, which requires less light and grows rapidly. The process may lead to a forest structure of shifting tree composition.
Effects of management approach and abandonment on old‑growth characteristics
The management regime itself had a moderate impact on OGCs in semi-natural forests. Old selection forests differed slightly from old rotation forests. This is unsurprising, as the measurements were taken in the oldest and most natural forests in both management categories. The effect of stand age and abandonment was greater, and AbnSel forests recov- ered some of their OGCs more rapidly than AbnRot forests.
The variance in the structure of commercially ManSel stands was greater, and incorporated the variance of Man- Rot, so for this reason, the two groups were not significantly different from one another (Fig. 4). The difference in struc- ture between the AbnSel stands and the AbnRot stands was more pronounced (8 LTSIs and 1 DTSIs) than in their still managed counterparts (3 LTSIs) (Table 2, Fig. 4).
The higher density of very large trees (NGT80, OAKs) in both selection stands was strongly correlated both to the age of the stand and to the flooding regime. The ManSel and AbnSel stands were significantly older, and a few of them were regularly flooded. In these oak forests, which serve soil and water protection purposes, the pre-established age of final felling is high (up to 170 years) (Online Resource 1.
Appendix 1). The objective of the sanitary selective logging carried out in Ukraine is to maintain the vitality of the stand (Sanitary Rules in the Forest of Ukraine 1995). As long as the stand is healthy, only sanitary selective logging is per- mitted. This means that only individuals that have died or are beginning to dry out are felled (Demeter 2016), regardless of tree species or size.
Interestingly, the mixture ratio of hornbeam is signifi- cantly higher in both the AbnSel and ManSel groups than in their rotation counterparts. This structural variable was also strongly determined by the flooding regime (Online Resource 3. Table S1). Decades-long selection of large dying-out trees creates gaps in the canopy. When the habitat
dries out due to river regulation and gaps are created by selective logging, this seems to lead to the gradual invasion of this fast-growing native tree species. This may call into question the long-term sustainability of the sanitary selec- tion system.
Small-diameter oak ingrowth per hectare was higher in ManSel (Table 2), although no significant difference was exhibited due to the high standard deviation. The signifi- cantly higher MRelm in the ManRot and CLSR and HGHT in AbnRot forests could not be explained by their differing management histories.
The diameter distributions of different management cat- egories differed slightly from each other. The ManRot and AbnRot categories had stronger kurtosis among diameter classes between 25 and 55 cm and a weaker fit to the refer- ence model compared to selection stands. The over-repre- sentation of medium-diameter classes, coupled with a low R2 value, is a characteristic typical of the diameter distribution of intensively disturbed, even-aged forests (Johnson and Bell 1975; Robertson et al. 1978). The highest R2 value was found in the diameter distribution of the abandoned selection group (R2 = 0.91; Fig. 3). In the old-growth hardwood floodplain forests of North America (Robertson et al. 1978), the coef- ficient of correlation is very similar (R2 = 0.90). Diameter classes that were exposed to lower levels of anthropogenic disturbance (e.g. thinning) in the past have a proportion- ally higher R2 value produced by the fitted model (Shimano 2000; Aldrich et al. 2005). That is, the lower the disturbance, the higher the R2 value, and therefore the closer the similar- ity to the diameter distribution typically found in natural forests. Our results suggest that the structure of the AbnSel stands was the closest to the structure typical of natural for- ests (Fig. 3; Shimano 2000; Emborg et al. 2000; Westphal et al. 2006; Král et al. 2014). This is unsurprising, as the trees that were removed during sanitary selective cutting were those that were already dead. There is a high chance that these trees would have fallen due to natural disturbance, driving gap dynamics.
Both types of abandoned forest had structures that dif- fered from their still managed counterparts (Fig. 4) How- ever, the AbnRot forests had significantly higher values only for five DTSIs (Table 2) compared to ManRot. Paillet et al.
(2015) showed that the total volume of deadwood and the volume of standing deadwood were OGCs that recovered relatively quickly after abandonment of intensive manage- ment practices in lowland forests. In our case, the brief period of time that has elapsed since abandonment of inten- sive rotation forests did not result in significant differences in the number of very large trees and lying deadwood, but did result in significantly higher amounts of standing deadwood and total volume of deadwood.
A greater number of significant differences in OGCs, ten in total, were found between the ManSel group and the
AbnSel group (Table 2.), e.g. for standing and lying dead- wood and for large trees. Following abandonment of selec- tion practices, the growing thickness of medium-sized trees led to a significant increase in the number of large trees, which is in line with the results of Paillet et al. (2015).
There are various possible causes for the significant dif- ferences in the deadwood variables: (i) since abandonment, it has been forbidden to remove deadwood from AbnSel forests. (ii) In Ukraine, it was compulsory for local forestry enterprises to remove deadwood from commercially man- aged forests, in accordance with forestry regulations (Sani- tary Rules in the Forest of Ukraine 1995). (iii) Larger trees were found in sanitary selection forests (Table 2, Fig. 3), and their dying substantially increased the volume of deadwood.
In all groups, the total volume of deadwood and the vol- ume of lying deadwood was considerably below the values in moist temperate old-growth forests (Burrascano et al.
2013; Vandekerkhove et al. 2009). AbnSel stands contained the most deadwood (91.77 ± 12.961). This value is close to the amount measured elsewhere in the abandoned near-nat- ural forests of the Pannonian Ecoregion (Janik et al. 2008;
Vandekerkhove et al. 2009).
In order to deal with the shortage of wood, it seems that forest management in Hungary preferred the predictable intensive rotation system (Keresztesi 1991). This management approach results in lower structural heterogeneity within the stand, fewer large trees, and a less natural diameter distribu- tion in hardwood floodplain forests. Moreover, OGCs are slow to develop, and hardly noticeable after just 20–25 years of abandonment. On the other hand, the less intensive system of sanitary selective logging succeeded in preserving several old-growth structural features. After abandonment, it seems that the process by which OGCs are restored occurs at the fastest rate in the case of selection forests.
Implications for forest management and conservation
Based on the differing histories of the studied forests and the differences in the present-day forest structure, a vari- ety of management and conservation approaches can be recommended:
• Due to a lack of flooding and low water table, the struc- ture and composition of many hardwood floodplain for- ests are changing (Mikac et al. 2018). Rehabilitation of a more natural water regime would be a key factor in guar- anteeing the future of these forests at landscape level.
However, biological invasion facilitated by flooding is a growing threat.
• Rotation management resulted in the least advantageous stand structures from the perspective of nature conserva- tion. Substantial improvements to nature conservation
could be achieved by raising the rotation age in such for- ests from 80–100 to 150 years, which would increase the proportion of semi-natural forests in the landscape that contain large trees. On the other hand, simply raising the felling age would, on its own, contribute little to other conservation goals (Percel et al. 2018).
• Another solution would be to apply multifunctional for- estry in commercial lowland oak forests, by establishing a combined management approach utilising long rotation forestry and selective systems. With oak as the dominant tree species, rotations of 150 years or more would also be economically viable. After the last commercial thin- ning, only selective logging should be carried out until the final felling. However, selective management in the last phases of stand development could be problematic in terms of achieving the proper conditions for successful natural regeneration of oak.
• The sanitary selective logging system succeeded in pre- serving several old-growth structural features. Aban- doning commercial management and leaving all the deadwood in situ in certain well-preserved, non-invaded stands would provide the most important measure for enhancing biodiversity.
• Our results show that, after 100–150 years of active, homogenising management, OGCs are slow to develop in just 25 years of non-intervention (see also Bauhus et al.
2009; Paillet et al. 2015). Therefore, if the objective is to increase the complexity of the stand structure, active conservation management needs to offer an alternative solution to simple abandonment in even-aged stands (e.g. structural complexity enhancement; Keeton 2006;
Bauhus et al. 2009).
Acknowledgements Open access funding provided by Centre for Eco- logical Research. The project was partly supported by the Hungarian national Strict Forest Reserves Programme and by the GINOP-2.3.2- 15-2016-00019 Grant.
Compliance with ethical standards
Conflict of interest The authors declare that they have no conflict of interest.
Open Access This article is licensed under a Creative Commons Attri- bution 4.0 International License, which permits use, sharing, adapta- tion, distribution and reproduction in any medium or format, as long as you give appropriate credit to the original author(s) and the source, provide a link to the Creative Commons licence, and indicate if changes were made. The images or other third party material in this article are included in the article’s Creative Commons licence, unless indicated otherwise in a credit line to the material. If material is not included in the article’s Creative Commons licence and your intended use is not permitted by statutory regulation or exceeds the permitted use, you will need to obtain permission directly from the copyright holder. To view a copy of this licence, visit http://creat iveco mmons .org/licen ses/by/4.0/.