Animal welfare, etológia és tartástechnológia
Animal welfare, ethology and housing systems
Volume 17 Issue 1
Gödöllő
2021
A COMPARISON BETWEEN DIFFERENT SELECTION INDEXES FOR MILK AND UDDER HEALTH TRAITS ON HOLSTEIN-FRIESIAN COWS
IN EGYPT
A.S. Khattab
1, A. Salem
2,M. Kassab
2, J. Tőzsér
3; A. Gabr
2.1Animal Production Department, Faculty of Agriculture, Tanta University, Egypt,
2Animal Production Department, Faculty of Agriculture, kafr El Sheikh University, Egypt
3 Institute of Animal Husbandry, Hungarian University of Agricultural and Life Sciences, Gödöllő, Hungary.
tozser.janos@uni-mate.hu
Received – Érkezett: 13. 09. 2020.
Accepted – Elfogadva: 02. 11. 2020.
Abstract
A total of 937 normal lactation records of Holstein-Friesian cows, kept at Sakha Farm, belonging to Animal Research Institute Ministry of Agriculture, Dokki, Cairo, Egypt during the period from 2012 to 2017 were used to estimate phenotypic and genetic parameters for 305-day milk yield (MY10), lactation length (LL), fat percent (F%) and somatic cell count (SCC). Data were analyzed using Multiple Trait Derivate Free Restricted Maximum Likelihood (MTDFREML, Boldman et al.
1995). Means of MY10, LL, F% and SCC were 3558 kg, 301 d, 3.7% and 536x10-3, respectively.
Month and year of parturition and parity had a significant effect on all most traits studied.
Heritability estimates for MY10, LL, F% and SCC were 0.61±0.14, 0.16±0.07, 0.40±0.07 and 0.03±0.07, respectively. Eleven selection indexes were constructed. Index I1 incorporating the four traits was the best (RIH= 0.97). It is recommended for selection cows for milk traits and less somatic cell count.
Key words: Holstein-Friesien cow, phenotypic and genetic parameters, selection indexes, Egypt Összefoglalás
Különböző szelekciós indexek összehasonlítása a tejtermelésben és a tőgyegészségügyi tulajdonságokban holstein-fríz tehenekben Egyiptomban
A szerzők 937 holstein-fríz tehén tejtermelési adatait dolgozák fel 2012 és 2017 között Egyiptomban (Sakha telep, a Mezőgazdasági Minisztérium Állattenyésztési Kutatóintézete, Dokki, Karió). A fenotípusos és genetikai jellemzőket az alábbiakra számították: 305 napra korrigált tejmennyiség, tejtermelés hossza, tej zsírszázaléka, a tej szomatikus sejtszámértéke. Az elemzéseket Boldman és mtsai.
(1995) módszerével (MTDFREML) végezték. Az alábbi átlagértékekket kapták: 3558 kg tej, 301 tejtermelési nap, 3,7 tejzsírszázalék és 536 x 10-3 szomatikus sejtszám érték.. Az összes vizsgált tulajdonságesetében igazolták a hónap, a évjárat és az ellés számának hatását. A becsült örökölhetőségi értékeket is számítottak ebben a tanulmányban: 305 napra korrigált tejmennyiség (0,61±0,14), tejtermelés hossza (0,16±0,07), tej zsírszázaléka (0,40±0,07) és a tej szomatikus sejtszámértéke (0,03±0,07). Tizenegy szelekciós indexet próbáltak ki, a legjobb a négy tulajdonságra épülő volt (RIH= 0,97). Ezt javasolják a tejtermelési jellemzők javítására és a szomatikus sejtszám csökknetésére.
Kulcsszavak: Holstein-fríz tehén, fenotípusos és genetikai paraméterek, szelekciós indexek, Egyiptom
Introduction
Genetic improvement of mastitis resistance can be based either on direct selection on clinical mastitis (CM) or indirect selection, using traits genetically correlated to mastitis such as somatic cell account (SCC) (Ødegård et al., 2003). Selection for lower somatic cell source (SCS) is currently used to genetically resistance (Ødegård et al. 2005; El-Awady, 2009 and Missanjo et al., 2013). In addition, genetic progress in several traits could be most efficiency accomplished if the information about those traits is combined into an index of net merit or total score. Hazel and Lush (1942) and Mrode (1996) reported that the selection index was the most efficient method for selection in farm animals. There are different methods for estimate the economic value (1), actual economic value (Khattab and Sultan, 1991; El- Arian et al., 2004; Abosaq et al., 2017), (2) one phenotypic standard deviation (Falconer and Mackay, 1996; El-Arian et al., 2004; Abosaq et al., 2017; El-Sawy, 2019), (3) Lemont method (Abosaq et al., 2017; El-Sawy, 2019) and (4) one genetic standard deviation (Rabab Kassab, 2012).
El-Arian et al. (2004) in a study based on 2181 lactation records of Friesian cows in Egypt, using two methods of economic values, method (1) actual relative economic values and method (2) one phenotypic standard deviation, found that there is no difference between the two methods used in selection index. In addition, El-Sawy (2019) reported that there is no difference between Lemont method and one phenotypic standard deviation.
The aims of the present study are estimate phenotypic and genetic parameters for MY10, LL, F % and SCC and construct a sets of selection indices used for the genetic progress of milk traits in Friesian cows kept at Sakha Farm, belonging to Animal Production Research Institute, Ministry of Agriculture, Dokki, Cairo, Egypt by using one phenotypic standard deviation.
Materials and Methods Data
Data on 937 normal lactation records of Holstein-Friesian cows sired by 50 bulls kept at Sakha Farm at Kafer El- Sheikh, Government, belonging to Animal Production Research Institute, Ministry of Agriculture, Dokki, Cairo, Egypt during the period from 2012 to 2017 were used.
Abnormal records affected by diseases such as mastitis and udder troubles or by disorders such as abortion were excluded. Artificial insemination (AI) using frozen semen was used. Each sire represented at least 5 daughters. Cows were mainly grazed on Egyptian clover (Trifolium alexanderinum) from December to May, and from June to November they were fed on concentrate mixture along with Rice Straw. Cows producing more than 10 kg per day and cow pregnant in the last two months were supplemented with extra concentrate. Traits studied are 305-day milk yield (305 d MY), lactation length (LL), fat percent (F%) and somatic cell count (SCC).
Statistical analyses.
Firstly, all data were analyzed by using Statistical Analysis System (SAS, 2000) to estimate the fixed effects of month, year of calving (2012 to 2017) and parity (1 to 6) and random effect of bulls and cows within bulls and errors.
The following linear mixed model was used Yijklmn =U+si+dij+Mk+Yl+Pm+eijklmn
Yijklmn= the performance traits.
Where U = the overall mean;
Si=the random effect of the ith bull;
dij=the random effect of the jth cow mated with the bull.
Mk=the fixed effect of the kth month of calving, k=1,2,……,12, Yl=the fixed effect of the lth year of calving, l=2012, 2013,…..,2017;
Pm=the fixed effect of the mth parity, m=1,2,……,6 and eigklmn=the residual error.
The (co-)variance components were estimates by MTDFREMl inference in multi- traits animal model analysis. The model included fixed effects of month and year of calving and parity.
Additive genetic and permanent environmental effects were included as random effects. The model adopted, represented in matrix was:
y=Xb+Zu+Wp+e where,
y=observations vector of records,
b=fixed effects vector (year of parturition from 2012 to 2017, month of parturition, from January to December and parity from 1 to 6), a=animal direct effect vector, p=permanent environmental effect vector and e=residual effect vector, X, Z and W are incidence relating records to fixed, animal and permanent environmental effects, respectively.
To estimate heritability (h2) the following equation was used:
h2=σ2a/(σ2a+σ2pe+σ2e)
Where σ2a is additive genetic variance; σ2pe is permanent environmental variance and σ2e is the random residual effect associated with each of observation.
Estimates of phenotypic and genetic correlations with standard errors and their accuracy are estimated according to Boldman et al. (1995).
The estimates of phenotypic and genetic variance and covariance for MY, LL, F% and SCC were used for the construction of selection indices. The principle of selection by means of an index developed by Hazel (1943) was followed in deriving the different indices used in this study. The basic index including the four traits was estimated by the matrix technique as described by Cunningham (1970). In addition, to the complete index, ten reduced indices were computed using
all combination of traits. These indices were computed via the correlation with the aggregate genotype (RIH). The relative economic values for all traits studied were estimated according to Falconer and Mackay (1996) by using one phenotypic standard deviation as an economic weight.
The expected genetic change in any one of the traits included in the aggregate genotype was calculated according to Mored, 1996.
Results and Discussion Unadjusted means.
Means, standard deviation (SD) and coefficient of variability for MY10, LL, F% and SCC are presented in Table 1. Means of MY10, LL, F% and SCC are 3558 kg, 301 d, 3.7% and 536 x10-3, respectively. The present estimates of MY10 was higher than those reported by Khattab and Sultan (1991)(2254 kg) and Shehan El-Din (2020)(2935 kg) working on another set of that herd, while the present mean of MY10 are lower than those reported by El-Arian et al. (2003)(5021) and Abosaq et al. (2017)(4227 kg) with Holstein Friesian cows in Egypt. Overall mean of LL was lower than those reported by Khattab and Sultan (1991), Sanad and Hassanane (2017) and Shehab el- Din (2020) and ranged from 31 to 338 d, and LL are higher than those reported by El-Arian et al.
(2003) (286 kg). The overall mean of F% (3.7%) was quite similar to those values found by Cue et al. (1987), Yoon et al. (2004); Ghorbani and Ramin (2012) and Grayaa et al. (2019) and ranged from 0.36 to 0.39. The present mean of SCC was higher than those found by Yoon et al., 2004 and El–Awady and Oudah (2011) and ranged from 164 to 478x10-3 cells/ml, The estimates of CV%
were 46.12, 36.21, 10.81 and 74.63% for the four traits respectively. The higher CV% for SCC (74.63%) reflects great variation between individuals in such an important trait. These variations are to be expected as probable consequences of feeding and management changes, as well as changes in the genetic composition of the herd over the study.
Table 1: Means, standard deviation (SD) and coefficient of variation for 305-day milk yield (MY10), lactation length (LL), fat% (F%) and somatic cell count (SCC) per 10-3 cells/ml for
Holstein-Friesian cows
Traits(1) Mean vales(2) Standard deviation(3) CV%(4)
MY10, kg (5) 3558 1641 46.12
LL, d (6) 301 109 36.21
F% (7) 3.70 0.40 10.81
SCC, 10-3 (8) 536 400 74.63
1. táblázat: A 305 napra korrigált tejmennyiségnek, a laktáció hossznának, a tej zsírzsázalékának és a tej szomatikus sejtszámértékének átlag, szórás és relatív szórás értékei a hosltein-fríz tehenekben
jellemzők (1), átlag érték (2), szórás érték (3), relatív szórás (4), 305 napra kprrigált tejmennyiség (5), laktáció hossza (6), tej zsírszázaléka (7), tej szomatiskus sejtszámértéke (8)
Least squares analysis of variance for non-genetic effects on milk traits are presented in Table 2. Month and year of parturition had highly significant effect on all traits studied (MY10, LL and SCC, P<0.01, Table 2), expect for F% and effect of month of parturition on SCC. The significant effect of month and year of parturition may be due to different in climatic condition,
feeding system and phenotypic trends. The same trends obtained by (Khattab and Sultan, 1991;
El-Arian et al., 2003; El Awady and Oudah, 2011; Sanad and Hassanane, 2017; Abosaq et al., 2017; El-Sawy, 2019 and Shehab El-Din, 2020). Lactation number has a significant effect only on MY10 (P <0.05, Table 2). Increase of MY10 as lactation number increased may be due to higher body size of animals and higher udder secretion tissue. Therefor adjusted of lactation records for the main fixed effects are very important for estimate genetic parameters which are used in constructed selection indexes.
Table 2: Least squares analysis of variance for factors affecting 305-day milk yield (MY10), lactation length (LL), fat% (F%) and somatic cell count for Holstein-Friesian cows
MY10, kg(2)
LL, d(3) F%(4) SCC 10-3(5)
S.O.V.(7) df (1) F-values (6)*
Between bulls (8) 49 3.82** 1.98** 0.87 ns 3.27**
Between cows: bulls (9) 379 2.08** 1.80** 7.01** 5.57**
Between month of calving (10)
11 2.84** 3.00** 0.72 ns 1.44 ns Between year of calving (11) 5 6.86** 12.06** 0.90 ns 6.41**
Between parity (12) 5 2.58* 1.50 ns 0.18 ns 1.13 ns
Reminder, M.S. (13) 487 1239300 7588 2538 2537
*P < 0.05, ** P <0.01, ns= not significant
2. táblázat: A vatriancia-analízis eredémnyei a 305 napra korrigált tejmennyiségre, a laktáció hosszára, a tej zsírzsázalékára és a tej szomatikus sejtszámértékének alakulására a hosltein-fríz tehenekben
szabadság fok (1), 305 napra korrigált tejmennyiség (2), laktáció hossza (3), tej zsírszázaléka (4), tej szomatiskus sejtszámértéke (5), F- érték (6), variancia források (7), bikák között (8), tehenek között: bikák szerint (9), ellési hónap szerint (10), ellési év szerint (12), ellések száma (12), hiba érték (13)
Random effects
Bulls of the cow had a highly significant effect (P<0.01, Table 2) for MY10, LL and SCC, while had no significant effect on F%. In addition, Cows within bulls had a highly significant effect (P<0.01, Table 2) on all traits studied. The present results indicated the possibility of genetic improvement of MY10, LL and SCC through sire and cow selection. Also, cow evaluation and selection are important in herd improvement scheme. In addition, the effect of cow is due to the permanent environment, which changes from record to another. Similar results are reported by many studies in different breeds of dairy cows (Khattab and Sultan, 1991; Nilforooshan and Edriss, 2004; Al-Arian et al., 2004; El-Awady, 2009; Abosaq et al., 2017; El-Sawy, 2019 and Shehab El- Din, 2020).
Genetic parameters
Heritability estimates for 305 d MY, LL, F% and SCC were 0.61±0.14, 016±0.07, 0.40±0.07 and 0.0.3±0.07, respectively (Table 3). El- Awady (2009) with another herd of Holstein- Friesian cows in Egypt, found that heritability estimates for 305 d MY and SCC were 0.35 and 0.19, respectively. The present estimates of h2 for MY10 and F% are higher than those reported by Grayaa et al. (2019) with Holstein Friesian in Tunisian, found that h2 for MY10 and F% are 0.23(0.01) and 0.31 (0.01), respectively. The present estimate of h2 for SCC was lower than those found by El-Awady, (2009) (0.19) and El-Awady and Oudah (2011) (0.11). According to higher estimates of h2 for MY10 and F%, it could be concluded that the genetic improvement in milk yield and milk composition can be achieved through selective breeding program. The low heritability estimates for LL and SCC indicate little scope of genetic improvement of lactation length and somatic cell count through selection and also these traits are affected by mainly by environmental factors such as improvement of feeding, management and milking cows three or four times per day.
Table 3: Estimates of genetic parameters for 305-day milk yield (MY10), lactation length (LL), fat% (F%) and somatic cell count (SCC)
Traits(1) MY10, kg(2) LL, d(3) F%(4) SCC 10-3(5)
MY10 0.61 ± 0.14 0.81 0.03 -0.02
LL 0.96 ±0.07 0.16 ± 0.07 0.03 -0.03
F% 0.15 ± 0.31 0.53 ± 0.40 0.40 ± 0.07 -0.15
SCC -0.45 ± 0.07 -0.32 ± 0.08 -0.18 ± 0.04 0.03 ± 0.07 Heritability on diagonal, genetic correlation below diagonal and phenotypic correlation above diagonal. 3. táblázat: A 305 napra korrigált tejmennyiségre, a laktáció hossznára, a tej zsírzsázalékára és a tej szomatikus sejtszámértékének átlagára vonatkozó becsült genetikai mérőszámok
jellemzők (1), 305 napra korrigált tejmennyiség (2), laktáció hossza (3), tej zsírszázaléka (4), tej szomatiskus sejtszámértéke (5)
Genetic correlations among MY10, LL and F% were positive and ranged from 0.15±0.31 to 0.96±0.07, while the genetic correlations among SCC and all traits are negative and ranged from -0.18±0.04 to -0.45±0.07 (Table 3). The present results suggested that selection for milk production would lead to slight increase of F% and high lactating cows are also having the longer LP, while, SCC decreased and this is the main goal of dairy farm. Phenotypic correlations among all traits are similar to genetic correlations. Similar results are reported by (Ødegård et al., 2003&2005; El- Awady, 2009; Rabab Kassab, 2012; and Missanjo et al., 2013; Abosaq et al., 2017; El-Sawy, 2019;
Grayaa et al., 2019) working on different breeds of dairy cattle on different countries.
Selection indices
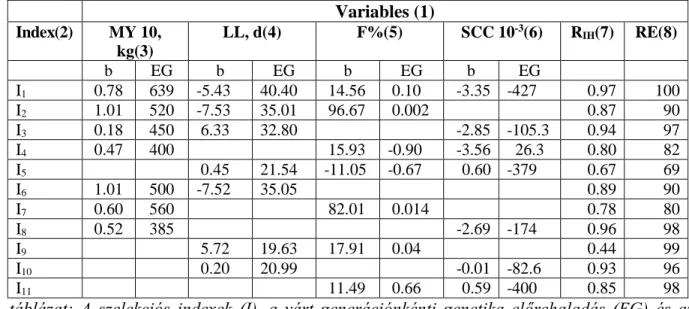
Eleven selection indices were constructed (Table 4). The original index (I1) included at the four variables (MY10, LL, F% and SCC) to be used for improving the aggregate genotype of the four traits, while the reduced indices (I2, I3,……,and I11) included only three or two variables to select aggregate genotype. The expected genetic gain per generation ranged from 385 to 639 kg for MY10, from 19.63 to 40.40 d for LL, from -0.90 to 0.66% for F% and from -427 to 26.3x10⁻³ for SCC. The maximum genetic improvement for MY10, LL and SCC were achieved by the original
index (I1). The expected genetic gain in MY10 increased by 639 kg/generation, LL increased by 40.40 d/generation and SCC decreased by 427x10-3 cell/generation and F% increased by 0.10%.
The maximum genetic improvement for F% was achieved by I11 which includes F% and SCC.
Expected genetic gain in F% increased by 0.66%/generation and SCC decreased by 400x10-3 cell/ml.
Table 4: Selection indices (I’s), expected genetic gain per generation (EG), correlation of index with aggregate genotype (RIH) and the efficiency (RE) of different indices relative to
the original index (I1) Variables (1) Index(2) MY 10,
kg(3)
LL, d(4) F%(5) SCC 10-3(6) RIH(7) RE(8)
b EG b EG b EG b EG
I1 0.78 639 -5.43 40.40 14.56 0.10 -3.35 -427 0.97 100
I2 1.01 520 -7.53 35.01 96.67 0.002 0.87 90
I3 0.18 450 6.33 32.80 -2.85 -105.3 0.94 97
I4 0.47 400 15.93 -0.90 -3.56 26.3 0.80 82
I5 0.45 21.54 -11.05 -0.67 0.60 -379 0.67 69
I6 1.01 500 -7.52 35.05 0.89 90
I7 0.60 560 82.01 0.014 0.78 80
I8 0.52 385 -2.69 -174 0.96 98
I9 5.72 19.63 17.91 0.04 0.44 99
I10 0.20 20.99 -0.01 -82.6 0.93 96
I11 11.49 0.66 0.59 -400 0.85 98
4. táblázat: A szelekciós indexek (I), a várt generációnkénti genetika előrehaladás (EG) és az indexek korrelációja az egyesített fenotípus értékkel (RIH)és a különböző indexek hatékonysága (RE) az erdetei indexhez (I1) képest
változók (1), index (2), 305 napra korrigált tejmennyiség (3), laktáció hossza (4), tej zsírszázaléka (4), tej szomatiskus sejtszámértéke (3), b=az index faktorsúlyai (6). korreláció (7), index hatékonyság (8)
The indices not including SCC (I2, I6, I7 and I9) showed a reduced accuracy (RIH) (0.87, 0.87, 0.78 and 0.44, Table 4, respectively). Hence it would be desirable to include SCC in an index incorporating MY10, LL and F%. In this respect, El-Awady (2009) and Missanjo et al. (2013) reported that the importance of including SCC in any selection index to improve the total merit of dairy cows.
Conclusions
The results obtained in the present study suggest that selection to increase milk yield will only slightly affect milk composition and milk quality. Positive genetic correlation between milk yield and lactation length and fat% indicates that selection for higher production cows will gives also longer lactation length and increased fat%. In addition, the results of the present study suggested that selection index I1, which incorporated 305-day milk yield, lactation length, fat% and somatic cell count was the most suitable (RIH= 0.97) This index is recommended for Holstein-
Friesian cows kept at Sakha Farm, belonging to Animal Production Research Institute, Dokki, Cairo, Egypt.
References
Abosaq, F. M.; S. M. Zahranm.; A.S. Khattab.; H.S. Zeweil.; Sallam, S.M. (2017): Improving reproductivity and productivity traits using selection indices in Friesian cows. J. Adv.
Agric. Res. (Fac. Agric., Saba Basha), 22: 110-120.
Boldman, K. G.; Kriese, L. A.; Van Vleck, LD. and Kachman, S.D. (1995): A manual for use of MTDFREML A set of programs to obtain estimates of variances and covariances (DRAFT).
ARS, USDA, Washington, D. C.
Cue, R.I.; H.G. Monarges.; J.F. Haves (1987): Correlations between production traits in first lactation Holstein cows. J. Dairy Sci., 70: 2132-2137.
Cunningham, E.P. (1970): XIV. British Poultry breeders round Table, Birmingham, Nov. 14- 16,1972.
El-Arian, M.N.; H.G. EL-Awady; A.S. Khattab (2003): Genetic analysis of some productive traits of Holstein Friesian cows in Egypt through MTDFREML program. Egypt. J. Anim. Prod.
40: 99-109.
El- Arian, M. M.; F.H. Farrag.; E. A.Omer.; A.H. Hussein.; A.S. Khattab (2004): A comparison of different selection indices for genetic improvement of some milk traits by using two sets of relative economic values in Friesian cattle in Egypt. EAAP.55th Annual Meeting, Bled, 2004 P 79.
El- Sawy, A. A. (2019): Genetic evaluation for some economic traits in Egyptian buffaloes. M.Sc.
Thesis, Faculty of Agriculture, Tanta university, Egypt.
El- Awady, H.G. (2009): Calculation of the economic values for some udder health traits to estimate the profitability of the selection indices for dairy cows in Egypt. Livestock Research for Rural Development. 21(9).
El- Awady, H.G.; E.Z.M. Oudah. (2011): Genetic and economic analysis for the relationship between udder health and milk production traits in Friesian cows. Asia – Aust. J. Anim.
Sci., Vol., 24(11) 1513.
Falconer, D.S.; T.F.C. Mackay. (1996): Introduction to quantitate genetic. 4th edition, Lo.
Hazel, L.N. (1943): The genetic basis for constructing selection indexes. Genetics, 28:476.
Hazel, L.N. and J.L. Lush (1942): The efficiency of three methods of selection. J. Heredity,393.
Ghorbani, A,; S. Ramin (2012): Estimation of additive and non additive effects on milk production traits in Iranian Holstein crossbred population. Archiv., Tierzicht 55(6) 562-566.
Grayaa, M.; Vanderick, S.; Rekik, B.; Gare, B.; Hanzen, C.; Grayaa, S.; Mote, R.; Hammami, H.;
Genler, N. (2019) Linking first lactation survival to milk yield and components and lactation persistency in Tunisian Holstein cows. Archiv., Anim. Breed., 62153-160.
Khattab, A. S.; Z. A. Sultan. (1991): A comparison of different selection indices for genetic improvement of some dairy traits in Friesian cattle in Egypt. J. Anim. Breed. Genet.
108:349-354.
Missanjo, E., Chikosi, V. I.; Halimani, T. (2013): A proposed selection index for Jersy cattle in Zimbabwe. ISRN Veterinary Sci., http://dx.doi.org/10.1155/2013/148030.
Mrode, R. A. (1996): Linear models for the prediction of animal breeding value. CAB International, Walling ford Oxon OX 10 8 DE UK.
Nilforooshan, M.A.; M.A. Edriss. (2004): Effect of age at first calving on some productive and longevity traits in Iranian Holsteins of the Isfahan province. J. Dairy Sci., 87:2130.
Odegard, J., G.Klemetsdal.; B. Heringeticstad (2003): Genetic improvement of mastitis resistance:
Validation of somatic cell score and clinical as selection criteria. J. Dairy Sci., 86:4129.
Odegard, J., G. Klemetsdal.; B. Heringeticstad (2005): Genetic improvement in mastitis resistance: comparison of selection criteria from cross – sectional and random regression sire models for somatic cell score. J. Dairy Sci., 88: 1515.
Rabab Kassab, A. (2012): A comparison between different selection indexes for some milk traits on Friesian dairy cattle. Anim. Sci., 65: 353.
SAS (2000): Statistical Analysis System - User's Guide. Stat., Version 8.2. Cary NC: SAS Institute Inc.
Sanad, S.; M.S. Hassanane. (2017): Genetic evaluation for some productive and reproductive traits in Friesian cows raised in Egypt. J. Anim. Prod., and poultry , Mansoura University, 8(8) 227-232.
Shehab El-Din, M.I. (2020): Genetic evaluation for some productive and reproductive traits of Friesian cattle raised in Egypt. Ph.D. Thesis, Fac. of Agric., Al-Azhar Univ., Egypt.
Yoon, J.T.; H.; C.K.; Lee.; Y.C. Kim.; C.H. Chung. (2004): Effects of milk production, season, parity and lactation period on variations of milk urea nitrogen concentration and milk components of Holstein dairy cows. Asian – Aust. J. Anim. Si., Vol. 17(4) 479.