NGUYEN THAO NGUYEN
KAPOSVAR
DOI: 10.17166/KE2017.002THESES OF DOCTORAL (PhD) DISSERTATION
KAPOSVÁR UNIVERSITY
FACULTY OF AGRICULTURAL AND ENVIRONMENTAL SCIENCES Department of Animal Genetics and Biotechnology
Head of Doctoral School Prof. Dr. MELINDA KOVÁCS
Correspondent Member of the Hungarian Academy of Sciences
Supervisors
Dr. habil. ISTVÁN NAGY Senior researcher Prof. Dr. INO CURIK
Full professor
ESTIMATION AND UTILISATION OF DOMINANCE EFFECTS IN RABBIT POPULATIONS
Written by
NGUYEN THAO NGUYEN
Kaposvár 2017
1. INTRODUCTION AND AIMS
For several decades the basic goal in animal breeding has been to improve traits of economic interest. This goal is being accomplished by identifying the individuals having superior genetic merit then selecting these animals to create the next generation. This process is accomplished by means of the breeding program where prediction of breeding values (genetic evaluation) is one of the most important elements of the selection process.
Although the theoretical basics were developed 40 years ago (Henderson, 1975) breeding value prediction could not become widespread until the development of softwares from the 1990s (Boldman et al., 1993; Groeneveld, 1990; Meyer, 1989) that could be applied estimating the breeding values (based on pedigree and performance data). Since the early 1990s the breeding value prediction became wide spread worldwide in every domesticated species and selection has been based on the BLUP (best linear unbiased prediction) breeding values in cattle (Dempfle, 1977), pigs (Hudson et al., 1985), sheep (Olesen et al., 1995) and rabbit (Estany et al., 1989). In Hungary the method also became widespread. In cattle the breeding value estimation of the bulls was based on the BLUP sire models as early as 1985 then on the animal models from 1999 (Nagy et al., 2004). Compared to cattle the BLUP method was introduced a bit later in pigs (Groeneveld et al., 1996), sheep (Nagy et al. 1999) and in rabbits (Nagy et al., 2006).
The common feature of the above mentioned studies was that the genetic evaluation focused only on the additive genetic effects while ignoring non-additive genetic effects (dominance and epistasis). As noted by Norris et al. (2010) genetic evaluation in any livestock species has been for the prediction of transmitting ability which is due to additive genetic effects.
Although non-additive genetic effects are not directly transmitted from parents to offspring, they are important for traits closely related to fitness or having low heritability (Falconer, 1989). In fact the significant contributions to phenotypic variation - especially fitness and reproductive traits - of the dominance genetic effects has also been observed in a number of studies (Norris et al., 2006). Estimating dominance variance has been a subject of interest for decades (Maki-Tanila 2007) as there are several reasons for estimating dominance variation:
an unbiased estimation of variance components (Misztal 1997), more precise prediction of additive effects with the effects of gene interactions included in the genetic evaluations (Henderson, 1989; Misztal et al., 1996), and usage of dominance effects through a crossbreeding or planning of mating schedule.
Dominance influences all genetic parameters related to cross- breeding (Wei et al., 1991a;
Wei et al., 1991b). Pigs and rabbits, as prolific multiparous species, within populations usually have a large number of non-additive relationships (i.e., full-sibs) (DeStefano and Hoeschele, 1992). Van Tassell et al. (2000) suggested that a minimum of 20% full sibs should be in the population for successful estimation of non-additive genetic variation.
Information on non-additive genetic effects is limited. As also noted by Toro and Varona (2010), we need to remember that ignoring non-additive genetic effects will produce less accurate estimates of breeding values and will have an effect on rankings. Technically it is now also possible to consider dominance effects; however, mainly due to the technical and computational difficulties dominance effects are still usually ignored from animal models (Toro and Varona, 2010).
Scientific research connected to rabbit breeding has a long tradition at the Kaposvár University. Pannon White rabbit breed also has an extremely long and complete pedigree which makes it highly suitable for analyzing population structure and inbreeding depression (Nagy et al., 2010; Nagy et al., 2013). In the classical approach based on the pedigree, confounding is a serious problem as it is not possible to separate dominance effects from the full-sib common environment. Utilisation of the abundant multi-generation data allows separation of dominance from non-genetic effects (Lee et al. 2010). In recent years the estimation of the dominance variance component has been analyzed for reproductive traits in Pannon White (Nagy et al., 2013b) and Pannon Ka (Nagy et al., 2014) rabbit breeds based on family effects (extended animal model).
It should be concerned to face with the difficulties when introducing the dominance effect into the models that we should choose the appropriate structure of these models before applied dominance effect into the models. Since the first evaluation genetic variances of rabbits’ reproductive performance based on the Best Linear Unbiased Prediction (BLUP) (Estany, 1989), several similar studies have been published (Rastogi, 2000; García and Baselga, 2002a, Piles et al., 2006; Nagy, 2011a; Nagy, 2011b; Ragab, 2011) covering the most important breeds and hybrid lines. Nevertheless, when analysing model structures applied by these authors, besides the obvious random effects (animal and permanent environmental effects) it can be seen that the considered factors of these studies are highly heterogeneous (mating buck, physiological status, kindling month, kindling season, inbreeding coefficient of the dam, etc.). Only few studies presented model comparisons (Piles et al., 2006; Nagy et al., 2011b), where repeatability and multi-trait models were compared.
In most studies no extensive information was given to specify how the authors developed the structure of the model evaluating reproductive performance. Another important issue of genetic evaluation is to determine which genetic effects should be considered. In animal breeding mostly simplified models are applied, taking into account only the additive genetic effects. On the other side, other genetic factors can also influence inheritance of quantitative traits and consequently they have impact on the estimation of basic genetic parameters. The mitochondrial genome (mitogenome) is a closed circular DNA molecule, in rabbits the length of the molecule is approximately 17,245 nt varying by repeated motifs placed in the control region, that encodes for the synthesis of 13 proteins that are essential for the oxidative phosphorylation (OXPHOS) system and are responsible for the regulation of cellular energy metabolism (Wallace, 1999). Mitogenome is inherited only through the maternal lineage (Giles et al., 1980), thus, providing genetic mechanism for cytoplasmic inheritance with potential impact on the quantitative traits and the estimation of genetic parameters important in animal breeding (VanVleck, 2000 -chapter 19). Thus, in a simulation study, Boettcher et al (1996c) noted that ignoring cytoplasmic effects will lead to biased estimates of heritability.
The models were also performed in poultry (Szwaczkowski et al., 1999), sheep (Hanford et al., 2003; Snowder et al., 2004). However, in all those studies cytoplasmic effects were analysed under assumption that maternal lineages derived from the pedigree reflect mitogenome polymorphism. However, this is quite a relaxed assumption and to obtain more accurate estimates cytoplasmic quantitative genetic models have to be further extended to the association analyses of the mitogenome polymorphism, from D-loop mtDNA to complete mitogenome, with production traits. Good examples are provided in studies related to poultry (Zhao et al., 2015), pig (Yu et al., 2015, Tsai et al., 2016), sheep (Chen et al., 2017) populations as well as to humans (Liu et al., 2012) where association of certain mitogenome polymorphisms with quantitative traits have been analysed. Unfortunately, as far as we are aware, no single analysis has evaluated the impact of cytoplasmic effects, neither of maternal lineages nor of mitogenome sequence variation, on any of traits that are important in rabbit production. Thus, estimate the genetic parameters, predict the breeding values and effects of cytoplasmic and mitochondrial inheritance for litter size components of Pannon rabbits using several animal models (based on the available environmental factors) are applied in order to detect the structures of the “best” models.
Aims:
The objective of this PhD work was twofold. The first objective was to define the structures of the “best” models for the traits of interest (litter size traits such as number born alive, number born dead and total number born) of the Pannon Large, Pannon White and Pannon Ka rabbit. The second objective was to accomplish a detailed genetic evaluation of the importance of the dominance effects in those Pannon rabbit breeds including estimation of variance components, prediction of breeding values and analysis of breeding value stability based on additive and non-additive models. The research hypotheses were that the different models had different fit of the reproductive data and the models extended with dominance effects predict breeding values for the analysed traits more precisely.
2. Material and methods
2.1. Data information
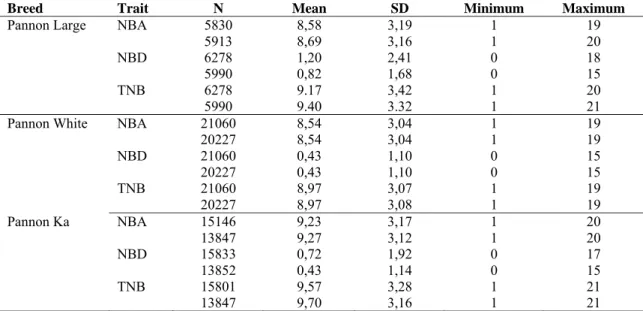
Data on this study was collected in three Pannon rabbit breeds Pannon White, Pannon Ka and Pannon Large between 1992-2016, 1999-2016 and 2004-2015, respectively at the experimental rabbit farm of the Kaposvár University. Two different datasets were used for every breed. After testing the cytoplasmic effects it turned out that they had no effect for the litter traits. Thus in the latter models (not containing these effects) the data cumulated in the meantime was also used. This is the reason that two different numbers are given for each trait. General development and management of the Pannon rabbit breeds were described by Matics et al. (2014). Descriptive statistics of the kindling records are given in Table 1. The analyzed reproductive traits were number of kits born alive (NBA), number of kits born dead (NBD) and total number of born kits (TNB). The information about pedigree in Pannon rabbits was also shown in Table 2.
Table 1. Descriptive statistics for estimating effects of cytoplasmic and mitochondrial inheritance on litter size traits analyses in Pannon rabbit breeds
Breed Trait N Mean SD Minimum Maximum Pannon Large NBA 5830 8,58 3,19 1 19
5913 8,69 3,16 1 20
NBD 6278 1,20 2,41 0 18
5990 0,82 1,68 0 15
TNB 6278 9.17 3,42 1 20
5990 9.40 3.32 1 21
Pannon White NBA 21060 8,54 3,04 1 19
20227 8,54 3,04 1 19
NBD 21060 0,43 1,10 0 15
20227 0,43 1,10 0 15
TNB 21060 8,97 3,07 1 19
20227 8,97 3,08 1 19
Pannon Ka NBA 15146 9,23 3,17 1 20
13847 9,27 3,12 1 20
NBD 15833 0,72 1,92 0 17
13852 0,43 1,14 0 15
TNB 15801 9,57 3,28 1 21
13847 9,70 3,16 1 21
NBA - Number of kids born alive, NBD - Number of kids born dead, TNB - Total number of kids born Table 2. The pedigree of Pannon rabbit breeds
Breed Period Animal Sire Dam Pannon Large 2004-2015 3664 686 1469 Pannon White 1992-2016 8545 1414 4926
Pannon Ka 1999-2016 5543 1096 3691
2.2. Molecular analyses
2.2.1. Sampling for molecular analysis
To determine maternal (founder) lineages from the pedigree and obtain samples for molecular analysis we used procedure mag_sampl module implemented in the MaGelLan 1.0 (Maternal Genealogy Lineage analyser) software (Ristov et al. 2016; https://github.com /sristov/magellan.). Analysis was performed on a previously corrected pedigree utilizing the mag_sampl module of the same software. Overall, there were six, two and four maternal (founder) lineages in Pannon Large, PannonKa and Pannon White breed, respectively. The blood of several rabbits per each maternal lineage was further taken for molecular analysis. In this way we were able to analyze maternal lineage segregation consistency through the pedigree.
2.2.2 Molecular analysis
Following, the DNA was extracted from 31 PK, 25 PL and 22 PW blood samples using commercially available NucleoSpin Blood Kit according to manufacturer’s protocol (Macherey-Nagel GmbH & Co. KG, Germany). A 332-bp fragment of the mitochondrial D- loop region was amplified by PCR using primers upper (5′-CACCATCAGCACCCAAAG-3′) (Melo-Ferreira et al., 2007) and lower (5′-ATTTAAGAGGAACGTGTGGG-3′) (Pierpaoli et al., 1999). PCRs were performed in a 25 μL volume containing 0.2 μM of each primer and using Emerald AMP GT PCR Master Mix (Takara Bio Inc, Japan) according to manufacturer's protocol. The amplification reactions were performed on a iCycler (Biorad, Germany) comprised of an initial denaturation at 95 ºC for 5 min, 38 cycles of denaturation at 95 ºC for 45 s, annealing at 52 ºC for 45 s and extension at 72 ºC for 1 min and final extension at 72ºC for 1 min. PCR products were purified using Wizard SV Gel and PCR Clean-Up Kit (Promega, USA) and sequenced directly by using an ABI PRISM® 3100- Avant Genetic Analyzer and the BigDye- terminator method using both PCR primers. The sequences were visualized and aligned using MEGA 7 (Kumar et al., 2015). Haplotypes were calculated using DNA Sp 5.10 (Librado and Rozas, 2009) and Median-joining network (Bandelt et al., 1999) was constructed by PopART (Leigh and Bryant, 2015;
http://popart.otago.ac.nz).
D-loop mtDNA sequences of Pannon rabbits were deposited in GenBank under the Accession numbers KY977609-KY977686.
2.2.3. Maternal pedigree verification (Maternal lineage segregation pedigree consistency) Originally, only two haplotypes (D-loop mtDNA sequences), here named H1 and H2, were found in PL and PW while only H1 was found in PK population. We further imputed (assigned) obtained mtDNA sequences to the maternal lineages (Mag_stat) and consequently verified consistency of maternal lineage segregation through the pedigree (Mag_verif). Single conflict has been found in PL pedigree where H2, present in individual 13-20188 (YOB 2013), was not consistent with pedigree of three sequenced individuals. After identification, utilization of Mag_con_demo module as described in Čačić et al., (2014), and exclusion of non-consistent individual from the dataset only H1 was present in the PL breed. Thus, the difference between two haplotypes (H1 versus H2) for the litter size and growth traits was tested only in PW breed.
2.3 Models
2.3.1 Additive models with cytoplasmic and mtDNA haplotype effects and the fit of the models
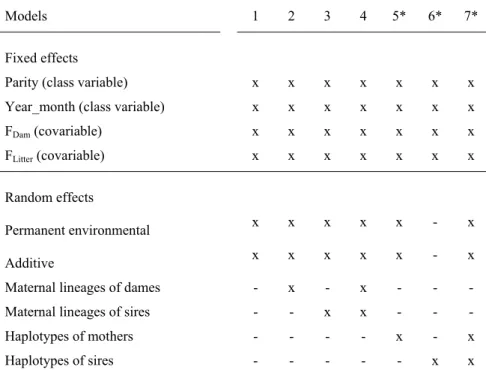
To analyze the impact of cytoplasmic or mitochondrial (D-loop mtDNA) effects on the traits analysed we performed seven different models that are described in details in Table 3. The models (see Table 3) referred to the litter size traits and all had the same fixed effects known to have impact on their variability (Nagy et al., 2013a, Nagy et al., 2013b). Thus, as a fixed effect we modelled; parity (4 levels), year-month (101 levels-Pannon Large, 246 levels- Pannon White, 185 levels-Pannon Ka), inbreeding coefficient of dams (FDam) and litters (FLitter). In all seven models permanent environment and additive genetic effects were treated as random effects while models were different due to the presence/absence of dam or sire or both - cytoplasmic or mitochondrial (D-loop mtDNA) effects, all treated as random effects.
Here, in addition to the models with maternal lineage of dam effects, which is classical approach used in a large number of studies (Boettcher et al., 1996c, Boettcher et al., 1997;
Snowder et al., 2004), we also modelled the maternal lineage of sire (bucks) effects. This decision was based on the established evidence that certain mitogenome mutations have strong impact on the male fertility (Ruiz-Pesinietal et al., 2000; John et al., 2005; Kumar and Sangeeta, 2009) and consequently can affect the litter size. We applied Model 5, 6 and 7 to tested variance contribution of the difference between Hap-1 and Hap-2. Applicable only in Pannon White breed.
The general structure of these models was:
y =Xb+Za+Wp+e
Where: y = vector of phenotypic observations, b=vector of fixed effects, a=vector of additive genetic effects, p= vector of individual permanent environmental effects, e= vector of residuals, X, Z, W incidence matrices linking phenotypic records to parameters.
Inbreeding coefficient of dams (FDam) and litters (FLitter) were calculated with ENDOG 4.8 software (Gutiérrez and Goyache, 2005). The pedigree files did not contain all progeny of the does presented in the data set.
Table 3. Description of models used in estimating cytoplasmic and D-loop mtDNA effects
Models 1 2 3 4 5* 6* 7*
Fixed effects
Parity (class variable) x x x x x x x Year_month (class variable) x x x x x x x FDam (covariable) x x x x x x x
FLitter (covariable) x x x x x x x
Random effects
Permanent environmental x x x x x - x
Additive x x x x x - x
Maternal lineages of dames - x - x - - - Maternal lineages of sires - - x x - - - Haplotypes of mothers - - - - x - x Haplotypes of sires - - - x x
*Reduced dataset as the number of known haplotypes following maternal segregation was smaller. FDam and FLitter are inbreeding coefficients of dam and litter, respectively.
Thus, before calculation of litter inbreeding coefficients, dummy progeny was created according to the unique combinations of their parents (does and related mating bucks) and then litter inbreeding coefficients were calculated.
In order to compare the goodness of fit of the models the PREDICTION procedure of PEST (Groeneveld, 1990) was applied to calculate the mean squared error (MSE), bias and correlation between the observed and predicted values.
)2
(ˆ 1
i
i y
n y
MSE =
∑
−Where: ŷi and yi are the predicted and observed phenotypic values. The prediction for a given kindling record of a given rabbit doe is accomplished summing all its BLUP.
Besides, the goodness-of-fit of these models also was assessed by using the log-likelihood value and Akaike’s information criterion (AIC) (Posta J, 2008). AIC was calculated by:
AIC= -2*log(maximum likelihood)+2*(number of model parameters)
The model with the lowest AIC was considered as best fitting model.
2.3.2 Additive models without cytoplasmic and mtDNA haplotype effects and the fit of the models
Applying single-trait animal models, genetic parameters, breeding values and genetic trends of NBA, NBD and TNB for Pannon breeds were estimated by the REML and BLUP methods using the PEST (Groeneveld, 1990) and VCE6 software (Groeneveld, et al., 2008). Based on the available environmental factors, 12 different models were tested for all traits (Table 4) to estimate additive, permanent environmental, residual variances and breeding values.
Table 4. Fixed factors of applied models of Pannon rabbits Model
1 2 3 4 5 6 7 8 9 10 11 12 Fixed effects
Parity x x x x x x x x x x x x Age - x - - x - - x - - x - Age_square - - x - - x - - x - - - Year x x x x x x - - - x Month x x x - - - - - x Season - - - x x x - - - - Year_month - - - x x x - - - Year_season - - - x x - Random effects
Additive x x x x x x x x x x x x Permanent environmental x x x x x x x x x x x x
Parity: parity number; Age: age of does at kindling; Age_square: the squared age of does at kindling; Year: year of kindling; Month: month of kindling; Season: season of kindling; Year_month: year and month of kindling;
Year_season: year and season of kindling
The general structure of these models were:
y =Xb+Zpe+Wa+e
Where: y - vector of phenotypic observations; b - vector of fixed effects; pe - vector of permanent environmental effects; a - vector of additive genetic effects; e - vector of residuals:
X, Z, W - incidence matrices linking phenotypic records to respective effects. In order to compare the goodness of fit of the models, the evaluation are the same used in the preceding (2.3.1) section.
2.3.3 Non-additive models
After determining the best fitted models for the analyzed breeds, dominance was included in these best models of the different litter size traits via the family class effect following the work of Hoeschele and VanRaden (1991):
y = Xb + Zpe + Wa + Uc + e
Where: c - vector of family class effects - dominant effect, pe - vector of permanent environmental effects, U - incidence matrices linking phenotypic records to family effects.
The other effects were the same as explained for the basic models (2.3.1 study). In addition to estimated variance components, dominance variance was calculated as VD = 4VC. Contributions of additive (h2), dominance (d2), and permanent environmental (p2) variance to total phenotypic variance (VP = VPe + VA + VD + VE) were also calculated. VE had to be corrected by 3/4 VD because of the use of VD instead of VC.
2.4. Genetic trends
The squared differences between the observed and predicted values based on the 12 models were compared by means of one-way ANOVA (R Core Team, 2012). Genetic trends of additive and non-additive effects were determined by fitting the average predicted breeding values of the animals born in the same year on the years of birth using linear regression. The obtained slopes for two datasets were compared as described by Mead et al. (1993) as follows:
Where: F-distribution to test the hypothesis that there is no difference between the two linear regressions; RSS (a,b) is residual sum of squares of combined datasets 1 and 2 with degree of freedom (d.f) = 2 ; RSS (a1,b1,a2,b2) is sum of residual variations of data 1 with d.f = n1-2 and data 2 with d.f = n2-2.
2.5. Stability of breeding values
Following the method used by Nagy et al. (2013b) the stability of evaluated breeding values using the different models was evaluated with Spearman rank correlations and also by comparing the concordance between the top-ranked 100 rabbits across the models. Ranking the animals was performed and according to each models 100 rabbits with the highest breeding values were selected. Then it was analysed that among the best rabbits how many common animals can be found.
3. Results
1. D-loop mtDNA diversity and additive models with cytoplasmic and mtDNA haplotype effects and the fit of the models
Although with controversial results the effects of the mitogenome variation on economically important traits have been reported in a number of animal domestic species. Here, in three Pannon rabbit breeds (Pannon Ka, Pannon Large and Pannon White) we have estimated the contribution of cytoplasmic and D-loop mtDNA sequence effects on litter size traits. This type of analyses has been performed in rabbit populations for the first time. The observed effects of both estimates, coming from cytoplasmic or D-loop mtDNA variation, were negligible. The lack of complete mitogenome polymorphism, as suggested from the analysis performed on the D-loop mtDNA sequence, is the most likely explanation for the observed results.
Figure 1. Median-joining network diagram showing phylogenetic positions of haplotypes found in Pannon Ka, Pannon Large and Pannon White rabbits with respect to haplotypes found in other wild and domestic rabbit populations (see the legend for a detailed description). Diagram was constructed based on mtDNA haplotypes identified by polymorphism analysis of a 332-bp fragment of mtDNA (RRS: NC001913 positions 15492–
15824). Circles are proportional to haplotype frequency, the black points represent hypothetical sequences that were not observed, while the number of mutations separating nodes are given near branches in parentheses.
Names of the presented haplotypes contain identification, accession number and origin (abbreviation) with the exception of Pannon breeds that are given by full name.
2. Additive models without cytoplasmic and mtDNA haplotype effects and the fit of the models
- Genetic parameters and genetic trends for the number of kits born alive (NBA), number of kits born dead (NBD) and the total number of born kits were estimated in 6269 kindling records (collected between 2004-2015) of 1469 Pannon Large does inseminated with the sperm of 686 bucks; 21060 kindling records (collected between 1992-2016) of 4926 Pannon White (PW) does inseminated with the sperm of 1414 PW; 15833 kindling records (collected between 1999-2016) of 3691 PK does inseminated with the sperm of 1096 PK bucks. Using the REML method 12 single trait models were examined.
- Heritability estimates were low for all traits and ranged between 0.07-0.08± 0.018-0.021 for NBA, 0.01-0.02± 0.009 for NBD and 0.04-0.05± 0.015-0.018 for TNB of PL; ranged between 0.06-0.07±0.01 for NBA, 0.019-0.020±0.003-0.004 for NBD and 0.07±0.01 for TNB of PW; ranged between 0.07-0.09±0.01 for NBA, 0.03±0.01 for NBD and 0.07- 0.10±0.01 for TNB of PK.
- The ratios of the permanent environmental variances exceeded of the heritability estimates and ranged between 0.11-0.16±0.016-0.018 for NBA, 0.06-0.07 ±0.014-0.015 for NBD and 0.11-0.17±0.014-0.017 for TNB of PL; ranged between 0.07-0.09±0.01 for NBA, 0.06- 0.07±0.008-0.013 for NBD and 0.07-0.10±0.01 for TNB of PW; ranged between 0.07- 0.11±0.01 for NBA, 0.02-0.03±0.01 for NBD and 0.07-0.11±0.01 for TNB of PK.
- When characterizing the goodness of models bias values were practically zero for all traits, models and all breeds. After identifying the best fitted model (containing parity, age of the doe and year-month of kindling effects) it was extended with dominance effects for all breeds.
3. Non-additive models and genetic trends
- As a result, heritability estimates decreased to 0.06 ± 0.028 for NBA, 0.02 ±0.012 for NBD and 0.02± 0.022 for TNB of PW; 0.06±0.01 for NBA, 0.02±0.01 for NBD and 0.06±0.01 for TNB of PW; 0.06±0.01 for NBA, 0.02±0.01 for NBD and 0.06±0.80for TNB of PK.
- The relative importance of the permanent environmental effects also decreased to
NBA, 0.008±0.005 for NBD and 0.08±0.001 for TNB of PW; 0.08±0.01 for NBA, 0.01 ± 0.01 for NBD and 0.09 ± 0.87for TNB of PK.
- Ratios of the dominance effects exceeded those of the heritability estimates and amounted to 0.27 ±0.024 for NBA, 0.05 ±0.013 for NBD and 0.38±0.025 for TNB of PL; 0.09 ± 0.01for NBA and 0.08±0.01 for TNB of PW; 0.16±0.01 for NBA,0.1±0.01 for NBD and 0.15± 0.69 for TNB of PK.
- On the contrary for NBD (PW) ratio of the dominance effects was smaller than the heritability estimates 0.01±0.002.
- When compared to the additive model, the model including dominance showed some confounding with additive genetic and with permanent environmental effects and reduced calculated genetics trends (0.035 vs 0.03, -0.0017 vs -0.003 and 0.016 vs 0.01 for NBA, NBD and TNB, respectively) of PL; (0.027 vs 0.026, 0.0003 vs -0.0004 and 0.0258 vs 0.0255 for NBA, NBD and TNB, respectively) of PW; (0.05 vs 0.06, -0.001 vs -0.0016 and 0.06 vs 0.07 for NBA, NBD and TNB, respectively) of PK.
4. Stability of breeding values
- Spearman rank correlation coefficients between breeding values of the additive and dominance models were high for all traits (0.96-0.98) of PL; (0.99) of PW; (0.98-0.99) of PK.
When dominance effects were included some re-ranking was observed among the top ranked animals for every trait.
4. Conclusions and suggestions
Based on the results the following conclusions can be drawn.
1. In three Pannon rabbit breeds (Pannon Ka, Pannon Large and Pannon White) the contribution of cytoplasmic and D-loop mtDNA sequence effects on litter size have been estimated. This type of analyses has been performed in rabbit populations for the first time.
The observed effects of both estimates, coming from cytoplasmic or D-loop mtDNA variation, were negligible.
2. Diversity of genetic parameters were shown based on comparing 12 models with different fix effects and the structures of the “best” models contain parity, age of the doe and year- month of kindling effects for three Pannon rabbit breeds.
3. In the Pannon rabbit breeds’ population, heritability estimates were low for all traits. The ratios of the permanent environmental and the phenotypic variances exceeded of the heritability estimates for PL whereas that of ratios were showed the different levels with those heritabilities for PW and PK.
4. Extended models with dominance effects on litter size traits, heritability, permanent environmental effects estimates and genetics trends decreased for all breeds. Ratios of the dominance effects exceeded those of the heritability estimates for all breeds. On the contrary for NBD (PW) ratio of the dominance effects was smaller than the heritability estimates.
Thus inclusion of dominance effects in the model was justified.
5. In these studies neglecting dominance effects resulted in an overestimation of additive genetic variances and genetic trends because some confounding with additive genetic and with permanent environmental effects were found. Spearman rank correlation coefficients between breeding values of the additive and dominance models were high 0.96-0.99 for all traits and all breeds and the re-ranking certain differences were found among rabbits selected as top ranked animals.
Based on the numerous studies it can be concluded that dominance effects are important due to some above mentioned changes and should be included in animal models in the course of
dominance effects will appear in other random effects such as additive genetic effects or permanent environmental effects thus breeding value estimation becomes less precise.
However it has to be kept in mind that precise estimation of dominance effect requires large datasets, large number of full sibs and time consuming process. Moreover, the magnitude of potential benefits of the introduction or alteration of mitogenome variation in the rabbit breeding remains an open question for future research.
5. New scientific results
1. The structures of the “best” models contain parity, age of the doe and year-month of kindling effects for three Pannon rabbit breeds to estimate the genetic parameters, predict the breeding values for litter size traits.
2. Heritability estimates were low for all traits and ranged between 0.07-0.08± 0.018- 0.021 for NBA, 0.01-0.02± 0.009 for NBD and 0.04-0.05± 0.015-0.018 for TNB of Pannon Large rabbits; ranged between 0.06-0.07±0.01 for NBA, 0.019-0.020±0.003- 0.004 for NBD and 0.07±0.01 for TNB of Pannon White rabbits; ranged between 0.07-0.09±0.01 for NBA, 0.03±0.01 for NBD and 0.07-0.10±0.01 for TNB of Pannon Ka rabbits.
3. Ratios of dominance to phenotypic variance were 0.27 ± 0.024 for NBA, 0.05 ± 0.013 for NBD and 0.38 ± 0.025 for TNB of Pannon Large rabbits; 0.09 ± 0.01 for NBA, 0.01 ± 0.002 for NBD and 0.08 ± 0.01 for TNB of Pannon White rabbits; 0.16 ±0.01 for NBA, 0.1 ± 0.01 for NBD and 0.15 ± 0.69 for TNB of Pannon Ka rabbits.
4. The predicted genetics trends with and without dominance effects were low (0.035 vs 0.03, -0.0017 vs -0.003 and 0.016 vs 0.01 for NBA, NBD and TNB, respectively) of Pannon Large rabbits; (0.027 vs 0.026, 0.0003 vs -0.0004 and 0.0258 vs 0.0255 for NBA, NBD and TNB, respectively) of Pannon White rabbits; (0.05 vs 0.06, -0.001 vs -0.0016 and 0.06 vs 0.07 for NBA, NBD and TNB, respectively) of Pannon Ka rabbits. Spearman rank correlation coefficients between breeding values of the additive and dominance models were high for all traits (0.96-0.99) and breeds.
6. Publications on the subject of the dissertation
Papers published in peer-reviewed journals
Nguyen T.N., Nagyné Kiszlinger H. (2016): Dominance effects in domestic populations.
Acta Agraria Kaposváriensis, 20: 1-20.
Nguyen T.N., Farkas J., Szendrő Zs., Nagy I. (2017): Genetic evaluation of litter size traits in Pannon Large rabbits. Anim. Sci. Papers and Reports (In Press), 35: 181-192.
Nguyen T.N., Farkas J., Szendrő Zs., Nagy I. (2017): Genetic Evaluation of litter size traits in Pannon White rabbits. Agric. Conspec. Sci., (accepted).
Nguyen T.N., Brajkovic V., Cubric-Curik V., Ristov S., Veir Z., Szendrő Zs., Nagy I., Curik I. (2017): Analysis of the impact of cytoplasmic and mitochondrial inheritance on litter size and carcass in rabbits. World Rabbit Sci., (under review).
Full-length conference papers in proceedings
Nguyen T.N., Farkas J., Matics Zs., Nagy I. (2016): Comparisions of animal models evaluating the litter traits of the pannon large rabbits. 28. Nyultenyesztesi Tudomanyos Nap, Kaposvar, 33-38.
Nguyen T.N., Curik I., Farkas J., Szendrő Zs., Nagy I. (2017): Genetic Evaluation of litter size traits in Pannon Ka rabbits. Animal Science Days, Brandlucken, Austria (under review).
Publications not related to the dissertation
Nagyné Kiszlinger H., Nguyen T.N., Farkas J., Kover G., Nagy I. (2015): Genetic parameters and breeding value stability estimated from a joint evalution of purebred and crossbred sows for litter weigh at weaning. Acta Agraria Kaposvariensis, 19: 1-7.
CS
AgAgrriiccuullttuurraaee CCoonnssppeeccttuuss SScciieennttiiffiiccuuss :::: PPoolljjoopprriivvrreeddnnaa zznnaannssttvveennaa ssmmoottrraa :::: SSiinnccee 11888877ISSN 1331-7768 (print) :: ISSN 1331-7776 (online) :: http://acs.agr.hr/
Editorial Board: University of Zagreb, Faculty of Agriculture, Svetošimunska 25, HR-10000 Zagreb, Croatia :: e-mail: acs@agr.hr
Zagreb, May 11th, 2017
Dr. István Nagy
University of Kaposvár
40 Guba S. str., H-7400 Kaposvár, Hungary
Dear Dr. Nagy
I am glad to inform you that your manuscript No. 1221 entitled "Genetic evaluation of litter size traits in Pannon White rabbits" has been accepted for publication in Agriculturae Conspectus Scientificus as an Original Scientific Paper.
Thank you for your interest in Agriculturae Conspectus Scientificus. I am looking forward to collaborating with you in the future.
Kind regards,
Professor Zlatko Šatović ACS Editor in Chief
Prof. dr. sc. Zlatko Šatović ACS Editor in Chief