KAPOSVÁR UNIVERSITY
THESES OF DOCTORAL (PhD) DISSERTATION
ZOLTÁN SIPICZKI
KAPOSVÁR
2019
THESES OF DOCTORAL (PhD) DISSERTATION
KAPOSVÁR UNIVERSITY FACULTY OF ECONOMIC SCIENCE
Department of Finance and Economics
Head of the doctoral school Prof. Dr. Imre Fertő
Professor
Tutor
Dr. Anett Parádi-Dolgos PhD Associateprofessor
ISHUNGARIAN AGRICULTURE PROFITABLE?
MADE BY:
ZOLTÁN SIPICZKI
KAPOSVÁR
2019
DOI: 10.17166/KE2019.004
1. RESEARCH BACKGROUND AND OBJECTIVES
The topic of the dissertation is to examine the profitability of Hungarian agricultural enterprises. My aim is to define which production directions, farm sizes and sectors are particularly vulnerable to the possible reduction of the agro subsidies.
The study will help fill the research gap that identifies factors determining the profitability of Hungarian agri-businesses in the period between 2006 and 2015.
One of the strategic issues was that the EU budget after 2020, and thus the structure of agricultural subsidies, is still extremely uncertain.
It is unlikely that the aid will be completely abolished, however, in my opinion a significant transformation is expected, so making production as competitive as possible till then is very important.
The study can help individual farmers differentiate their production and help domestic agricultural policy. Both in the crop and livestock sectors, there is a need for a restructuring that will ensure that the agricultural sector is determined by professionally organized agrarian companies.
Research is based on data from the Agricultural Accountancy Data Network (FADN), operated by the Agricultural Research Institute (hereinafter: AKI).
2. The objectives of the dissertation
In order to increase the employment and population of rural areas, it is important to make the agro-sector effective and profitable. For this, a significant increase in investment and development is essential, however, a significant proportion of the sector's actors does not have enough resource to implement the development.
The purpose of my dissertation is to reveal the specificities of the profitability of agricultural enterprises, and to propose how to make this sector a financially efficient and profitable one. My aim is also to make suggestions that can be used in practice.
2.1. Hypotheses
It is vital that this segment should be provided with a flexible, but relatively cheap money source for its several unique needs. To strengthen the country's rural areas, it is essential to strengthen the agricultural SME sector.
My first hypothesis focuses on how the leverage has affected the profitability of agricultural operators, since the interest rate gap of the funds cost was relatively high compared to the yields until 2013. In contrast, since 2013, the level of interest on loans and other fund resources has decreased significantly.
1. Hypothesis
Because of the low interest rates, agribusinesses are increasing their liability stock against equity financing, especially in favour of long- term foreign liabilities
My 2. hypothesis is a liquidity-related assumption. The aim is to determine the optimum liquidity rate in the agricultural sector, based on empirical data. The optimal measure in this case means achieving higher profitability than the same category of companies. A too low liquidity rate can cause insolvency, and a too high one a not effective condition.
2. Hypothesis
An optimum liquidity ratio in the agricultural sector can be determined, which results in higher profitability.
According to my 3. hypothesis, large-scale agricultural businesses can achieve greater profitability through more efficient labour management and better use of assets due to economies of scale.
According to previous research, there is no clear link between farm size and technical efficiency - and thus profitability, some of the results are positive, while others show a negative relationship. However, research is less often examined by profitability in terms of farm size and production type, so this viewpoint was important for this assumption.
3. Hypothesis
In Hungary, large-scale agricultural businesses achieve higher profitability than small-scale agricultural businesses.
According to my 4. hypothesis, Hungarian agricultural enterprises cannot realize an economic profit besides the alternative cost of equity. As it can be read in the dissertation later: the agricultural sector differs significantly from the other sectors from the point of view of the equity side.
It is more typical to operate from equity, so we also need to take into account the alternative cost of equity. In my opinion, it is important to examine the alternative cost of equity as a modifying factor. EVA-type economic ratio calculation helps to solve this problem.
4. Hypothesis
Hungarian agricultural enterprises were unable to realize economic profit with alternative cost of equity, between 2013 and 2015.
3. Methods
The database used in the dissertation is the agricultural database operated by the Agricultural Research Institute.
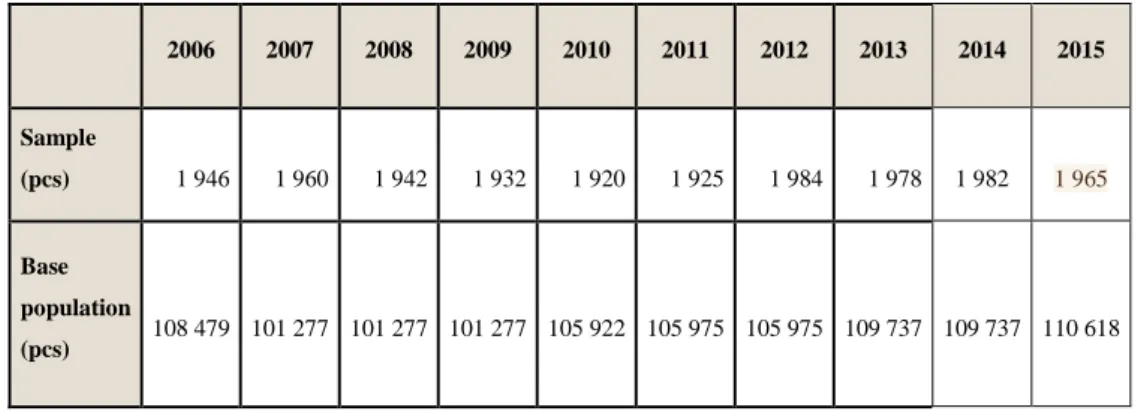
1. table The number of the agricultural farm sample operated by the Agricultural Research and Information Institute and the number of
Hungarian farmers in the period 2006-2015
2006 2007 2008 2009 2010 2011 2012 2013 2014 2015
Sample (pcs)
1 946
1 960
1 942
1 932
1 920
1 925
1 984
1 978
1 982
1 965
Base population (pcs)
108 479
101 277
101 277
101 277
105 922
105 975
105 975
109 737
109 737
110 618
Source: Based on AKI data, own calculation
I used the R +, STATA and Microsoft Office Excel programs for the research.
The study has shown that regressions and multivariate methods can be used well in the database with caution.
For the formulation of the first three hypotheses, I applied linear regression calculation, using classical descriptive statistical and econometric methods.
Regression calculation allows us to establish a linear relationship between a dependent and several independent variables by constructing a linear model.
As a database of modelling, I worked out the data of the year 2015 data of the agri-business AKI database. The 1965 company's balance sheet and profit and loss statement represent a representative sample of agricultural economy.
I explained the explanatory power of the model (R2), the significance of independent variables. During the dissertation, I attributed a greater
importance to the sign of the relationship between the variables, according to the literature, than the numerical magnitude.
The basic equation of the model as a multivariate linear regression model:
Y = 0 + 1x1 + 2x2 + 3x3 + … + nxn + , where Y is the dependent factor,
Xi are the independent factors (i= 1 … n)
i are partial regression coefficients (i= 1 … n) and
indicates a random factor.
During model construction, I sought an optimal balance between economy and good approximation. In literature descriptions and in the model construction, the "Revenue Proportionary Taxation Profit" variable was determined by the following dependent variables:
X1: Subsidies to Revenue X2: Cost / Rev
X3: Equity ratio for balance sheet total X4: Cash to Revenue
X5: Size
Therefore, my earlier hypotheses were also aimed at a more precise determination of these factors.
Concerning the fourth hypotheses, profitability, besides the alternative cost of equity, - I strictly examined the income generating capacity of agriculture without other financial transactions; therefore, a modified indicator was needed, which would highlight the profitability of agricultural activity.
This indicator is the unit cost to unit sales (hereinafter referred to as "Cost / Rev"), a revised profitability indicator. This was also used previously (Gorton et al., 2003). In the "Cost / RevS" indicator, we add the non-refundable subsidies to the net sales revenue, so "I introduced" the soft budget constraint.
"Cost / RevS": The total of the Operational Costs divided by (Sales Net Sales + Subsidies received without repayment), so it is still a kind of simplified indicator for operating profit, but approaches the real profitability situation if we do not have a hard budget constraint, but we have a soft budget: and we include subsidies in revenue as well.
For the "AltCost / RevS" indicator, the alternative cost on equity is also taken into account. I also examined the relative standard deviation of the indicators by farm size. In the case of relative spraying, the smallest farm size was the least homogeneous group, so it was important to examine this size category further. This was done by a cluster analysis.
During the cluster analysis I considered the individual farms and agrocultural firms separately because their characteristics differ significantly (Figure 1). Because of the larger sample size of smaller farm sizes and the higher number of population, as well as the fewer outlier, - such as the boxplot running on the turnover variable, - it was more appropriate to look at this category to focus on individual farms.
Figure 1. Boxplot for Sales of individual farms
Source: Based on AKI data, own calculation
Separately from the whole sample, individual farms are still highly heterogeneous, so their cluster analysis was necessary. My goal was to highlight the companies that were more profitable than the average values of the farm size category.
The clustering process can be hierarchical and non-hierarchical. During the clustering process, I first chose hierarchical clustering to determine the number of clusters. Subsequently, the non-hierarchical clustering methods applied the k-median method. The size of the sample justified non-hierarchical clustering, and in my opinion clusters are better characterized by medians than arithmetic meanings.
Table2. Variables Involved
name description unit
output Sales, includes subsidies without repayment thousand HUF
subs subsidies without repayment thousand HUF
land All areas used by the farm hectare
totala All assets thousand HUF
persubs Proportion of subsidies from sales percentage perrland Land rented to all areas ratio percentage percrop Arable crop sales from all sales (non-subsidized release) percentage
hhi Herfindahl index -
leverage Leverage -
renou Land rent and interest divided by output percentage rengm Land rent and interest divided by gross profits percentage Source: own editing The clustering process included the variables in Table 2, which were considered to be relevant by literature. The input variables used were always average values, the arithmetic mean of the three years (2013-2015). The variable "output" shows the net revenue of sales.
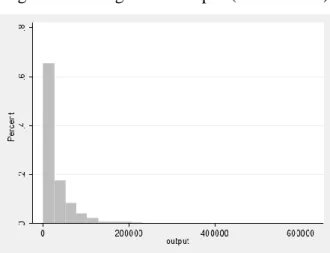
Figure 2. Histogram of output (net revenue)
Source: Based on AKI data, own calculation Almost 65% of individual farms had sales below HUF 20,000,000 and 95%
below 100,000,000 HUF during the examined period, according to the histogram shown in Figure 2.
Similar distribution can also be observed for the grants received and the area of operation. The variable "subs" clearly shows the average value of subsidies without repayment. The distribution of the variable is similar to the sales revenue. (Figure 3)
Figure. 3.Subs (variable sum of subsidies without repayment) variable percentage histogram
Source: Based on AKI data, own calculation
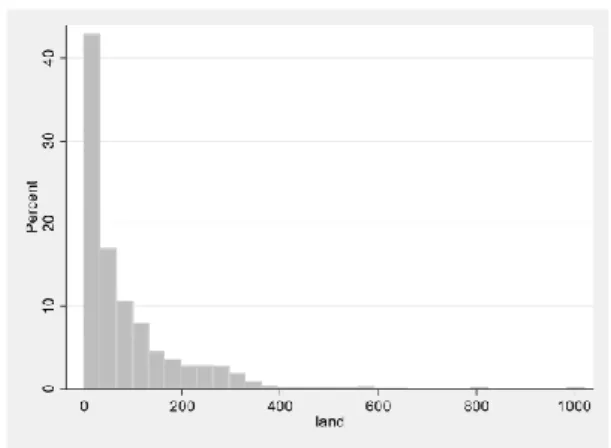
From the ratio of the subsidies and the sales revenue, we get "persubs". Crop production (KSH 2017) accounts for sixty percent of the total output of Hungarian agriculture, so a percentage of crop production from output ("percrop") is also a variable. The land used by the farm is also an important variable, which is to show the size of the farm. The distribution of the variable is shown in Figure 4. histogram.
Figure 4. The percent histogram of Land variable
Source: Based on AKI data, own calculation The rented areas (rland) also include free rented areas. The perrland shows how many percentages were rented compared to all land. The Herfindahl index (hhi) was used as a proxy for the diversification of farms.
Figure 4. HFI (Herfindahl index) variable percent histogram
Source: Based on AKI data, own calculation
The higher the value of the indicator is, the less the production diversification of the business is. According to the Herfidal Index, almost 40%
of the individual farms earn their total revenue only from one production type.
27% of businesses only conduct field crop production.
When calculating the ratio of the output per activity to total output, I raised them to squares and summarized them. Leverage is one indicator of financial risk. When calculating the leverage, I divided the balance sheet total with equity. The "renou" and "rengm " indicators include the risk of financial and leasing activities. Their calculation is shown in Table 4.
The statistics of the variables is listed in Table 3.
Table3. Statistics of the variables involved in cluster analysis
Variable Items Mean Dispersion Min Max
output 1 423 29 305 41 107 338 640 688
subs 1 423 8 328 11 205 0 158 120
land 1 423 87 111 0 1 020
totala 1 423 95 569 119 272 1 704 1 150 485
persubs 1 423 0,24 0,15 0,00 0,88
perrland 1 423 0,24 0,30 0,00 1,00
percrop 1 423 0,52 0,41 0,00 1,00
hhi 1 423 0,80 0,21 0,19 1,00
leverage 1 420 1,48 8,94 1,00 329,94
renou 1 423 0,03 0,04 0,00 0,33
rengm 1 423 0,11 4,33 -97,46 112,06
Source: Based on AKI data, own calculation
During the clustering process, I first chose hierarchical clustering to determine the number of clusters. Figure 6 also shows that six clusters are optimal. The non-hierarchical clustering process has classified 3 farms out of the clusters, so the total sample is made up of 1420 farms.
Figure 5. The dendogram of the clusters of the variables involved in the study
Source: Based on AKI data, own calculation With the help of the six clusters, it was possible to create well-separated groups (Figure 7), so the study of the unit cost per unit revenue was already possible with homogeneous groups in the 4th hypothesis (Results and Evaluation).
Figure 6. Twoway scatter plot with Cost / Rev and Output explanatory variable
Source: Based on AKI data, own calculation
4. Results
The basic question of research is to examine the factors determining the profitability of the agricultural sector. At this point, I conducted empirical testing of this relationship with the method of multivariate linear regression.
The multivariate linear regression is made up of the following elements:
independent variable:
Y: Pre-tax return to revenue dependent variables:
X1: Subsidy to revenue ratio X2: Cost / Rev
X3: Equity to balance sheet total ratio X4: Cash to revenue ratio
X5: Size
Y is the return to revenue ratio, the model will show the impact of each factor on this profitability ratio.
The relationship between the factors Y and X1 shows the effect of the Subsidy on profitability, it represents a possible channel for financing agriculture.
In the relationship between Y and X2, I strictly examined the income generating capacity of agriculture without any other factors (financial income, extraordinary results, etc.), therefore, a modified index was needed, which highlighted the profitability of agricultural activity. I chose the unit cost of sales ("Cost / rev"), which is a modified profitability index:
Cost / rev = (Total operating costs) / (Net sales revenue)
The equity ratio of X3 is probably negatively related to profitability, as the interest paid on liabilities typically decreases profitability, which reduces the
pre-tax profit. However, even a positive relationship is possible, given that higher sales revenue generally requires greater capital requirements and, in turn, means greater liabilities.
The variable X4 is designed to capture the company's liquidity. In the life of domestic agricultural enterprises, liquidity indicators are a key issue, and the direction of the relationship is not clear at all. It is easier to access the sources of liabilities, since they can maintain a higher rate of loans than their competitors, in addition to any other unchanged ones. However, holding too many liquid assets is ineffective, so even a negative link can be seen.
In the case of variable X5 known as „Size”, according to previous research, there is no clear link between farm size and technical efficiency - and thus profitability - some of the results are positive, while other estimates show a negative relationship.
Finally, five relevant factors in the model explained the Pre-tax return to revenue by 61.3%.
Table 4. Linear regression on Pre-tax return to revenue summary table in 2015
Y: Pre-tax return to revenue Coefficients
X1: Subsidy to revenue ratio 0.8532 **
X2: Cost / Rev -0.6359 **
X3: Equity to balance sheet total
ratio 0.0903 *
X4: Cash to revenue ratio 0.1856 **
X5: Size 0.0393 **
Constants 0.8136 **
N=1962 **: significant 1% significance level R2 =61,3 *: significant 10% significance level
Source: Based on AKI data, own calculation
„Pre-tax return to revenue” is mainly influenced by the change in agricultural subsidies, the effect is positive and the value is high. The change in the equity ratio also increases the profitability.
The value of profitability is higher where equity ratio is higher, and on the other hand the enterprise receives more support. The first link demonstrates the importance of internal accumulation, the second one justifies the close link between subsidy support and profitability.
For the "Cost / rev" ratio, the -0.64 coefficient indicates that if the value is below „1” the revenue is higher than the costs, so the agricultural enterprise is effective. So the negative value shows that higher "Cost / rev" reduces profitability.
It has been proved that the most important factors affecting profitability can be determined. For example, liquidity, the liability structure and the Subsidy system have a significant impact on the profitability. Based on the results, my hypotheses also concentrate on these features, first on the liability structure.
1. Hypothesis
Because of the low interest rates, agribusinesses are increasing their liability stock against equity financing, especially in favour of long- term foreign liabilities
Farms (Chart 8) typically have high equity ratios. One of the main reasons for the high equity ratio is that in the majority of the agricultural enterprises in the 90s the realized income was lower than the interest rates paid, and therefore, in the case of higher leverage suffered losses.
Conversely, in the low interest rate environment of 2010, this capital structure was a barrier to development and investment.
Figure 7. Composition of the liability side of agricultural enterprises (HUF billion) 2006-2015
Source: Based on the AKI database, own editing
The value of equity in the domestic agricultural sector grew slightly until 2010, but increased after 2010 (Chart 18). This is due to the fact that the profitability of the equity ratio increased from 7 to 11%. Meanwhile, due to the decrease in the interest rate at that time, they could increase their equity during this period.
The level of liabilities of agricultural enterprises increased nominally, but in relation to its balance sheet total, its weight decreased continuously between 2006 and 2015. This was due to the increase in equity (Chart 18).
Based on my first hypothesis, "Because of the low interest rates, agribusinesses are increasing their liability stock against equity financing,...", it is not true but important to examine the hypothesis's other claim: "... especially in favour of long-term foreign liabilities"
It is a logical assumption that they tend to turn to investment and long-term foreign liabilities with more favourable interest rates.
20 06
20 07
20 08
20 09
20 10
20 11
20 12
20 13
20 14
20 15 Saját tőke 2 31 2 21 2 57 2 85 3 20 3 61 3 95 4 31 4 70 5 04 Hosszú lejáratú kötelezettségek 275 252 274 267 249 254 178 230 233 237 Rövid lejáratú kötelezettségek 401 519 497 444 500 597 570 550 567 558
Egyéb forrás 169 151 195 152 138 115 123 140 131 123
- 1 000 2 000 3 000 4 000 5 000 6 000 7 000
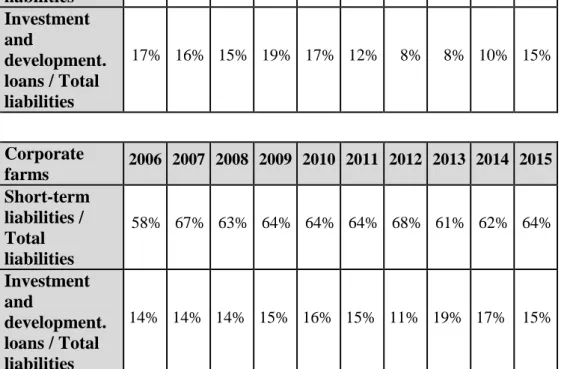
The disadvantage in Hungary is, based on the data, that the ratio of short-term liabilities within the liabilities increased from around 40% to over 60% over the period under review, against long-term liabilities (such as investment and development loans) (Table 5).
Table 5. The ratio of short-term liabilities, investment and development loans to total liabilities 2006-2015. according to firm type Individual
farms 2006 2007 2008 2009 2010 2011 2012 2013 2014 2015 Short-term
liabilities / Total liabilities
31% 41% 38% 34% 51% 63% 67% 64% 62% 58%
Investment and
development.
loans / Total liabilities
17% 16% 15% 19% 17% 12% 8% 8% 10% 15%
Corporate
farms 2006 2007 2008 2009 2010 2011 2012 2013 2014 2015 Short-term
liabilities / Total liabilities
58% 67% 63% 64% 64% 64% 68% 61% 62% 64%
Investment and
development.
loans / Total liabilities
14% 14% 14% 15% 16% 15% 11% 19% 17% 15%
Source: AKI database and own calculation
As can be seen from Table 5, the ratio of short-term liabilities (with generally higher interest rates) within liabilities also increased in case of individual and corporate enterprises. There was a particularly high rate of growth in individual
farms, where only 31% of total liabilities in 2006 were short-term, and each year has exceeded 60% since 2011 year.
Conversely, the volume of investment and development loans that are typically more favourable for expansion stagnated and even declined over the period under review. This decline was especially in case of smaller private farms:
However, the high rate of short-term debt is detrimental to agricultural economy due to the relatively higher interest rates and the shorter duration than the production cycle.
Based on the results, it has been shown that hypothesis 1 has not been proved and on the contrary: the ratio of short-term foreign liabilities has increased, especially among small-scale agricultural enterprises.
In the following I will focus on the relationship between liquidity and profitability. The basic idea of this chapter is that there is a close link between financing, liquidity and profitability in agriculture.
2. Hypothesis
An optimum liquidity ratio in the agricultural sector can be determined, which results in higher profitability.
Liquidity indicators of domestic agricultural companies are very high compared to other sectors, especially for individual farms (Figures 9 and 10).
They are able to cover multiple of their short-term liabilities from their current assets.
Figure 8. The 2006-2015 year liquidity rate according to the operation type
Source: Based on an AKI database based on own calculation
Figure 9.The 2006-2015 liquidity short-term ratio according to the operation type
Source: Based on an AKI database based on own calculation
A hypothesis of my study was that in the years 2006-2015 liquidity and profitability were closely related. The liquidity risk of agricultural enterprises must be brought into line with the profitability situation of businesses, since maintaining a sufficient liquidity presupposes profitable management.
0 1 2 3 4 5 6 7
2006 2007 2008 2009 2010 2011 2012 2013 2014 2015 Társas gazdaságok Egyéni gazdaságok
0 1 2 3 4 5 6 7
2006 2007 2008 2009 2010 2011 2012 2013 2014 2015 Társas gazdaságok Egyéni gazdaságok
In support of this connection, I have prepared Figure 11, where I have indicated the profitability of total capital on a vertical axis, and on the horizontal axis the liquidity rate can be read in the period examined according to the operation type.
Figure10. The link between liquidity and profitability according to the operation type
Source: AKI database and own calculation
My hypothesis 3 was to determine the relationship between optimal liquidity and high profitability based on empirical data.
According to my results, the relationship between liquidity and profitability is very different according to the operation type. Observations closer to origin include corporate data that have a positive correlation between liquidity and profitability. Thus, too low liquidity can be a barrier to lucrative corporate operations, but in our sample, with the 2.5 degree liquidity rate, the further profitability growth will stop and even slightly decrease. Individual farmers have extremely high liquidity ratios, in which case they have a stronger and negative relationship between liquidity and profitability.
Based on my results, the relationship between liquidity and profitability is initially positive, that is, if the organization holds too few liquid assets against
its liabilities, it has a negative impact on profitability. Increasing liquidity will then also increase the profitability at first. But the excessive liquidity holding will ultimately lead to deteriorating profitability, which is particularly relevant in agriculture in case of individual farms.
Agricultural profitability by farm size
According to my hypothesis 3, the advantage of large-scale agricultural enterprises – because of the efficient management of labour and the better utilization of tools - have more efficient cost management. My expectation is that, with regard to profitability, greater farm size causes greater profitability.
3. Hypothesis
In Hungary, large-scale agricultural businesses achieve higher profitability than small-scale agricultural businesses.
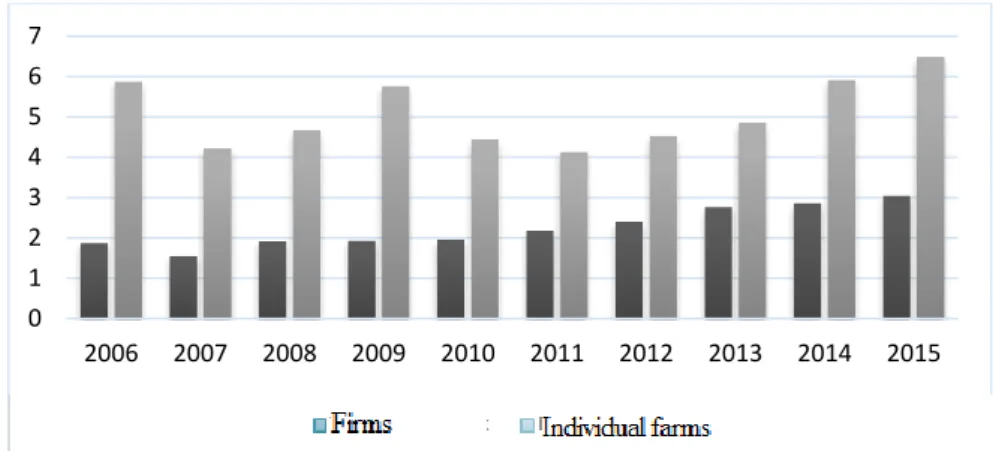
There is significant difference between profitability of the three main size groups of private farms. The profitability ratio of small individual farms during the period under review was 8.2% and 7.5% on average. In the case of medium- sized individual farms, the above figures were 13% and 11.6%, while large individual farms achieved 16% return on equity ratio and 13.8% total return on capital. The profitability of individual farms is greatly dispersed among size categories. The comparison of the results is shown in Figure 12.
Figure 12: Profitability of capital in agriculture by individual farms and by size (%)
Source: AKI database and own calculation
The difference between profitability of small and large individual farms is caused by several factors. The emergence and expansion of multinational companies have completely transformed the agricultural sales verticum, placing domestic agricultural enterprises, including small producers, into a more competitive position. Another problem is the hectic profitability, which unables to bridge to agro-small farmers with lack of sufficient capital strength.
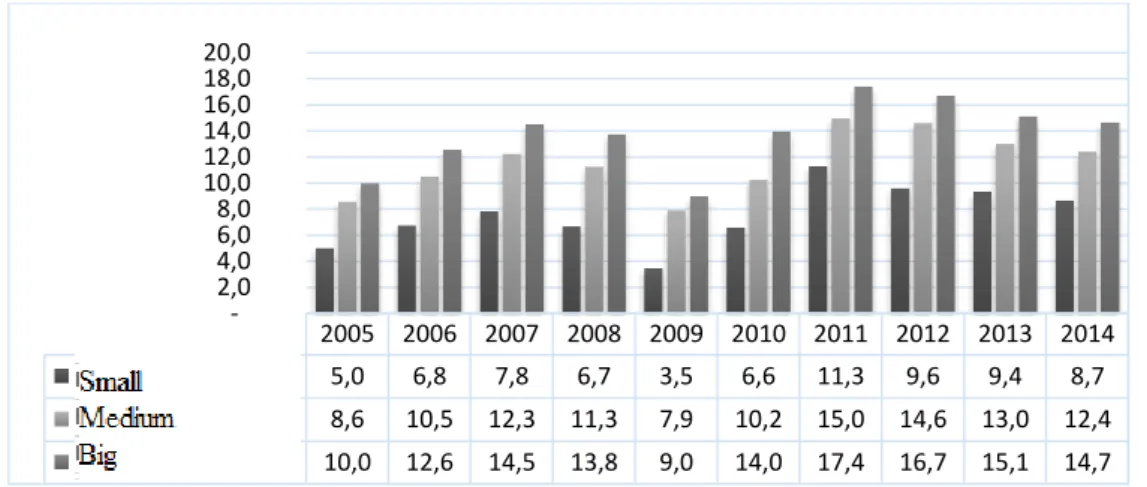
Figure 13 shows that the tendency observed in individual farms is less strong in case of corporate enterprises. Here (Figure 13) there is no clear trend in profitability.
2005 2006 2007 2008 2009 2010 2011 2012 2013 2014 Kicsi üzemméret 5,0 6,8 7,8 6,7 3,5 6,6 11,3 9,6 9,4 8,7 Közepes üzemméret 8,6 10,5 12,3 11,3 7,9 10,2 15,0 14,6 13,0 12,4 Nagy üzemméret 10,0 12,6 14,5 13,8 9,0 14,0 17,4 16,7 15,1 14,7
2,0 - 4,0 6,0 10,0 8,0 12,0 14,0 16,0 18,0 20,0
Figure 11. Profitability of total capital among corporate farms by company size
Source: AKI database and own calculation
It is worth examining the profitability of agricultural enterprises, not only in terms of size but also in terms of activity type.
Table 6. Profitability of the total capital of agricultural enterprises by farm size and activity type
2006-2015 average Small Medium Large Grazing livestock 5,9% 10,8% 12,4%
Poultry holders 4,7% 9,5% 6,4%
Fruit growing 5,4% 6,3% 9,1%
Pork holders 4,6% 7,1% 1,3%
Outdoor vegetable growing 16,7% 19,3% 11,3%
Arable crop production 8,3% 13,3% 11,5%
Grape Production 5,5% 4,3%
Milk producers 8,1% 13,7% 7,8%
Mixed 7,2% 11,1% 8,3%
Vegetable 8,7% 16,6%
Source: Based on AKI database, own calculation
Table 6 shows that the profitability shows a mixed picture of farm size and production type among agricultural enterprises. On the basis of the eleven-year
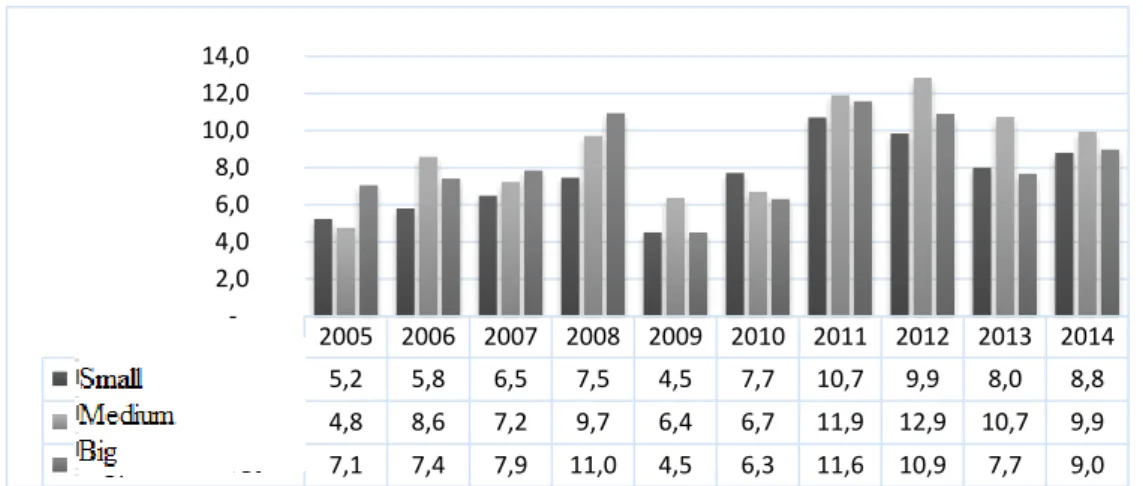
2005 2006 2007 2008 2009 2010 2011 2012 2013 2014 Kicsi üzemméret 5,2 5,8 6,5 7,5 4,5 7,7 10,7 9,9 8,0 8,8 Közepes üzemméret 4,8 8,6 7,2 9,7 6,4 6,7 11,9 12,9 10,7 9,9 Nagy üzemméret 7,1 7,4 7,9 11,0 4,5 6,3 11,6 10,9 7,7 9,0
- 2,0 4,0 6,0 8,0 10,0 12,0 14,0
average, the most profitable production types were vegetable growing and arable crop production.
The worst profitability was realized by fruit growing farms, pork holders and fruit growers. Data do not show clear evidence between 2006 and 2015 that greater profitability was caused by larger scale. However, it is important to point out that the scattering of total profitability data is typically higher among medium-sized than small-scale agricultural enterprises.
Table 7. The standard deviation of the profitability of capital for agricultural enterprises by size and production type for 2006-2015
2006-2015 deviation Kis Közepes Nagy
Grazing livestock 3,3% 2,6% 4,1%
Poultry holders 4,9% 5,7% 4,1%
Fruit growing 4,8% 3,5% 5,0%
Pork holders 6,2% 9,6% 3,5%
Outdoor vegetable
growing 8,5% 4,0% 0,0%
Arable crop
production 2,6% 2,8% 3,6%
Grape Production 3,8% 3,1% 2,1%
Milk producers 3,7% 2,8% 2,1%
Mixed 2,6% 2,3% 2,3%
Vegetable 5,2% 8,3% 0,0%
Source: Based on AKI database, own calculation
This is explained by the fact that larger businesses use insurance services more frequently and invest more in the plant protection of products and varieties caused by drought, frost or other natural damage. In that year their profitability decreases, but over the years they get much more predictable cash flow than their small-sized farms.
I consider my hypothesis 3 to be partially accepted. The benefits of large scale farms are greater labour efficiency and better utilization of tools, resulting in
more cost-effective management. It can be stated that in the case of individual farms, profitability is higher for larger size, while for corporate farms the benefit of economies of scale is already decreasing.
However, it cannot be adjusted for each activity direction to have greater profitability for larger size. That is why I have further investigated other factors that determine the profitability of agricultural businesses, such as the alternative cost of equity and agricultural subsidies.
The profitability of Hungarian agricultural enterprises in addition to the alternative cost of equity
According to my 4. hypothesis, Hungarian agricultural enterprises were unable to realize economic profit between 2013 and 2015 in addition to the alternative cost of equity. The question is that the agricultural sector has a significantly different source-side composition from other sectors.
Indicator (1) is one of the most widespread profitability ratios that AKI also uses.
(𝑝𝑟𝑒 − 𝑡𝑎𝑥 𝑝𝑟𝑜𝑓𝑖𝑡 + 𝑖𝑛𝑡𝑒𝑟𝑒𝑠𝑡 𝑝𝑎𝑖𝑑) / (𝑇𝑜𝑡𝑎𝑙 𝑙𝑖𝑎𝑏𝑖𝑙𝑖𝑡𝑖𝑒𝑠) (1)
The pre-tax profit is influenced by a large number of variables, such as different tax rules within the sector, financial and interest income. First, I strictly examined the income-generating capacity of agriculture without any other factors (financial, extraordinary results, etc.), so a modified indicator was needed, which accentuates more the profitability of agricultural activity. There was a need for an indicator that would not be influenced by the results of the financial transactions or the possible tax burdens that might differ. I chose the unit cost of unit sales (hereinafter referred to as "Cost / rev"), which is a modified profitability index:
𝐶𝑜𝑠𝑡/𝑟𝑒𝑣 = (𝑇𝑜𝑡𝑎𝑙 𝑜𝑝𝑒𝑟𝑎𝑡𝑖𝑛𝑔 𝑐𝑜𝑠𝑡𝑠) / (𝑁𝑒𝑡 𝑠𝑎𝑙𝑒𝑠 𝑟𝑒𝑣𝑒𝑛𝑢𝑒) (2)
So it is a kind of simplified indicator of operating result: if it is below one value, the agricultural enterprise's sales revenue exceeds the operating costs, if the value of the indicator is above „1” the costs have more value than the sales revenue.
Based on the results of regression analysis presented at the beginning of the chapter, the two main factors affecting profitability are agricultural subsidies and Cost / rev (Total operating costs) / (Net sales revenue). Therefore, it is worth introducing the "Cost / revS" indicator, where we add the non-refundable subsidies to the net sales revenue, thus "introducing" the soft budget constraint.
"Cost / RevS": Total Operating Costs divided by the Net Asset Sales and non-refundable subsidies, so it is still a kind of simplified indicator for operating profit but it is closer to reality. We take into account the profitability situation, assuming a soft budget constraint instead of a hard budget constraint.
In this case:
𝐶𝑜𝑠𝑡/𝑟𝑒𝑣𝑆 = (𝑇𝑜𝑡𝑎𝑙 𝑜𝑝𝑒𝑟𝑎𝑡𝑖𝑛𝑔 𝑐𝑜𝑠𝑡𝑠) / (𝑁𝑒𝑡 𝑠𝑎𝑙𝑒𝑠 𝑟𝑒𝑣𝑒𝑛𝑢𝑒 + 𝑁𝑜𝑛 − 𝑟𝑒𝑓𝑢𝑛𝑑𝑎𝑏𝑙𝑒 𝑠𝑢𝑏𝑠𝑖𝑑𝑖𝑒𝑠) (3)
Even if the value of the indicator is below one in case of the "Cost / revS"
indicator, the revenue increased by the subsidies exceeds the operating costs, so the agrarian business is profitable.
The farm size of the agricultural enterprise was measured in the full standard production value (STÉ) of the agricultural enterprise as set out in the
"Methods" section.
Table 8. Cost / rev "(Total operating costs) / (Net sales revenue)"
Profitability indicator by size of farm 2006-2015
Year \ Size 2006 2007 2008 2009 2010 2011 2012 2013 2014 2015 Small farm size 1,45 1,86 1,54 1,67 1,7 1,48 2,13 1,38 1,68 1,44 Medium farm size 1,24 1,36 1,23 1,36 1,28 1,32 1,56 1,18 1,12 1,18 Large farm size 1,19 1,19 1,19 1,27 1,25 1,14 1,13 1,18 1,15 1,2
Source: Based on AKI data, own calculation Table 8 shows that regardless of farm size, the Hungarian agriculture sector is unprofitable without subsidies (Cost / rev). In the case of small farm size, they represent one and a half times more costs than net sales. The costs of medium and large-sized companies are "only" twenty to thirty percent higher than their net sales.
Figure 12. "Cost / rev" ratio by size of farms 2006-2015
Source: Based on AKI data, own calculation
The "Cost / rev" ratio did not fall below 1, so the net sales of farmers were fewer than the operating costs. Moreover, over the years, there is no improvement in trend, so efficiency is almost stagnant.
Table 9. "Cost / revS" (Total operating costs) / (Net sales revenue + Non- refundable subsidies) "profitability indicators by size of farm, 2006 -2015 Year \ Size 2006 2007 2008 2009 2010 2011 2012 2013 2014 2015 Small farm
size 1,01 1,27 1,07 1,09 1,07 0,95 1,09 0,94 0,99 0,97 Medium
farm size 0,9 0,96 0,91 0,91 0,85 0,8 0,79 0,78 0,77 0,79 Large farm
size 0,98 0,98 0,97 1,01 0,96 0,92 0,92 0,94 0,92 0,97 Source: Based on AKI data, own calculation For the "Cost / revS" indicator, small and large farms realized small, but positive profit, while medium-sized agricultural enterprises achieved relatively high profits.
Figure 13. "Cost / revS" Profitability indicator by size of farm 2006-2015
Source: Based on AKI data, own calculation
Over the years, there is an upward trend: revenue increased by subsidies exceeds expenditure. As a result, the agricultural sector become profitable on average, but just because of the effect of subsidies.
As in Cost / Rev and Cost / RevS time series, Figures 14 and 15, at 1.29 Cost / rev and 0.94 Cost / revS at the beginning of the period under review; In 2015, the value of indicators was similar, 1.24 Cost / rev and 0.85 Cost / revS.
Thus, the sector had a loss on average, but with subsidies it become profitable.
In my opinion, it is necessary to look at the more realistic profitability of domestic agriculture, so I have taken into account the alternative cost of equity calculated on the basis of traditional capital costs.
I introduced the "AltCost / RevS" index, which includes an alternative cost accounted for own funds. The expected return on equity was determined on the basis of the average of the base rates of the Hungarian central bank in years of 2013, which was 4.31%; 2.56% in 2014; in 2015 1.73%. Typically, as a risk- free (expected) yield, government bond yields, BUBOR, inflation or central bank base rates are commonly pointed out in literature (Damodaran, 1999).
I chose the average of the central bank's base rate because it represents the usual interest rate well. The expected return on equity in agriculture is certainly higher than the central bank base rate, but due to the heterogeneous Hungarian agricultural structure, the research would require specific yield expectations for each sector due to different regional, farm size and capital structure.
However, many expected return would no longer be suitable for objective testing.
On the other hand, I compared farms with low leverage and farms with relatively more leverage. With an exaggerated example: an agricultural farm which finances its activity mainly from liability, pays the interest cost of the external funds, but another agricultural farm with only equity should expect
more profit because it finances its activity mainly from own funds (alternative cost).
I have transformed this ratio as a quotient, scale-independent indicator.
𝐴𝑙𝑡𝐶𝑜𝑠𝑡/𝑟𝑒𝑣𝑆 = (𝑇𝑜𝑡𝑎𝑙 𝑂𝑝𝑒𝑟𝑎𝑡𝑖𝑛𝑔 𝐶𝑜𝑠𝑡𝑠 +
𝐸𝑞𝑢𝑖𝑡𝑦 𝐴𝑙𝑡𝑒𝑟𝑛𝑎𝑡𝑖𝑣𝑒 𝐶𝑜𝑠𝑡) / (𝑁𝑒𝑡 𝑆𝑎𝑙𝑒𝑠 𝑅𝑒𝑣𝑒𝑛𝑢𝑒 + 𝑁𝑜𝑛 − 𝑟𝑒𝑓𝑢𝑛𝑑𝑎𝑏𝑙𝑒 𝑠𝑢𝑏𝑠𝑖𝑑𝑖𝑒𝑠) (4)
Table 10. "Cost / Rev", "Cost / RevS" and "AltCost / RevS" Profitability Indicators by Business Size in 2015
Size: Cost / rev (expenses) /
(revenue)
Cost / Revs (expenses) / (revenue
+ subsidy)
AltCost / revs:
(costs + alternative costs) / (revenue +
subsidy)
small 1,44 0,97 1,02
medium 1,18 0,79 0,83
large 1,20 0,97 0,99
On average, 1,25 0,85 0,90
Source: Based on AKI data, own calculation
Table 10 shows that the Hungarian agricultural sector is unprofitable regardless of size (Cost / rev). In case of small farm size, costs are one and a half times as much as net sales.
In the case of the "Cost / revS" indicator, small and large size farms have relatively small but positive profitability on average (0.97), while farms with medium farm size the operating costs are lower by 21% than their sales revenue increased with subsidy.
In the last column of Table 10, with the cost of the equity, the farms with a large farm size are still profitable. The profitability of small farms with large spread (Table 11) is moved above one. So smaller economies exploit themselves, so they can only be profitable by sacrificing the yield they expect from their own equity.
Table 11. Relative standard deviation of profitability indicators for domestic agricultural enterprises by 2015 by farm size (%) Size: Cost / rev
(expenses) / (revenue)
Cost / Revs (expenses) / (revenue +
subsidy)
AltCost / revs:
(costs + alternative costs) / (revenue + subsidy)
small 0,51 1,50 0,71
medium 0,40 1,81 0,40
large 0,14 0,29 0,17
On
average, 0,38 0,62 0,52
Source: own calculation
Farm size groups, on the basis of the relative deviation (Table 11), do not characterize the categories correctly. In addition, the indicators calculated from the 2015 data do not characterize the sample exactly. Table 12 therefore shows descriptive statistics for the whole sample for the period 2013-2015. 1777 agricultural enterprises provided sample in all three years. So as to avoid outlier values of seasonality, the data show the average values for three years.
A longer period of investigation would have significantly reduced the data provided each year.
Individual and corporate farms differ significantly, so my cluster analysis has focused on individual farms.
Separately from the whole sample, individual farms are still highly heterogeneous. The basic statistics for the sample of individual farms are detailed in Table 12.
Table 12. "Cost / rev", "Cost / revS" and "AltCost / revS" profitability indicators for individual farms for 2013-2015
Cost/rev Cost/revS AltCost/revS
average 1,09 0,77 0,85
dispersion 0,58 0,26 0,27
min 0,32 0,29 0,32
max 10,88 3,54 3,54
the number of profitable companies 808 1242 1153 the proportion of profitable firms in the
sample
56,78% 87,28% 81,03%
number of unprofitable companies 615 181 270 the proportion of unprofitable
companies in the sample
43,22% 12,72% 18,97%
Source: own editing based on AKI data
The purpose of cluster analysis is to organize observation units into groups (clusters). My goal is to highlight the companies that are profitable from the average values of the farm size category.
As explained in the Methodology chapter, I first chose hierarchical clustering in the clustering process to determine the number of clusters.
Subsequently, the non-hierarchical clustering methods were applied with k- median method. The size of the sample justified non-hierarchical clustering, and in my opinion clusters are better characterized by medians than arithmetic meanings.
The statistics of the variables were presented in the methodology chapter.
Table 13 lists the cluster analysis results. The six clusters consist of 1420 farms. The table also includes averages and medians. Within the clusters, the averages are close to the medians, so the clusters can be well characterized by averages. In the case of full sample statistics, in some cases (subs, leverage) the median is better at the approximation. In the lower half of the table you can
see the three indicators of the profitability and the proportion of profitable companies in the cluster.
Cluster 1: This cluster contains the third largest individual farms on the basis of output, operating area and balance sheet total. These are the 2nd highest proportion of rented areas (30%). They work as private entrepreneurs, family businesses and family producers, mainly on their own land. The cluster's Herfindahl index is very high (0.92), which means that their output comes from very few activities. 86% of the "percrop" confirms this, with 86%
of the net sales revenue coming from arable crops over the last three years. The value of leverage does not indicate a dangerous level
Cluster 2: The members of the second cluster are the largest in terms of output, but only the 4th on the basis of assets. Only five percent of the output comes from non-refundable subsidies, which is deeply below the mean value of the total sample. Examining the area of operation, they have the smallest size of land areas and have no rented area.
On the basis of diversification, the forty-seven farms in the cluster carry out only one activity, which certainly is not arable crops (0%). More than half of the farms in the cluster deal with poultry and pork holding. The leverage (2.02) is high and median (1.35) is remarkably high compared to other clusters.
Cluster 3: The cluster contains the most of the farms, about one-third of the total sample. The farms here are the smallest based on all variables. Like Cluster Two, there is no interest or land rental fees. The diversification of activity is one of the lowest (0.88), revenue almost entirely derives from one activity. Twenty percent of the output is non-refundable subsidies. Because of the very low sales revenue, these farms are fully in a dependent situation on the subsidy system and are not likely to survive fluctuations in revenue. The
average leverage is the same as Cluster Two, but due to the smaller farm size and the exposure to the subsidies, this is a very high value.
Cluster 4: Based on the average output of the sample, cluster four is considered to be average. In the cluster the highest ratio of subsidies is (25%) and rented areas is (30%). Similarly to cluster 1., the high rented area is because of arable crop production (81%) and the diversification of the activity is low (0.89), which means that very few types of activities are carried out by these farms.
Cluster 5: The cluster members have the biggest amount of assets, operating area and output. Here are the largest individual farms, but less than five percent of the sample is classified in this cluster. The diversification of the activity here is the best (0.73), due to the larger size, farmers are able to produce more production type, but arable crops are dominant in this cluster (81%). In absolute value, subsidies are the highest, but persubs are similar to the average of the other clusters (0.22). The larger size does not cause higher leverage, interest or land rent.
Cluster 6: Based on the variables, cluster 6 can be considered as an average cluster. This is the second largest number cluster. Here is the lowest proportion of rented areas (12%) after the second and third clusters. Average and median leverage also shows a normal value. However, half of the average gross profit is spent on land rent and interest payments, but the median value is only four percent.
Table13. Results of cluster analysis
cluster 1 2 3 4 5 6 Összesen
átlag medián átlag medián átlag medián átlag medián átlag medián átlag medián átlag medián
output 66 195 60 322 105 773 93 805 6 803 4 581 33 048 31 102 124 564 96 558 17 873 15 501 29 145 15 489
subs 19 297 19 731 7 960 5 661 1 577 1 098 12 611 10 965 37 181 29 719 5 900 4 971 8 342 4 498 land 200,86 214,99 60,28 13,33 17,35 12,23 132,58 117,36 376,99 334,29 63,89 56,24 86,91 46,00 totala 242 244 233 879 88 057 85 952 17 842 17 508 128 478 125 397 506 739 454 078 58 055 56 149 95 673 54 618 persubs 0,25 0,23 0,07 0,05 0,22 0,20 0,29 0,25 0,25 0,22 0,27 0,25 0,24 0,23 perrland 0,32 0,30 0,16 - 0,17 - 0,31 0,30 0,33 0,27 0,26 0,12 0,24 0,06 percrop 0,65 0,86 0,16 0,00 0,40 0,24 0,64 0,81 0,68 0,81 0,58 0,71 0,52 0,55 hhi 0,82 0,92 0,92 0,99 0,79 0,88 0,81 0,89 0,75 0,73 0,81 0,89 0,80 0,89 leverage 1,16 1,10 2,02 1,35 2,00 1,06 1,12 1,08 1,15 1,08 1,15 1,09 1,48 1,08 renou 0,05 0,04 0,01 0,00 0,02 - 0,04 0,03 0,05 0,04 0,03 0,02 0,03 0,01 rengm 0,20 0,10 0,11 0,00 - 0,21 - 0,13 0,10 0,18 0,12 0,47 0,04 0,11 0,03
cluster 1 2 3 4 5 6 Összesen
elemszám 147 47 512 245 63 406 1420
Cost/rev 1,01 0,91 0,80 0,88 1,17 1,02 1,06 0,93 0,93 0,87 1,09 0,94 1,09 0,95 Cost/revS 0,70 0,68 0,74 0,79 0,87 0,81 0,69 0,68 0,66 0,65 0,73 0,70 0,77 0,72 Altcost/revS 0,79 0,75 0,76 0,82 0,95 0,88 0,78 0,76 0,75 0,72 0,81 0,77 0,85 0,80 Profitabilis üzemek
(altcostrevS) 90,48% 89,36% 68,16% 89,39% 93,65% 86,45% 81,20%
Source: own editing based on AKI data
On the basis of the "Cost / rev" index for the whole sample, individual farms are on average loss-making (1.09), and on the median basis they are just profitable (0.95). On average, 77% of revenue and subsidies are the operating costs ("Cost / revS") if the alternative cost of equity is also taken into account ("Altcost / revS"), it will deteriorate profitability by 8 percentage points, but both the average profitability and the median value remain in a profitable category.
Cluster 3 (with the largest number of members) performs the worst. Without subsidies, more than half of the farms are unprofitable, taking into account the subsidies, they do not reach the average of the sample or the median. In addition to the alternative cost, only 68% of the farms are profitable, which is more than 10 percentage points lower than the total sample statistics.
The highest profitability was achieved by cluster 5 farms. The cluster has a total of sixty-three farms, which is the second smallest cluster, but by far the largest in terms of farm size. The average assets of the clusters in the cluster are five hundred million Hungarian forints, while the assets of the average individual farm are fewer than one hundred million Hungarian forints, and the difference between the median values is even bigger. In the level of individual farms, economies of scale are clearly visible.
Based on the results, in the case of individual farms, there is a positive relationship between profitability and crop production, farm size.
5. Conclusions and suggestions
Farmers' financial management differs in many aspects from general financial management. During my research, I highlighted the significant risk of the domestic agricultural sector that the ratio of short-term liabilities within the liabilities increased from about 40% to over 60% over the period under review, in parallel with the decrease in long-term liabilities (such as investment and development loans).
Within the liabilities, the ratio of short-term liabilities with generally higher interest rates increases for individual and corporate farms as well. A particularly high rate of growth was in case of individual farms, where only 25% of total liabilities were short-term in 2006, but exceeded 60% after year 2011. Conversely, the volume of investment and development loans typically more favourable for expansion, were stagnating or even decreasing during the period under review. This decline was particularly the case for small individual farms.
Basically, long-term lending is a bottleneck for the Hungarian banking system, as long-term stable funds are largely lacking, and long-term lending is often too risky for banks. This is a disadvantage and risk for several reasons.
On one hand, the low rate of investment and development loans are a barrier to future expansion. On the other hand, in the event of an increase in interest rates, due to the relatively large amount of short-term liabilities of agriculture, it is exposed to significant interest rate risk.
Based on the results, hypothesis 1 has not been proved: the ratio of short- term foreign liabilities increased, especially among smaller farms.
In order to reduce the financial disadvantages of small and medium-sized enterprises, productive investment should be stimulate and economic
development should be diversified in the countryside, public and private sources should be mobilized, longer-term lending techniques need to be developed and the banking sector (public and private) and other financial intermediaries should become more involved to make a sustainable agriculture financing system.
With regard to the future financing of the Hungarian agriculture, in the next few years, lending should focus on development loans, which should be accompanied by appropriate support instruments. Developments in loans and agricultural subsidies must be strengthened, thus creating stability for the agricultural sector.
My hypothesis 2 is a hypothesis of liquidity: it aims to determine the optimum liquidity. The optimal measure in this case means achieving higher profitability.
In the agricultural sector it is particularly difficult to handle liquidity shortages or surpluses, because of the extremely seasonal operating type.
According to my results, there are many unused liquid assets in the sector. The proportion of liquid assets in addition to current assets has increased significantly in the recent years.
According to my results, the relationship between liquidity and profitability in the two forms of operation is very different. Data show a positive correlation between liquidity and profitability. Thus, too low liquidity can be a barrier to profitable operations, until 2.5 degree liquidity rate, but too much liquidity will stop growth and even slightly decrease profitability.
Individual farmers have extremely high liquidity ratios, in their case there is a stronger and negative relationship between liquidity and profitability.
Based on my results, the relationship between liquidity and profitability is initially positive, so, if the organization holds too few liquid assets against its
liabilities, it has a negative impact on profitability. Increasing liquidity will then also increase the profitability at first. But the excessive liquidity holding will ultimately lead to deteriorating profitability, which is particularly relevant in agriculture on individual farms.
According to my hypothesis 3, large farm size has improved cost management because of the more efficient manpower management and the better utilization of the tools resulting from economies of scale. In the case of individual farms, profitability is higher for larger size, while for corporal farms the benefit of economies of scale is already decreasing.
The best profitability on the basis of the average of eleven years has been achieved by typically middle-sized farmers, and field vegetable growers and arable crops farms. The worst profitability was realized by small pig farmers, vine growers and fruit growers.
However, other variables determine the profitability more accurately. That is why I have further investigated other factors that determine the profitability of agricultural businesses, such as the alternative cost of agricultural equity and subsidies.
According to my hypothesis 4, Hungarian agricultural enterprises cannot realize an economic profit besides the alternative cost of equity. According to my question, when examining the profitability of the domestic agricultural sector, it is worth examining the specific factors determining the profitability of the agricultural sector beyond the traditional profitability indicators. For example, the unit cost per unit revenue, subsidies and the alternative cost of equity.
In addition to the unit cost per unit revenue, I examined the "Cost / revS":
Total Operational Costs divided by the Net Assignment of Sales + subsidies,
so approximating to reality it means what the profitability situation is like if we include subsidies in revenue as well.
I used the alternative cost also, I calculated for equity cost beside normal operating costs. This is "AltCost / RevS".
Based on the results, regardless of size, the Hungarian agrarian sector is unprofitable without the subsidies (Cost / rev). In case of small farm size, costs are one and a half times as much as net sales. The costs of medium and large companies are "only" 20 percent higher than their net sales.
The profitability of small and medium-sized farmers was extremely high dispersion. This hecticness would be worth dealing with, for example, with insurance, drought and disease-responsive crops and by improving the storage capability.
Small and medium-sized agricultural enterprises should improve their efficiency in order to counteract the exposure of subsidies. Regardless of size and category of production, the optimization of input and output allocations is of paramount importance.
In the case of the "Cost / revS" indicator, small and large farm size has a relatively small, but positive profitability, while on average 0.79 ratio for medium-sized farms, their operating costs are 21% smaller than their revenues, thus achieving a favourable operating result.
In all production directions, due to the fluctuations and cyclicality of market and production processes, subsidies have provided significant stability while ensuring the preservation of operations. For this reason, there is no justification for a significant reduction of subsidies in any sector. Given the current production conditions and production technologies, it is not possible to achieve a level of effectiveness that would allow the abolition of subsidies.
As the individual agricultural enterprises proved to be heterogeneous, I thought it to be important to look at this further. The aim of the cluster analysis