Needs and Expectations – Controllers in the Hungarian Labor Market
ZOLTÁN MUSINSZKI, Ph.D. NORBERT GYENGE
ASSOCIATE PROFESSOR ECONOMIST
UNIVERSITY OF MISKOLC
e-mail: stmusiz@uni-miskolc.hu e-mail: gyenge.norbert@gmail.hu
KATALIN LIPTÁK, Ph.D.
ASSOCIATE PROFESSOR
UNIVERSITY OF MISKOLC e-mail: regkata@uni-miskolc.hu
SUMMARY
Automation, digitalization and globalization have an effect on the current global labor market. The process of change has become increasingly apparent also in Hungary. Both employers and the employee have to adapt to the rapidly changing circumstances. The aim of the paper is to examine the demands that the novel processes and their labor market effects impose upon the potential labor force. According to our hypothesis, these new needs appear at the beginning of the recruitment process. Our research question is whether there is any relationship between the competences related to a highly qualified job like the controller and the company’s size and activity, and if so, to reveal the strength of the relationship. To test it, we examined job advertisements for controllers based on predefined criteria.
Keywords: controller competences, job advertisement, labor market, challenges, controlling Journal of Economic Literature (JEL) codes: J01, M40
DOI: http://dx.doi.org/10.18096/TMP.2019.02.04
T HE C HANGING L ABOR M ARKET
AND ITS C HARACTERISTICS
Over the past two decades, there has been a structural shift in the markets, including the labor market:
the production and the number of the work force has decreased in manufacturing, while the amount of output and the number of the work force has increased in services, financial activity and construction. As a result of the sectoral changes, the service sector was expected to be able to solve the problem of unemployment and to create job opportunities, but this was not realized in full. Sectoral changes resulted in changes in the need for the quality and the quantity of the work force (Emmerij 1994).
The period after the 1980s was marked by the revolution of the distribution and spread of microelectronics. The spreading of information and communication technologies fundamentally changed the space in which companies operate, compete and trade, and this development has been
unbroken since then. The information revolution offers companies the opportunity to improve their internal efficiency, to increase their productivity and to ensure that the geographical gap between the buyer and the seller can be bridged. The import of technology is a necessary but not sufficient condition for the growth and development of countries. The lack of access to technology hampers the conditions of low-income earners and increases the level of poverty.
Since the 1990s, as an effect of globalization, technology has replaced labor in production to an even greater extent. At the same time, however, capital needs the elasticity of the labor market (Mészáros 2010).
Beveridge (1909) recognized that unemployment cannot be completely eliminated in the economy. Instead, he believes that a minimal level of unemployment (2–3%) is required. He argues that without that reserve, the labor market would not be flexible enough. Unemployment is a natural consequence of capitalist production; its growth was a characteristic and necessary spin-off of globalization. At the same time, however, an accelerated
increase in unemployment is especially typical among unskilled workers. In economic booms, employment extended to a lesser extent than output, while in times of economic downturn, it decreased faster than the production. Rifkin (1995) argues that one of the main reasons for the decrease in labor demand is the increase in mechanization and automation. Machines replace workforce, which creates mass unemployment. When agriculture and industry became automated, the service sector absorbed surplus labor, but nowadays there is no sector capable of employing the huge workforce to emerge several decades from now.
Modern societies are correctly referred to as “societies of contract work”, but the term “work society” is also often used in the literature, implying that the worker simply exchanges his/her work for a wage in the labor market (Mückenberger 1996). The heyday of wage labor was the 25 years following the Second World War and up to the oil crisis. The crisis of wage labor has been discussed in the literature since the 1960s. Labor gradually disappears in the society of wage labor, which is a major problem. A redefinition of the concept of work is needed, as much of the society has already been excluded from classical wage labor. A smaller rate of the working age population works in traditional forms of employment. In more developed European countries, the atypical forms of work are actually those that can be considered typical, since they have become predominant (Török 2006). The changes of the definition of work not only implies that the world of work has changed, but also that atypical forms of employment, which provide a transition from the world of classical wage labor, have become increasingly popular. (Central and Eastern Europe and Hungary are still lagging behind and so we still consider traditional forms of employment as typical.) Globalization increased the demand for secure forms of employment against insecurity and typical employment has been replaced by atypical employment.
One of the most important elements of the change is clearly the changing employer organization. In classic labor law, the employer is a well-defined production company that is hierarchically managed and connected to employees. This model is increasingly being replaced by network-based “multidimensional” organizations, in which the relationship system is very complex, in some cases with a cluster-like structure. At the same time, new types of organizations develop with a loose relationship between members. Another key element of the change is the mobility of workers and the geographical dispersion of employers. Most large companies have many subsidiaries, branches or premises, and in some cases, employees no longer work in the buildings of the company, but at home or in a telehouse. The regulatory environment was also influenced by the decrease of the “boundaries” of nation states (Kártyás 2009).
According to Németh et al. (2010), employers expect professional work experience and foreign language skills from graduates at the start of their career. This is a new
trend in the modern labor market from the 20th century.
Later, we will analyze the language skills by job ads. The social competencies (communication skills, problem- solving skills, creativity) are relevant, too. According to Németh the social skills are among the most important requirements demanded from recent graduates by employers (Németh et al. 2010). Alpaydin (2015) wrote that the skills expected from employees changed dynamically with technological and economic developments such as industrial shifts from industry to services after moving to a post-industrial society. He analyzed the different types of qualification and skill mismatches. Accetturo et al. (2014) modeled technical change as variations in the Cobb-Douglas share parameters by a changing labor market. They found that there are spatial differentiations between the low-and high- skilled workers.
In the world of work, constant change can be experienced, as 5% of the existing professions change every five years, the number of professions that do not require any information and communication technology (ICT) skills decreases by 5% every second year and the income generating ability of professions that do not require basic ICT skills is around the minimum wage level. The acquired professional skills become out-of-date in ten years, the amount of work-related knowledge on the internet increases 32 times every two years, the number of internet connections doubles every year and the available bandwidth continuously increases. These changing conditions also put workers in a new position. Automation and mechanization will significantly reduce the human resource needs of certain jobs in the future; Bartha &
Sáfrányné Gubik (2018) describe in detail the expected reduction in the number of staff requests for each job.
The global restructuring of the labor market is also accompanied by territorial disparities in the labor market (G. Fekete & Lipták 2011), which implies the deterioration of the equilibrium between supply and demand. Today, besides high unemployment levels, high levels of labor shortages are emerging as a problem in this two-face labor market, which is a major challenge for both employers and employees. There is a need to develop a much stronger competency-based recruitment method and to focus on developing competencies, because the requirements for employees have changed as a result of the high degree of mechanization and automation. Different competencies are required in the same job today than ten or twenty years ago. Jobs have undergone significant transformation and change; when there is no more realistic demand for certain skills some jobs (like wainwright, skinner or weaver) will disappear and new ones will be created.
We assume that the competencies and expectations required for each job will be much more transparent in the job advertisements than before and therefore the whole recruitment process will need to be changed. To test this hypothesis, we conducted a survey of job advertisements in Hungary for the position of controller.
R ESEARCH M ETHODOLOGY
Data was collected in the first half of January 2019 from an online job recruitment website. The source of the data was the profession.hu website. We analyzed only the controller positions. For deeper analysis and to avoid distortions we excluded recruitment, headhunter and human resource companies from our data collection. To process the data, job advertisements were divided into three main categories: (1) tasks, (2)expectations and requirements, and (3) the supply side. Each job advertisement included a new job, a new expectation or the phrasing of the same task was different. This meant that in order to keep the database manageable, the raw database had to be standardized. In order to achieve results, it was necessary to create uniform categories. In the cases of tasks, expectations and supply, we aggregated variables with the same or similar meanings and variables that belong to the same group and have low frequencies.
Tasks. The following categories were created: (1) The category of Development, optimization and operation of controlling and enterprise resource planning (ERP) was created from the aggregation of Improvement and optimization of controlling systems, Deployment and operation of controlling systems and Maintenance and development of ERP. (2) The category Accounting and managing invoices was formed after the aggregation of Managing invoices, Managing accruals and Accounting.
These tasks typically are not the tasks of a controller and therefore their frequency was low in the advertisements. Since every task is related to accounting, they were aggregated in one category. (3) Preparation of studies and case descriptions were included in Ad-hoc tasks. (4) Organizing stock, taking into account its content, was integrated into the Control tasks. (5) Participation in Planning and Budgeting Tasks has been re- named Planning and Budgeting. (These two tasks often accompany each other; therefore, in cases where participation in planning was listed as a task, budgeting was also listed. As there were only three exceptions and budgeting is a part of planning, it is logical to treat them as the same variable.) During data collection, the main group of tasks included 20 variables, which were reduced to 13 after standardization.
Requirements and expectations. The following groups were formed: (1) IFRS knowledge and US- GAAP knowledge were aggregated. This step can be justified on the one hand by their low frequency in the sample and on the other by their similarities, as both are accounting standards. (2) Dutch language proficiency and a clean criminal record were eliminated because both were listed only once in the samples and could not be inserted into any other expectations. (3) The competencies of being able-bodied and having a high working capacity were considered the same, so they were aggregated. After standardization, 18 variables were created from the initial 21. It is important to mention that, as in the literature,
professional, personal and social competences can be identified (9 competences for each category).
Benefits. The option of Home Office is included in Flexible working hours. (In this main group the companies often did not indicate anything at all, and if they did, they were rather inaccurate. As a result, the supply group included the fewest variables.)
Corporate data. (1) Activities: Data collection was carried out by recording these variables as they were specified in the advertisements and reports. For companies who have not indicated any activities, the website ceginformacio.hu was used to find their Hungarian NACE numbers and activities were assigned to the companies by taking into account the first two digits of these numbers using the data of the tearoszamok.hu website. In the case of multiple activities, using the financial reports of the companies, only the main activity was taken into consideration. This led to a significant reduction in the number of activities, as illustrated in Table 1.
Table 1
Frequency of the companies’ activities in the job advertisements of the sample
name frequency
activity
trade 18
financial sector 15
food industry 10
manufacturing 10
labor market services 10
consultancy 9
real estate sector 8
vehicle production 7
logistics 5
informatics 4
other 4
Source: Own edition
(2) Company size. Companies were categorized by size in addition to their activities. The classification was based on employee numbers, revenue and the total balance sheet. Several companies keep their books in euros; in this case, the average exchange rate on December 30, 2017 was used to convert to HUF. The sample included 53 large companies, 23 medium-sized companies and 24 small companies (Gyenge, 2019).
R ESULTS AND D ISCUSSION
Relationship between Company Size and Tasks
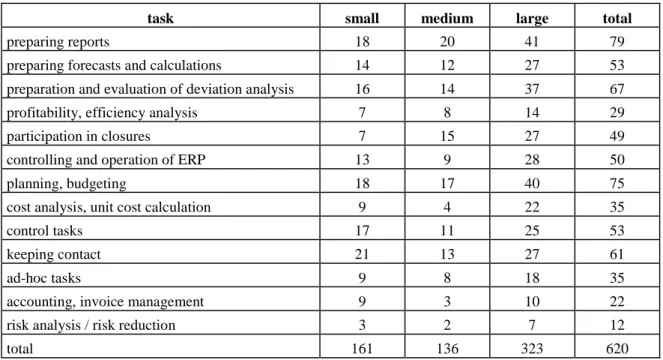
First we looked at the types and number of tasks listed in the job advertisements depending on the size of the company (Table 2).
Because of the different sample sizes of the groups, data in Table 2 do not say much by themselves. Table 3 including the relative frequency of the mentioned tasks is a better way of illustration.
Taking into account the first variable, the data in Table 3 shows that 75% of small companies indicated preparing reports as a task to be done, while 87% of the medium- sized companies and 77.4% of large companies listed the same task in the advertisements. On the, whole this task was indicated in 79.8% of the advertisements. (It was the most frequently mentioned task.) GBold letters are used to indicate the most common tasks, while italics indicate the least common tasks for each column. As for the group averages of the different company sizes, small companies provided the largest number of tasks proportionately, while medium-sized companies listed the fewest tasks.
In the case of small companies, of the most frequently listed tasks keeping contact shows a relationship with size;
that is the increase of company size decreases the role of keeping contact. Moreover, its value of 87.5% is considered very high in its own group and also compared to other groups. There is a similar trend for monitoring and accounting tasks, which are among the lowest in the other two groups. In addition, control tasks also appear in 71%
of the advertisements. This implies that the Accounting Manager also carries out controlling functions.
In the case of medium-sized companies, preparing reports was listed at the highest rate with 87%, followed by participation in planning with 74% and participation in closures with 65.2%. While the first two tasks are of paramount importance to each group, participation in closures was mentioned to the highest proportion among the groups. Risk management tasks are negligible in this case as well, like accounting-related tasks, but cost analysis and unit cost calculation also fell below 20%.
Table 3 highlights that the three tasks listed most commonly by large companies are exactly the same as the tasks included in the phases associated with PDCA cycle controlling: planning, analysis and feedback. The lowest results are the same as for medium-sized companies, but here profitability and efficiency analysis are listed the least often.
Table 2
Frequency of the tasks by company size
task small medium large total
preparing reports 18 20 41 79
preparing forecasts and calculations 14 12 27 53
preparation and evaluation of deviation analysis 16 14 37 67
profitability, efficiency analysis 7 8 14 29
participation in closures 7 15 27 49
controlling and operation of ERP 13 9 28 50
planning, budgeting 18 17 40 75
cost analysis, unit cost calculation 9 4 22 35
control tasks 17 11 25 53
keeping contact 21 13 27 61
ad-hoc tasks 9 8 18 35
accounting, invoice management 9 3 10 22
risk analysis / risk reduction 3 2 7 12
total 161 136 323 620
Source: Own edition
Table 3
Relative frequency of tasks (%) by company size
task small medium large mean
preparing reports 75.00 86.96 77.36 79.77
preparing forecasts and calculations 58.33 52.17 50.94 53.82 preparation and evaluation of deviation analysis 66.67 60.87 69.81 65.78 profitability, efficiency analysis 29.17 34.78 26.42 30.12
participation in closures 29.17 65.22 50.94 48.44
controlling and operation of ERP 54.17 39.13 52.83 48.71
planning, budgeting 75.00 73.91 75.47 74.79
cost analysis, unit cost calculation 37.50 17.39 41.51 32.13
control tasks 70.83 47.83 47.17 55.28
keeping contact 87.50 56.52 50.94 64.99
ad-hoc tasks 37.50 34.78 33,96 35.41
accounting, invoice management 37.50 13.04 18.87 23.14
risk analysis / risk reduction 12.50 8.70 13.21 11.47
Note: bold type indicates the highest value, italics indicates the lowest value.
Source: Own edition
Table 4
Relative frequency of professional competences (%) by company size
name small medium large mean
higher education degree 87.50 95.65 90.57 91.24
1-3 years of work experience 58.33 52.17 66.04 58.85
4 years or more work experience 25.00 39.13 11.32 25.15
English language skills 70.83 86.96 84.91 80,90
German language skills 8.33 13.04 7.55 9.64
IFRS, US-GAAP knowledge 12.50 8.70 11.32 10.84
Knowledge of MS Office 79.17 82.61 84.91 82.23
SAP knowledge 8.33 26.09 33.96 22.79
Knowledge of ERP systems 16.67 26.09 9.43 17.40
Note: bold type indicates the highest value, italics indicates the lowest value.
Source: Own edition
Relationship between Company Size and Competencies
Expectations listed in the advertisements were divided into two groups: professional and personal, social competences. First professional competences are discussed (Table 4).
For all three company size categories the same three professional competencies were the most prominent:
higher education qualification, English language skills and knowledge of MS Office. In the case of small businesses, these three professional competences are mentioned to a lesser extent than in the other two groups of companies. A further characteristic of smaller companies is that the
knowledge of SAP or other ERP system is not a common requirement. Interestingly, for medium-sized companies, the requirement of higher education has the highest proportion (95.7%) within the group and they are the ones who would like to have employees with four or more years of work experience. Large companies prefer to employ people with less work experience. Only 11.3% of them listed four or more years of work experience in their job advertisements, while 1-3 years of work experience could be found in 66% of the advertisements. A high level of division of labor within a company is indicated by the fact that, despite the international environment, only one in nine companies required international accounting skills. As for personal competencies, in line with
the theoretical background (Horváth 2015, Fenyves et al. 2016, Gleich et al. 2016, Tóth & Zéman 2017), companies most often list flexibility, analytical skills, analytical thinking and precision. It is interesting, however, that, contrary to previous surveys, a systematic approach has a minor role.
Precision and good communication skills can be found in 58.3% and 54.2% of small companies’
job advertisements. An interesting fact is that the frequency of precision decreases with as company size increases. The same applies to autonomy at work, which was mentioned in 50% of the advertisements. For medium-sized companies, analytical thinking and flexibility were mentioned most commonly within the group and also among the groups (60.9% and 56.5% respectively). At the same time, however, good communication skills, which is one of the most common competencies in the other groups, is only mentioned by 39.3% of the companies in this case. The smallest number of personal competencies were listed in the advertisements
of large companies. Interestingly, this group of companies attaches less importance to autonomy at work and flexibility than the others.
Relationship between Company Size and Benefits
Among benefits items, the competitive and youthful, friendly environment and salary are the most commonly listed items in each group, even if the latter does not really mean a realistic possibility. Another common characteristic of the groups is that sporting opportunities and health services are rarely mentioned in the advertisements of small and medium-sized companies, but this rate increases as the company size grows. There is also an increase with company size in listing potential for development and improvement as well as responsibilities at work.
Table 5
Relative frequency of personal competences (%) by company size
name small medium large mean
autonomy at work 50.00 34.78 33.96 39.58
flexibility, cooperative skills 50.00 56.52 37.74 48.09
problem-solving ability 29.17 39.13 32.08 33.46
system approach 16.67 21.74 24.53 20.98
able-bodied and high working capacity 33.33 26.09 22.64 27.35 analytical thinking, analytical skills 45.83 60.87 54.72 53.81
precision 58.33 52.17 50.94 53.82
good communication skills 54.17 39.13 41.51 44.94
willingness to travel 8.33 8.70 9.43 8.82
Note: bold type indicates the highest value, italics indicates the lowest value.
Source: Own edition
Table 6
Relative frequency of benefits items (%) depending on the company size
name small medium large total
competitive salary 66.67 78.26 47.17 64.03
benefits 41.67 52.17 41.51 45.12
multinational environment 16.67 43.48 33.96 31.37
potential for development and improvement 45.83 56.52 58.49 53.62
stable corporate background 70.83 17.39 39.62 42.62
education and training 12.50 30.43 20.75 21,23
youthful, friendly environment 45.83 52.17 50.94 49.65
responsibilities at work 8.33 26.09 33.96 22.79
flexible working hours 8.33 13.04 11.32 10.90
travel support 4.17 13.04 16.98 11.40
sporting possibility 4.17 4.35 11.32 6.61
health service 4.17 8.70 11.32 8.06
Note: bold type indicates the highest value, italics indicates the lowest value.
Source: Own edition
Table 7
Relative frequency of tasks depending on the company’s activity activity-tasks output table
food industry manufacturing trade financial sector consultancy logistics labor market services IT real estate sector other mean
preparing reports 50.00 76.47 88.89 86.67 88.89 60.00 70.00 75.00 88.00 100.00 78. 34 preparing forecasts
and calculations 60.00 70.59 33.33 46.67 55.56 20.00 80.00 50.00 63,00 25.00 50.36 preparation and
evaluation of deviation analysis
50.00 64.71 72.22 66.67 66.67 80.00 50.00 75.00 75.00 100.00 70.03 profitability,
efficiency analysis 40.0 0 47.06 27.78 6.67 22.22 40.00 30.00 25.00 13.00 50.00 30.12 participation in
closures 60.00 35.29 72.22 40.00 33.33 20.00 80.00 75.00 25.00 25.00 46.58 controlling and
operation of ERP 60.00 52.94 50.00 60.00 44.44 40.00 60.00 50.00 13.00 50.00 47.99 planning,
budgeting 70.00 58.82 61.11 73.33 88.89 80.00 100.00 100.00 75.00 100.00 80.72 cost analysis, unit
cost calculation 50.00 52.94 27-
78 6.67 22.22 0.00 70.00 50.00 38.00 25.00 34.21 control tasks 70.00 47.06 55.56 26.67 22.22 0.00 9 0.00 50.00 100.00 75.00 53.65 keeping contact 60.00 52.94 83.33 46.67 66.67 20.00 80.00 25.00 63,00 75.00 57.21 ad-hoc tasks 10.00 29.41 33.33 26.67 44.44 60.00 30.00 75.00 50.00 50.00 40.89 accounting,
invoice management
30.00 11.76 38.89 13.33 0.00 0.00 20.00 25.00 50.00 25.00 21.40 risk analysis / risk
reduction 10.00 11.76 6.67 6.67 22.22 0.00 0.00 0.00 0.00 0.00 9.73 Note: bold type indicates the highest value, italics indicates the lowest value.
Source: Own editing
Within the group of small companies, it was a stable corporate background that was mentioned the most, which far exceeds the other groups with its 70.8% rate. In contrast, small companies rarely listed a multinational environment which represents the lowest proportion within the groups, with 16.7%. Interestingly, in 10 of the 12 supply items, the lowest values can be found in this group. Medium-sized companies most often indicated a competitive salary, and fringe benefits were also added in 52.2% of the cases. Furthermore, a multinational environment and education and training were mentioned at
a rate higher than the average. In the case of large companies, although a competitive salary is one of the most prevalent items within the group, it is still almost 17% below the average and the same applies to benefits. This group can furthermore be characterized by a relatively high proportion of responsibilities at work and of travel support.
Relationship between Activity and Tasks
Based on the data in Table 7, the fewest tasks were mentioned by logistics companies, and the most tasks were listed by companies of the labor market sector. Risk management tasks were clearly mentioned the least in each activity group. There are also "dividing" tasks, like keeping contact, which is of paramount importance for several companies, while only 25% of IT companies mentioned it. Similarly, 75% of IT companies listed ad- hoc tasks, while in the case of several activities, like manufacturing or food industry, the same task appears with the lowest incidence. No task was listed in more than 70% of the cases by food industrial companies. This is peculiar because there was at least one task in each of the other activity groups that was mentioned in at least 75% of the cases. Some tasks are listed regularly by manufacturing companies (like profitability and efficiency analysis with 47% or cost analysis with 53%), while they are less significant in other groups. This seems to be a specificity of the industry, as these companies produce material goods and these tasks traditionally play a major role there. With some backlog, the same applies to food companies.
The situation is reversed for trading companies. Efficiency and cost analysis are less prominent here, while keeping contact and preparing reports play an important role. While planning is mentioned among the tasks in 61.1% of the cases, this value is still below the average by almost 20%. There are many similarities between companies in the financial sector and in consultancy. Based on the tasks to be performed, it is clear that the results of their value-added processes are reflected in the provision of services.
Relationship between Activity and Competencies
For professional competencies, as shown in Table 8, IT companies listed the most requirements, while the fewest requirements were found in the case of real estate companies. Here and at IT companies, English language
skills were mentioned in only half of the cases, which falls below the average by 29%.
We also examined work experience by sector. While most sectors prefer younger people with 1-3 years of professional experience, consultancy firms would prefer highly experienced individuals. Industrial companies have similar characteristics in several variables, but contradictions can also be found. For instance, none of the food companies listed knowledge of IFRS or US GAAP, while 17.7% of manufacturing companies mentioned this competence. At 60% of the food companies, SAP knowledge was a requirement, which is twice its average appearance. It is common for trading companies to indicate half of the professional competencies in most advertisements. The other half of the competences, such as German language skills or the knowledge of international accounting and ERP systems, are hardly mentioned in their job advertisements. The financial sector lists the second lowest number of tasks in its job advertisements based on the sample. Three of the tasks (German language skills, knowledge of international accounting and knowledge of SAP) are never mentioned in their advertisements and the people with four or more years of work experience are the least expected by them. In the case of consulting companies, the inverse rate of appearance of work experience was mentioned. A further interesting fact is that this was the activity where the knowledge of enterprise management systems was the most frequently mentioned among professional requirements, although only in one third of the cases. Companies in logistics also rarely mentioned 1-3 years of work experience (in 40% of the cases) and SAP knowledge was mentioned in 40% of their advertisements. We can conclude that these are probably not consulting companies for which headhunting companies look for controllers. This can be inferred from the proportion of work experience listed by the companies. The companies of the real estate sector in the sample primarily act in the domestic market. We can infer this from the lower demand for foreign language competences. Moreover, higher level competences are not necessary in this sector either.
Table 8
Relative frequency of competencies depending on the company’s activity
activity-professional competencies output table
row labels
food industry manufacturing trade financial sector consultancy logistics labor market services IT real estate sector other mean
higher education degree 90.00 94.12 77.78 93.33 100.00 100.00 100.00 100.00 87.50 75.00 91.77 1-3 years of work experience 70.00 58.82 77. 78 60.00 22.22 40.00 80.00 50.00 62.50 50.00 57.13 4 or more years of work
experience 10.00 11.76 22.22 6.67 66.67 20.00 10.00 50.00 12.50 50.00 25.98
English language skills 90.00 94.12 88.89 80.00 66.67 80.00 90.00 50.00 50.00 100.00 78.97 German language skills 10. 00 5.88 11.11 0.00 22.22 0.00 10.00 25.00 12.50 0.00 9.67
IFRS, US-GAAP 0.00 17.65 11.11 0.00 11.11 0.00 30.00 25.00 0.00 25.00 11.99
Knowledge of MS Office 90.00 94.12 88.89 80.00 77.78 100.00 50.00 75.00 75.00 100.00 83.08
SAP knowledge 60.00 41.1 6 33.33 0.00 0.00 40.00 20.00 50.00 0.00 25.00 26.95
Knowledge of ERP systems 10.00 17.65 22.22 13.33 33.33 0.00 10.00 25.00 0.00 0.00 13.15
average 47.78 48.37 48.15 37.04 44.44 42.22 44.44 50.00 33.33 47.22 44.30
activity-personal competencies output table
row labels
food industry manufacturing trade financial sector consultancy logistics labor market services IT real estate sector other mean
autonomy at work 10.00 29.41 27.78 66.67 44.44 40.00 50.00 50.00 25.00 50.00 39.33 flexibility, cooperative skills 10.00 52.94 50.00 33.33 77.78 40.00 60.00 75.00 25.00 25.00 44.91 problem solving ability 10.00 23.53 50.00 40.00 44.44 40.00 10.00 50.00 12.50 75.00 35.55 system approach 10.00 11.76 38.89 13.33 33.33 40.00 20.00 50.00 12.5 0 0.00 22.98 able-bodied and high working
capacity 20.00 17.65 22.22 33.33 55.56 40.00 20.00 0.00 12.50 50.00 27.13
analytical thinking, analytical
skills 70.00 41.18 72.22 20.00 88.89 60.00 40.00 100.00 37.50 50.00 57.98
precision 60.00 58.82 55.56 46.67 33.3 3 80.00 40.00 25.00 75.00 50.00 52.44
good communication skills 60.00 41.18 38.89 40.00 66.67 60.00 40.00 50.00 12.50 50.00 45.92 willingness to travel 10.00 11.76 5.56 0.00 33.33 0.00 10.00 0.00 0.00 25.00 9.57
average 28.89 32.03 40.12 32.59 53.09 44. 44 32.22 44.44 23.61 41.67 37.31
Note: bold type indicates the highest value, italics indicates the lowest value.
Source: Own edition
The case of personal competences was not entirely consistent, which implies that the general requirements are independent of the company profile that clearly appeared among the groups. Willingness to travel is the only item that is among the least frequently mentioned variables of all companies. The largest number of competencies in the sample were given by consulting companies. They listed personal competencies in 53.1% of the cases, making them the only group to exceed 50%. Companies in the real estate sector were the least concerned with indicating personal competencies. Companies in the food industry adapted to the total average in the sense that the three most common requirements (analytical thinking, good communication skills and precision) are equal in their group. The numbers, however, highlight that they rarely list other competences. The same applies to manufacturing companies. They mentioned precision at 58.8% and flexibility and cooperative skills at 52.9%. Based on the sample, systematic approach and high working capacity are the least requested competences. Analytical thinking is a priority competence at trading companies with its 72.2% presence in the advertisements, but precision, flexibility and problem- solving are also listed by at least 50% of the companies. High working capacity is the second least mentioned competency in the group after willingness to travel. In the financial sector, autonomy at work is the most common (66.67%), which has the highest value among groups as well. Moreover, precision is mentioned in the 46.7% of the cases and also high working capacity was mentioned here in one third of the cases. Consulting companies prefer flexibility and analytical thinking. Communication skills, high working capacity and willingness to travel were mentioned in this case the most. The last one was mentioned only by 33.3% of the companies, but even this figure is more than three times higher than the average. Companies in logistics are also dominated by the three most common requirements.
Willingness to travel was not mentioned, while all other competencies appeared in 40% of their advertisements. At IT companies, high working capacity was not mentioned at all, while analytical thinking appeared in all advertisements. In the case of the real estate sector, precision, the only competency exceeding 50%, was mentioned in 75% of the advertisements.
Relationship between Activity and What is Offered
On the supply side, advertisements included less information not only on the whole, but also by activity.
Companies in logistics reached 45% of items were listed by at least one logistics company and manufacturing companies reached 41.7%. The lowest number of supply items was listed by IT companies with 16.7%. The sample included several supply items that are provided by only certain companies to their employees. These include sporting possibilities and health service. Surprisingly, flexible working hours did not even reach 10%. There is a slight difference in supply among companies in the industry. Manufacturing companies are more likely to attract employees with a competitive benefit package, while food companies tend to favor secondary variables (like stable corporate background or responsibilities at work), in addition to providing fewer opportunities on the supply side. Trading, financial and consulting companies listed only "HR trick" items in the highest proportion. Commercial companies indicated competitive salary at a relatively high rate (66.7%), which, along with providing education and training (which has the highest rate with 38.9%) seems to be a quite attractive sector. It is interesting for the financial sector to have a competitive salary and benefits mentioned at a rate of 40%
because most surveys about average income rank companies in the financial sector in the first place. Even if this factor is not listed in the advertisements, companies can give outstanding salaries. In spite of the high level of requirements, consulting companies did not reach more than 50% in any of the supply items. The two most significant supply items can also be considered HR tricks. For logistics companies, both potential for development and improvement and stable corporate background reached 100%. They listed competitive salaries in 80% of their advertisements, the second highest among the groups. The supply side of IT companies is rather poor based on the sample. Previous tables show that most of the tasks were listed by them among the identified sectors, with 51.9%. They are ranked first for professional competencies (50%), while they are ranked second in terms of personal expectations (44.4%) as along with companies in logistics. In contrast, the incidence of supply items is only 16.7%.
Table 9
Relative frequency of competences depending on the company’s activity
activity-supply output table
row labels
food industry manufacturing trade financial sector consultancy logistics labor market services IT real estate sector other mean
competitive salary 30.00 82. 35 66.67 40.00 33.33 80.00 70.00 50.00 75.00 50.00 57.74
benefits 50.00 70.59 33.33 40.00 33.33 40.00 50.00 25.00 25.00 50.00 41.73
multinational environment 40.00 47.06 16.67 33.33 22.22 60.00 40.00 25.00 12.50 25.00 32.18 potential for development and
improvement 60.00 47.06 77.78 66.67 44.44 100.00 20.00 50.00 37.50 25.00 52.84 stable corporate background 50.00 52.94 27,78 33.33 11.11 100.00 70.00 25.00 50.00 0.00 42.02 education and trainings 20.00 23.53 38.89 6.67 33.33 20.00 10.00 0.00 12.50 25.00 18.99 youthful, friendly environment 30.00 41.18 77.78 73.33 44.44 60.00 30.00 25.00 37.50 25.00 44.42 responsibilities at work 50.00 29.41 22.22 40.00 0.00 40.00 20.00 0.00 0.00 50.00 25.16 flexible working hours 0.00 17.65 16.67 20.00 11.11 0.00 10.00 0.00 0.00 0.00 7.54
travel support 10.00 47.06 11.11 0.00 11.11 20.00 0.00 0.00 0.00 0.00 9.93
sporting possibility 0.00 23.53 0.00 13.33 11.11 0.00 10.00 0.00 0.00 0.00 5.80
health service 0.00 17.65 11.11 6.67 11.11 20.00 0.00 0.00 12.50 0.00 7.90
Source: Own edition
S UMMARY , C ONCLUSIONS
Based on the results of the research, several novel relationships can be revealed between the size of the company and the content of the job advertisements. In the case of group averages according to company size, small companies listed the most tasks proportionately in their advertisements, while the fewest tasks were indicated by medium size companies. The analysis of personal competencies implies that, in line with the theoretical background of the topic, companies have a high demand for flexibility, analytical skills, analytical thinking and precision. It is interesting, however, that a lack of importance is attached to a systematic approach, contrary to previous surveys. In the job advertisements, the smallest number of personal competences was listed by large companies. At this company size, autonomy at work and flexibility have less importance compared to other groups.
Investigation by company activity type showed that manufacturing companies tend to try to attract
employees with a competitive benefit package, while food companies tend to prefer variables of secondary importance (stable corporate background or responsibility at work). Trading, financial and consulting firms listed items listed “HR tricks” to the highest proportion. Trading companies indicate competitive salary to a relatively high extent, which is supplemented by education and training.
We believe that in the future, the content of job advertisements will be even more important, not only for the position of controller position but also for other positions. A precise and accurate job advertisement is a great help to the applicant as well, since the applicant can assess whether (s)he has enough professional knowledge and competence to perform the tasks specified in the advertisement. We know that there are some limitations of our research, for example the size of the sample or the temporality of the research. However, we think that even so this study is of interest to both employees and employers. Our further research plan is to carry out new research for another position with a similar method.
Acknowledgement
This research is supported by project no. EFOP-3.6.2-16-2017-00007, titled “Aspects on the development of a smart, sustainable and inclusive society: social, technological, innovation networks in employment and the digital economy.” The project has been supported by the European Union, co-financed by the European Social Fund and the
budget of Hungary.
REFERENCES
ACCETTURO, A., DALMAZZO, A. & DEBLASIO, G. (2014). Skill polarisation in local labor markets under share- altering technical changes. Journal of Regional Science. 54(2), 249-272.
ALPAYDIN, Y. (2015). Identifying Higher-Education Level Skill Needs in Labor Markets: The Main Tools Usable for Turkey. Educational Sciences: Theory & Practice, 15(4), 945-967.
BARTHA, Z. & SÁFRÁNYNÉ GUBIK, A. (2018.) Oktatási kihívások a technikai forradalom tükrében (Educational challenges in the light of the technical revolution). Észak-magyarországi Stratégiai Füzetek, 15(1),15-29.
BEVERIDGE, W. H. (1909). Unemployment: A Problem of Industry. London: Longmans, Green and Co.
EMMERIJ, L. (1994). The employment problem and the international economy. International Labour Review, 144(4), 449-466.
FENYVES, V., KONDOROSI, F., KEREZSI, D. & DAJNOKI, K. (2016). Vezetői döntést segítő információk a munkaerővándorlás sajátosságai alapján (Management decision-making information based on the characteristics of labor migration). Controller Info, 4(3), 42-51.
G. FEKETE, É. & LIPTÁK, K. (2011). Post-modern values and rural peripheries. Journal of Settlements and Spatial Planning, 2(1), 1-7.
GLEICH, R., LOSBICHLER, H. & ZIERHOFER, R. M. (2016). Unternehmenssteuerung im Zeitalter von Industrie 4.0:
Wie Controller die digitale Transformation erfolgreich steuern. Haufe Fachbuch
GYENGE, N. (2019). A kontroller álláshirdetések mögöttes tartalma (Contents of Controller Job Ads). University of Miskolc.
HORVÁTH & PARTNERS (2015). Controlling, Út egy hatékony controlling rendszerhez (Controlling, The path to an effective controlling system). Budapest: Saldo Kiadó
KÁRTYÁS, G. (2009). A munkajog új kihívásai a XXI. század elején. (New challenges for labor law in the 21st century).
Munkaügyi Szemle, 53(1), 42-48.
MÉSZÁROS, R. (2010). A globális gazdaság földrajzi dimenziói (Geographical dimensions of the global economy).
Budapest: Akadémiai Kiadó
MÜCKENBERGER, U. (1996). Toward a new definition of the employment relationship. International Labour Review, 135(6), 683-695.
NÉMETH, E., MAJOR, S. & SZABÓ, G. (2010). Market Labour Expectations and Higher Education: Opposing Trends, In: Klucznik-Törő, A; Bódis, K; Kiss-Pál I (eds.) From Higher Education to Innovation, Management and Enterpreneurship in a Changing Market: International Conference and Workshops on Higher Education Partnership and Innovation (IHEPI 2010): Proceedings. Budapest: Publikon Kiadó, 103-111.
RIFKIN, J. (1995). The End of Work – The Decline of the Global Labor Force and the Dawn of the Post-Market Era.
New York: Tarcher/Putnam
TÓTH, A & ZÉMAN, Z. (2017). Stratégiai pénzügyi controlling és menedzsment (Strategic Financial Controlling and Management). Budapest: Akadémia Kiadó
TÖRÖK, E. (2006). Túlléphetünk-e a bérmunka társadalmán? (Can we transcend the society of wagework?). Szociológiai Szemle, 16(2), 111-130.