Introduction
Milk and milk products play an important role in human nutrition; thus milk production is an important issue in the global food supply chain, particularly in developing coun- tries. Milk is one of the most valuable human staple foods of high nutritional value. Although many nutrients and vitamins are found in vegetables and can be produced synthetically as well, this type of animal protein is essential for a balanced diet.
Consequently, in terms of global nutrition supply, it is essential to increase milk production efficiency in the future to meet the enormous dairy product demand of explosive global population growth. From an economics as well as a social perspective, increasing the efficiency level of milk production is a highly important issue for most countries of the world. Production efficiency should be a priority area for both European Union and Hungarian dairy farms to ensure that a single dairy farm can also produce milk competitively and efficiently for the national and global markets in an eco- nomically, socially and ecologically sustainable way.
Oligopolistic Hungarian dairy processors exhibit price setting behaviour directed towards the milk producers, who have to follow a price-taking behaviour in the market because of their low level of market concentration. If milk producers want to increase their profitability, the only way of doing so is to increase their efficiency level.
The aim of this paper is to explore the efficiency of Hun- garian milk production. More concretely, we would like to answer the following research questions:
1. What differences are observable in the overall techni- cal efficiency of Hungarian dairy farms between 2008 and 2017?
2. What differences can be observed in the technical efficiency of Hungarian small, medium and large scale dairy farms?
3. What differences exist in the three main Hungarian regions’ technical efficiency indicators for milk pro- duction?
Global cow milk production has shown a continuously rising trend in the last three decades. According to Fasostat (2019) data, global cow milk production has increased by more than 50 percent between 1983 (450 million tonnes) to 2017 (678 million tonnes). The biggest cow milk producer in terms of quantity in the world is Europe (32.69%), followed by Asia (30.18%) and the American continent (27.21%).
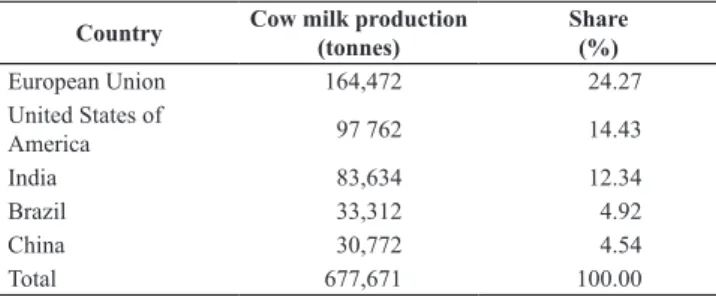
Hungary produced 1.967 million tonnes of milk in 2017, which was around 0.29 % of the global and 0.89% of the European production (Faostat, 2019). Regarding countries, the biggest cow milk producer in the world was the Euro- pean Union in 2017 with 164.5 million tonnes of produc- tion, giving around 24.27% of global production alone (Table 1).
As to trade, global cow milk exports – measured as milk equivalent – totalled 126.6 million tonnes in 2017, out of which 59.51% came from the European Union (75.34 mil- lion tonnes), while 14.74% (18.66 million tonnes) came from New Zealand. Inside the EU, the biggest milk exporter country was Germany (16.21 million tonnes), followed by the Netherlands (11.81 million tonnes). On the import side, 125.25 million tonnes of cow milk were imported all around the globe in 2017, most of which went to the European Union (45%) and China (11%).
In the case of Hungary, milk production has been contin- uously increasing since 2009, and it has now reached 1.924 million tonnes per year (HCSO, 2019). Production in terms Krisztián KOVÁCS* and István SZŰCS*
Exploring efficiency reserves in Hungarian milk production
This paper aims to explore the efficiency of Hungarian dairy farms. Based on FADN data representing more than 950 dairy farms in Hungary, our sample contains more than 6800 data points which we analysed by applying different Data Envelopment Analysis models. Results suggest that the average technical efficiency of the Hungarian dairy sector during the examined 10 years was 77.6%, meaning that output could be increased by 22.4% without changing the level of input (efficiency reserve).
Large and small farms are more efficient (79.2%) than medium sized farms (59.2%). Moreover, large farms keeping more than 501 dairy cows were found to be more efficient (92.5%) than the other two size categories (77.9% and 65%, respectively).
Farms located in Northern Hungary had less efficiency reserves (23.6%) that the farms operating in the Great Hungarian Plain, Central Hungary (34.8%) or in the Transdanubian Region (27.6%). All this suggests high reserves for potential efficiency growth.
Keywords: DEA, dairy farms, efficiency, Hungary, milk sector JEL classifications: Q12, Q13
* University of Debrecen, Faculty of Economics and Business, Institute of Applied Economic Sciences. Böszörményi út 138, 4032-Debrecen, Hungary.
Corresponding author: kovacs.krisztian@econ.unideb.hu
Received: 2 October 2019, Revised: 16 December 2019, Accepted: 7 January 2020.
Table 1: The TOP 5 cow milk producers in 2017.
Country Cow milk production
(tonnes) Share
(%)
European Union 164,472 24.27
United States of
America 97 762 14.43
India 83,634 12.34
Brazil 33,312 4.92
China 30,772 4.54
Total 677,671 100.00
Source:own calculations based on Faostat (2019) data
of quantity was the highest in 1988 when Hungarian annual milk production was 2.95 million tonnes, coinciding with a record number of dairy cows (2.5 million). Cattle numbers have significantly decreased since 1990 - in 2017, Hungary had 630,000 cattle and 395,000 cows (Figure 1).
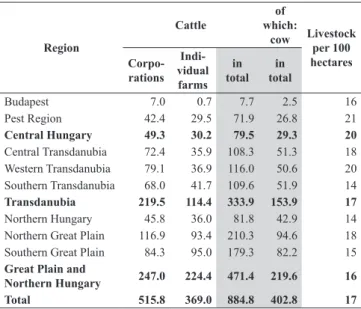
Table 2 summarises Hungarian cattle and cow livestock numbers in a regional breakdown. The Great Plain repre- sents 44.02% of the total cattle livestock and 43.89% of the cow livestock, followed by Northern Hungary (9.26% and 10.65%) and the Transdanubia region (37.74% and 38.21%), respectively. Average cattle density in Hungary is 17 dairy cows/100 ha (HCSO, 2019).
Figure 2 shows basic efficiency indicators of Hungarian milk production. The number of dairy cows has been dra- matically decreasing until 2010, but annual milk production seems to have stagnated around 1.8 million tonnes, imply- ing an increasing yield per dairy cow indicator. Yield growth
of milk production per dairy cow is clearly observable from 5000 litres/head to 8000 litres/head on average from 1990 to 2017.
Measuring the productive efficiency of the dairy sector is important to both the practical experts and the policymak- ers. “If economic planning is to concern itself with practical industries, it is important to know how far a given industry can be expected to increase its output by simply increasing its efficiency, without absorbing further resources.” (Far- rell, 1957) Thus, measuring the technical performance can be important for the sector not only with the purpose of increasing the dairy cows’ yield performance, but also for increasing the efficiency of other resources, as well as for raising incomes at individual dairy farms. The question of considerable substance is how we can measure dairy farms’
performance, using not only one output and one input, but also several parameters, which best represent dairy farm management practices.
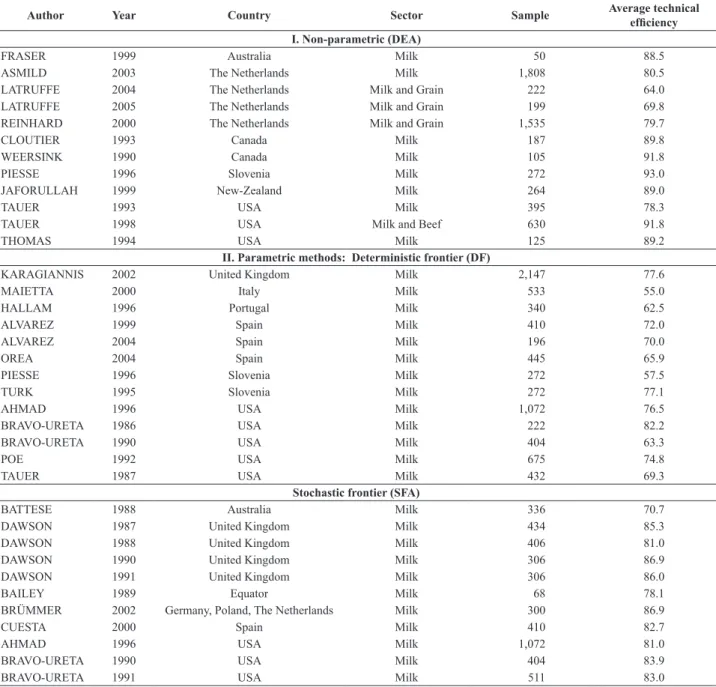
In the scientific literature, a number of different papers can be found analysing a country’s technical efficiency with different methods. Based on the excellent work of Bravo- Ureta et al. (2007), Table 3 summarises the most important papers written until 2005. A recent review on available arti- cles in the topic was provided by Galluzzo (2019).
Method and data
Measuring efficiency is a widely used concept in eco- nomics. Economic (or overall) efficiency is expressed as a combination of technical and allocative (or price) efficien- cies. Technical efficiency is the ability of the farmer to obtain maximal output from a given set of inputs, while allocative efficiency measures the ability of the farmer to use inputs in optimal proportions, given their input prices and technology (Coelli et al., 2005). Various methods exist in economics to measure efficiency, out of which probably the most well- known is Data Envelopment Analysis (DEA).
0 500 1,000 1,500 2,000 2,500
Cow Cattle
2017 2016 2015 2014 2013 2012 2011 2010 2009 2008 2007 2006 2005 2004 2003 2002 2001 2000 1995 1990 1980 1970 1960 1950 1895 1851
number of livestock (thousand head)
Figure 1: Hungarian cattle and cow livestock numbers from 1851 to 2017.
Source: own composition based on HCSO (2019) data
Table 2: Regional share of Hungarian cattle and cow livestocks.
Region
Cattle of
which:
cow Livestock per 100 hectares Corpo-
rations Indi- vidual farms
totalin in total
Budapest 7.0 0.7 7.7 2.5 16
Pest Region 42.4 29.5 71.9 26.8 21
Central Hungary 49.3 30.2 79.5 29.3 20
Central Transdanubia 72.4 35.9 108.3 51.3 18 Western Transdanubia 79.1 36.9 116.0 50.6 20 Southern Transdanubia 68.0 41.7 109.6 51.9 14
Transdanubia 219.5 114.4 333.9 153.9 17
Northern Hungary 45.8 36.0 81.8 42.9 14 Northern Great Plain 116.9 93.4 210.3 94.6 18 Southern Great Plain 84.3 95.0 179.3 82.2 15 Great Plain and
Northern Hungary 247.0 224.4 471.4 219.6 16
Total 515.8 369.0 884.8 402.8 17
Source: own calculations based on HCSO (2019) data
0 100 200 300 400 500 600 700 800
Number of Dairy Cow (DC) (thousand head) 2017 2016 2015 2014 2013 2012 2011 2010 2009 2008 2007 2006 2005 2004 2003 2002 2001 2000 1999 1998 1997 1996 1995 1994 1993 1992 1991 1990
million liter, liter/head thousand head
1,000 2,000 3,000 4,000 5,000 6,000 7,000 8,000
Milk yield/DC (liter) Milk production (million liter)
Figure 2: Hungarian milk production and its efficiency.
Source: own calculations based on HCSO (2019) data
Table 3: Most important articles measuring efficiencies in the dairy sector, 1990-2005.
Author Year Country Sector Sample Average technical
efficiency I. Non-parametric (DEA)
FRASER 1999 Australia Milk 50 88.5
ASMILD 2003 The Netherlands Milk 1,808 80.5
LATRUFFE 2004 The Netherlands Milk and Grain 222 64.0
LATRUFFE 2005 The Netherlands Milk and Grain 199 69.8
REINHARD 2000 The Netherlands Milk and Grain 1,535 79.7
CLOUTIER 1993 Canada Milk 187 89.8
WEERSINK 1990 Canada Milk 105 91.8
PIESSE 1996 Slovenia Milk 272 93.0
JAFORULLAH 1999 New-Zealand Milk 264 89.0
TAUER 1993 USA Milk 395 78.3
TAUER 1998 USA Milk and Beef 630 91.8
THOMAS 1994 USA Milk 125 89.2
II. Parametric methods: Deterministic frontier (DF)
KARAGIANNIS 2002 United Kingdom Milk 2,147 77.6
MAIETTA 2000 Italy Milk 533 55.0
HALLAM 1996 Portugal Milk 340 62.5
ALVAREZ 1999 Spain Milk 410 72.0
ALVAREZ 2004 Spain Milk 196 70.0
OREA 2004 Spain Milk 445 65.9
PIESSE 1996 Slovenia Milk 272 57.5
TURK 1995 Slovenia Milk 272 77.1
AHMAD 1996 USA Milk 1,072 76.5
BRAVO-URETA 1986 USA Milk 222 82.2
BRAVO-URETA 1990 USA Milk 404 63.3
POE 1992 USA Milk 675 74.8
TAUER 1987 USA Milk 432 69.3
Stochastic frontier (SFA)
BATTESE 1988 Australia Milk 336 70.7
DAWSON 1987 United Kingdom Milk 434 85.3
DAWSON 1988 United Kingdom Milk 406 81.0
DAWSON 1990 United Kingdom Milk 306 86.9
DAWSON 1991 United Kingdom Milk 306 86.0
BAILEY 1989 Equator Milk 68 78.1
BRÜMMER 2002 Germany, Poland, The Netherlands Milk 300 86.9
CUESTA 2000 Spain Milk 410 82.7
AHMAD 1996 USA Milk 1,072 81.0
BRAVO-URETA 1990 USA Milk 404 83.9
BRAVO-URETA 1991 USA Milk 511 83.0
Source: own composition based on Bravo-Ureta et al. (2007)
respectively. X indicate the K*M input matrix and Y shows the M*N output matrix for all N firms. To measure efficiency we want to obtain the measure of the ratio of all outputs over all inputs, like u’yi / v’xi, where u represents the M*1 vector of output weights and v represents the K*1 vector of input weights. The obtained efficiency score will be less than or equal to one. As this model has an infinite number of solutions, Charnes et al. (1978) added one more constrain (v’xi = 1) and reformulated the objective function a bit, thereby creating the multiplier form of DEA. Using the dual- ity linear programming method from the multiplier formula, we get the envelopment form as follows:
xminθλ θ,
constrains: –yj + Yλ≥ 0, (2)
θxi –Xλ ≥ 0, λ ≥ 0,
where λ represents the vector of peer weights. θ is a scalar and its value is the efficiency score for the i-th firm, where the value of 1 indicates the frontier and hence a technically efficient firm (which does not exist in practice). This linear programming problem must be solved N times, once for each firm in the sample. Hence, each firm has its own θ efficiency score (Coelli et al., 2005). The points of the fully efficient firms determine the fully efficient frontier line.
Equation 2 takes the i-th firm and then seeks to radially contract the input vector, xi, as much as possible, while still remaining within the feasible input set. The inner boundary of this set is a piece-wise linear isoquant (see Equation 1), determined by the observed data points which are the firms in the sample. The radial contraction of the input vector, xi, produces a projected point, (Yλ, Xλ), on the surface of this method. This projected point is a linear combination of these observed data points. The constraints in Equation 2 ensure that this projected point cannot lie outside the feasible set (Coelli et al., 2005).
The constant returns to scale assumption is acceptable if the firms in the sample are operating at an optimal scale, but in practise, firms with imperfect competition do not behave like that. Banker et al. (1984) suggested a model which deals with a variable returns to scale (VRS) situation. This model is quite similar to the CRS model except by adding a convex- ity constraint (N1’λ = 1) to the model, accounting for the variable returns to scale.
The approach by Banker et al. (1984) and Coelli and Perelman (1996) presents an output oriented model, where firms have fixed quantity of resources (capital, labour, live- stock and land) and want to produce output (milk and calf) as much as possible. This model is very similar to the input orientated model. The formula of an output orientated VRS model is the following:
maxϕλ ϕ,
constrains: – ϕ yj + Yλ≥ 0,
xi –Xλ ≥ 0, (3)
N1’λ = 1 λ ≥ 0, Farell (1957) distinguishes input and output orientated
measures depending on which factor we assume altering.
In the input orientated measure, the input quantities change without changing the output quantities. The assumed objec- tive is to reduce the input quantities as much as possible, without changing the output quantities. The other measure of efficiency referred to by both Farell (1957) and Coelli et al. (2005) is the output orientated measure. Here the ques- tion is by how much output quantities can be proportionally expanded without altering the input quantities. If technology is characterised by constant returns to scale, the two orien- tations produce the same technical efficiency score. Differ- ences, however, appear under changing returns to scale.
Figure 3 presents technical efficiencies from an output orientation, considering a firm with two outputs (q1 and q2) and a single input (x1). Keeping input quantity fixed, ZZ’
represents the production possibility curve and point B rep- resents an efficient, while point A an inefficient firm. The distance AB measure shows the technical inefficiency, hence the output orientated technical efficiency is the ratio of 0A and 0B, which shows the percentage by which outputs could be increased without requiring extra input.
The input and the output orientated models estimate the same frontier and identify the same set of firms as being efficient. The difference is the efficiency measures associ- ated with the inefficient firms that may differ between the two methods (Coelli et al., 2005). In practice, the efficient isoquant is not known, hence researchers have to estimate it from the sample data using different kinds of analyses. These will be introduced in the following section.
The DEA framework was introduced by Farrell (1957) and popularised by Charnes et al. (1978). It is a non- parametric mathematical programming approach to frontier estimation. The first models were the input orientated CRS models, solving the following linear programming problem for each firm to obtain the efficiency score:
maxu,v (u’yi / v’xi ),
constrains: u’yj / v’xj ≤ 1, j = 1, 2, ... , N, (1) u,v ≥ 0
assuming K inputs and M outputs for each N firms. For the i-th firms the column vectors are represented by xi and yi,
7
0 7’
A B q /x2
q /x1 1 Figure 3: Technical efficiency from an output orientation.
where N1 is an N*1 vector of ones, 1 ≤ ϕ < ∞ and ϕ–1 is the proportional increase in output that could be achieved by the i-th firm, with input quantities held constant. 1/ϕ determine the technical efficiency score, which lies between zero and one. The DEA VRS formula envelopes the data points more tightly and provides higher or equal efficiency scores than the CRS model. The difference between the VRS and CRS technical efficiency scores is the scale inefficiency.
In this paper, we use the European Farm Accountancy Data Network (FADN) database, containing, inter alia, Hun- garian dairy farm level data from 2008 to 2017. We use two output variables in our output orientated DEA model - the first is cow’s milk and milk products (values expressed in euro in the database under the following code: SE216), while the second is the beef and veal variable (values expressed in euro in the database under the following code: SE220).
For the farms model (Kovacs, 2014), the five input variables were as follows:
1. Total fixed assets: It includes land associated to agri- cultural activity and the buildings and is expressed in euro. These assets remain constant all the times, or at least for a prolonged time to serve the population of economic activity and they do not or just slightly wear out during production. This is shown under the following code in the FADN database: SE441.
2. Total current assets: The current assets comprise stocks and other rotating equipment and expressed in euro.
This variable is basically the value of breeding ani- mals which wear during production, or stocks wholly destroyed, or else pass through the target assets, so their continuous replacement is essential. The follow- ing code is associated in the FADN database: SE465.
3. Labour input: It contains the total number of working hours under the code SE011.
4. Major cost items: Most important cost categories per- tain here and these items are also expressed in euro.
This category includes livestock feed and energy costs as well as the value of the plant and lubricants as well. Direct costs also pertain here, containing vet- erinary expenses, but including a variety of tests or storage costs that can be directly charged to the sec- tor. These are listed under the following codes in the FADN database: SE310 + SE330 + SE345.
5. Dairy cows: This category includes cows expressed in European Livestock Units (LSU) which are held primarily for milk production. This can be found under the following code in the FADN database:
SE085.
The database contains 6818 data points, which includes data from about 974 dairy farms in Hungary. Efficiency indi- cators of dairy farms were analysed between 2008 and 2017.
We presumed an output orientation DEA model, estimating to what extent production (outputs) can be proportionally increased (maximised) without changing the input quantities used (Kovacs, 2014).
Based on farms’ standard production values, three cat- egories can be created:
1. small farms (annual SPV between 4 000€ and 25 000€);
2. medium farms (annual SPV between 25 000€ and 500 000€) and
3. large farms (annual SPV more than 500 000€).
Among the examined 974 farms, 24% was large, 61%
was medium and 15% was considered small.
As to livestock sizes, categories are as follows:
1. small farms (less than 50 dairy cows) 2. medium farms (between 51 and 500 cows) 3. large farms (more than 501 cows)
Large farms represents 8%, medium farms 41% and small farms 51% out of the total 974 dairy farms in this regard.
In terms of geographical regions, the majority of the farms (59%) were located in the Great Hungarian Plain and Central Hungary (574 farms). 30% of the farms in the sample (294 farms) was located in the Transdanubian Region and only 11% were located in Northern Hungary (106 farms).
The efficiency of Hungarian milk production
Before presenting results of our model runs, Table 4-7 contain the descriptive statistics of our variables used.
It becomes evident from our model runs that the effec- tiveness of the Hungarian dairy farms is 77.60% on aver- age (Table 7). This means that effective backup solution (reserves) lies in an average of 22.40% of the Hungarian milk producing farms. In other words, Hungarian milk producers can still have an opportunity to increase their efficiency by 22.40% simply by using their inputs more effectively.
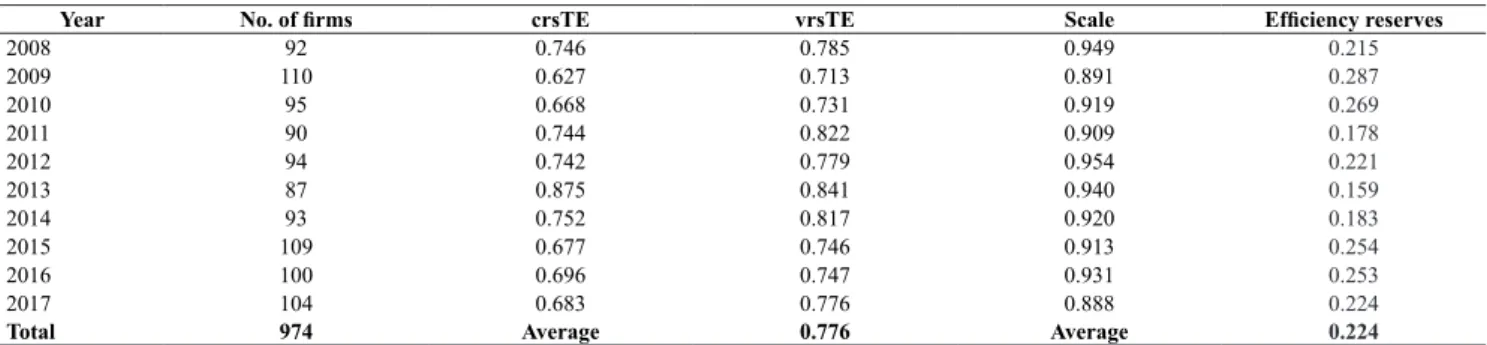
According to Table 8, the most efficient years were 2011 and 2013, reflecting the record low levels of cattle livestock as evident from Figure 1. The biggest technical efficiency reserves was observable in 2009, where Hungarian dairy farms could have increased their output by 28.7% without using more inputs for milk production. Table 8 also reflects declining efficiency scores after 2013.
Table 9 shows our results by farm size. Efficiency of large farms was the highest with 79.2% technical efficiency, fol- lowed by 71.2% of technical efficiency for small farms and 59.2% technical efficiency of medium farms. This means that small farms are found to be more efficient than medium ones and the difference between the efficiency of small and large farms is not remarkable. On average, Hungarian dairy farms can increase their efficiency by 30%.
As to results by livestock sizes, the highest efficiency number belongs again to large farms (92.5%), which means that they are close to their possible production frontier curve line; their efficiency reserve is 7.5%. Efficiency of medium farms was 77.9%, while that of small farms was 65% (Table 10). It should be noted that medium size farms based on live- stock sizes were found to be more efficient than on a simple farm size basis.
Last but not least, the technical efficiency by the three geographic regions was calculated. As evident from Table 11, the most efficient region was the Northern Hungarian Region, with a technical efficiency of 76.4%. It should be
Table 4: Sample descriptive statistics by year.
Year
Cows’ milk &
milk products production
(EUR)
Beef and veal production
(EUR)
Total fixed assets (EUR)
Total current assets (EUR)
Labour input (hour)
Major direct cost (EUR)
Number of dairy cows
(head)
Total num- ber of farms
(pieces)
2008 373,823 60,575 650,211 399,047 26,513 321,832 175 92
2009 281,889 45,010 562,776 331,901 19,415 240,213 142 110
2010 319,018 54,140 647,938 369,104 23,018 300,767 154 95
2011 402,807 80,091 867,799 534,022 29,873 389,513 177 90
2012 438,706 67,286 1,017,289 572,164 32,849 456,017 187 94
2013 483,666 67,620 1,094,249 587,617 33,378 481,023 200 87
2014 494,489 69,909 985,012 519,910 32,843 368,906 193 93
2015 412,914 58,714 924,484 483,252 30,495 347,278 194 109
2016 390,542 64,160 913,995 492,201 29,803 343,227 198 100
2017 476,826 63,947 883,324 498,396 28,099 421,946 191 104
Average 405,457 62,681 849,944 475,702 28,463 364,212 181 97
Standard Deviation 1,012,899 139,091 2,066,493 1,163,696 68,579 894,611 368 8
Minimum 100 49 2,119 1,710 270 552 2 87
Maximum 11,034,750 1,643,210 23,553,110 13,789,835 743,486 11,034,030 3,492 110
Source: own calculations based on FADN (2019) data
Table 5: Sample descriptive statistics by farm size.
Farm size category
Cows’ milk &
milk products production
(EUR)
Beef and veal production
(EUR)
Total fixed assets (EUR)
Total current assets (EUR)
Labour input (hour)
Major direct cost (EUR)
Number of dairy cows
(head)
Total number of
farms (pieces)
Large 945,194 135,374 1,784,327 1,019,456 71,546 862,764 407 229
Medium 189,051 36,320 426,814 218,417 16,727 170,284 103 599
Small 137,577 24,491 276,178 171,455 12,366 127,854 70 146
Source: own calculations based on FADN (2019) data
Table 6: Sample descriptive statistics by livestock size.
Livestock’s size category
Cows’ milk &
milk products production
(EUR)
Beef and veal production
(EUR)
Total fixed assets (EUR)
Total current assets (EUR)
Labour input (hour)
Major direct cost (EUR)
Number of dairy cows
(head)
Total number of
farms (pieces)
Large 2,453,505 371,909 4,382,150 2,585,674 180,516 2,209,447 1,015 79
Medium 365,455 58,027 754,328 407,913 30,839 334,115 190 397
Small 23,147 7,989 120,568 47,897 3,540 23,466 19 498
Source: own calculations based on FADN (2019) data
Table 7: Sample descriptive statistics by region.
Region
Cows’ milk &
milk products production
(EUR)
Beef and veal production
(EUR)
Total fixed assets (EUR)
Total current assets (EUR)
Labour input (hour)
Major direct cost (EUR)
Number of dairy cows
(head)
Total number of
farms (pieces) Great Hungarian Plain and
Central Hungary 312,884 55,591 606,434 331,060 25,927 290,119 155 574
Transdanubia 453,031 62,466 954,236 536,351 33,976 412,761 201 294
Northern Hungary 338,652 56,744 686,329 376,273 30,980 277,204 156 106
Source: own calculations based on FADN (2019) data
Table 8: Technical efficiency numbers in the Hungarian dairy sector by year.
Year No. of firms crsTE vrsTE Scale Efficiency reserves
2008 92 0.746 0.785 0.949 0.215
2009 110 0.627 0.713 0.891 0.287
2010 95 0.668 0.731 0.919 0.269
2011 90 0.744 0.822 0.909 0.178
2012 94 0.742 0.779 0.954 0.221
2013 87 0.875 0.841 0.940 0.159
2014 93 0.752 0.817 0.920 0.183
2015 109 0.677 0.746 0.913 0.254
2016 100 0.696 0.747 0.931 0.253
2017 104 0.683 0.776 0.888 0.224
Total 974 Average 0.776 Average 0.224
noted that this does not mean that these farms are the best in Hungary, although it is true that these farms used their resources most effectively, when compared with other regions. The dairy farms located at the Great Hungarian Plain and Central Hungarian Region were the least efficient ones compared to the other two regions. They could increase their output with 34.8% without using more resources.
Conclusions
This paper analysed the technical efficiency of Hungar- ian dairy farms from 2008 to 2017. We have seen some declining trends in efficiency after 2013 with significant dif- ferences by farm sizes and regions. On a farm size basis, large farms were found to be the most efficient ones, fol- lowed by small farms (simple size basis) and medium farms (livestock size basis). Regionally, farms in the Northern Hungarian Region were found to be the most efficient ones.
All this suggests significant efficiency reserves in Hungarian dairy production. Besides the limitations of the methodol- ogy, this research can help decision makers to better under- stand the efficiency of diary farms under different scenarios.
We would suggest that the future development of the sector should concentrate on large and medium farms, especially considering their magnitude and results obtained. Future research would be necessary to examine the reasons for the differences found between regions, in terms of livestock sizes and the standard production values of farms. There are many factors that could significantly influence the results obtained, ranging from farm characteristics to environmental and socio-economic factors.
Possible directions for future research might be to esti- mate allocative efficiency models involving different regions or maybe countries, taking into account that different input and output prices also play an important role when attempt- ing to compare efficiency among the different regions.
Unfortunately, the FADN database – when consulted directly – cannot contain information about prices, but indi- rectly we can calculate it. These analyses need more time and a more complex model so as to be able to estimate the frontiers. To get a better picture of dairy sector efficiency in the future we need to analyse other important fields or sectors (e.g. feeding industry, plan cultivating sectors) which play important role in the dairy sector or instead take the examined country import-export market and use other meth- ods to measure efficiencies like the total factor productivity (TFP) indexes. These methods may be used for analysing other EU countries’ or regions’ sectors, if proper data is available for analysis. The adaptability of this model is wide so we can analyse different sectors in the agriculture sector and different industrial sectors as well.
Table 9: Technical efficiency numbers in the Hungarian dairy sector by farm size.
Size category Number of
firms crsTE vrsTE Scale
Large 229 0.776 0.792 0.981
Medium 599 0.564 0.592 0.955
Small 146 0.631 0.717 0.894
Total 974 Average 0.700
Source: own calculations based on FADN (2019) data
Table 10: Technical efficiency numbers in the Hungarian dairy sector by livestock size.
Livestock’s
size category No. of firms crsTE vrsTE Scale
Large 79 0.879 0.925 0.951
Medium 397 0.705 0.779 0.908
Small 498 0.579 0.650 0.897
Total 974 Average 0.785
Source: own calculations based on FADN (2019) data
Table 11: Technical efficiency numbers in the Hungarian dairy sector by region.
Region No. of firms crsTE vrsTE Scale
Great Hungarian Plain
and Central Hungary 574 0.589 0.652 0.912
Transdanubia 294 0.669 0.724 0.927
Northern Hungary 106 0.709 0.764 0.934
Total: 974 Average: 0.713
Source: own calculations based on FADN (2019) data
References
Banker, R.D., Chames, A. and Cooper, W.W. (1984): Some Models for Estimating Technical and Scale Inefficiencies in Data En- velopment Analysis. Management Science, 30 (9), 1078–1092.
https://doi.org/10.1287/mnsc.30.9.1078
Bauer, P.W., Berger, A.N., Ferrier, G.D. and Humphrey, D.B.
(1998): Consistency conditions for regulatory analysis of fi- nancial institutions: a comparison of frontier efficiency mod- els. SSRN Electronic Journal, 50 (2), 85–114. https://doi.
org/10.1016/S0148-6195(97)00072-6
Bravo-Ureta, B.E., Solís, D., Moreira López, V.H., Maripani, J.F., Thiam, A. and Rivas, T. (2007): Technical efficiency in farm- ing: a meta-regression analysis. Journal of Productivity Analy- sis, 27 (1), 57–72. https://doi.org/10.1007/s11123-006-0025-3 Charnes, A., Cooper, W.W. and Rhodes, E. (1978): Measuring
the efficiency of decision making units. European Journal of Operational Research, 2 (6), 429–444. https://doi.
org/10.1016/0377-2217(78)90138-8
Coelli, T., Rao, D.S.P., O’Donell C.J. and Battese, G.E. (2005): An introduction to efficiency and Productivity Analysis, Springer, Germany.
Coelli, T.J. and Perelman, S. (1996): Efficiency Measurement, Multiple-output Technologies and Distance Functions: With Application to European Railways. CREPP Discussion Paper no. 96/05, University of Liege, Liege, France.
EUROSTAT (2019): http://epp.eurostat.ec.europa.eu/portal/page/
portal/agriculture/data/database (Accessed in August 2019) FADN (2019): http://ec.europa.eu/agriculture/rica/database/data-
base_en.cfm (Accessed in August 2019)
FAOSTAT (2019): http://www.fao.org/faostat/en/#data (Accessed in September 2019)
Farrell, M.J. (1957): The measurement of productive efficiency.
Journal of the Royal Statistical Society, Series A, 120 (3), 253–
281. https://doi.org/10.2307/2343100
Galluzzo, N. (2019): An analysis of technical efficiency in Icelan- dic dairy and sheep farms. Studies in Agricultural Economics, 121 (3), 144–150. https://doi.org/10.7896/j.1916
HCSO (2019): http://www.ksh.hu/docs/eng/xstadat/xstadat_
long/h_omf001c.html?down=111 (Accessed in August 2019) Kovacs, K. (2014): Dairy farms efficiency analysis before the quota
system abolishment. Apstract, 8 (2–3), 147–157.