86
Chapter 7
Considering renewable potentials and supporting policy for energy transition
Viktor Varjú
1. Introduction
In tackling climate change, governments and other agents have launched initiatives to reduce greenhouse gas emissions. This involves the decarbonisation of energy – among others – due to its serious environmental burden across the whole lifecycle [1], and the increased use of renewable energy [2]. However, it requires a comprehensive and multilevel approach.
The EU2030 goal includes the increase of renewable energy share to at least of 32% of the EU's energy consumption. Renewables, especially photovoltaic energy investments and use have become very popular over the last few years. New technologies and solutions can contribute to increasing development in renewable energy.
The deployment of renewable energy systems has increased significantly since 2005, mainly due to the growth of photovoltaic and wind power generation, especially in the European Union, where Germany has been the market leader since 2004 [3]. For the first time in 2017, the EU generated more electricity from renew- able sources (specifically wind, solar and biomass) than from coal. In Germany (which is a leader alongside Denmark), in 2017, 30% of electricity was generated using wind, solar and biomass power plants [4]. A similar figure can be found in 2020 when renewable energy reached its highest recorded share in the global electricity mix in 2020 (with an estimation of 29%). The pandemic also contributed to this favourable data. Every month of full lockdown during the pandemic reduced electricity demand by 20% on average, or more than 1.5% on an annual basis [5].
As an EU member, Poland is committed to securing a 15% share of RES in final energy consumption by 2020 [6] while Hungary aimed at 13% (with an ex- tension to 14.65%) of share. The new commitments are still not among the highest in Europe (21% of RES in gross final energy consumption in 2030 both in Hungary and Poland). Both countries aim to continue with nuclear power as part of their
87
energy policy, and besides, Poland still is aiming at a 60% share of coal in elec- tricity generation in 2030 [7-8]. These trends cannot be ambitious and show a very slow transition.
In order to move towards energy transition, to increase the use of renewable energy, it is essential to take into consideration the available potential. Develop- ment on (local) resources can be based on external resources or based on internal resources, but most often it lies in the combination of the two [9]. In the renewable energy resource availability ‘catalogue’, theoretical, geographical, technical, eco- nomic, and market potential are the factors most often taken into consideration [10]. These are also internal and external factors; however, an important element is missing, that is, the social factor. For improving renewable energy use, it is es- sential to take into consideration the available knowledge about renewables and the intention of agents (whether they be a market player, a governmental organi- sation, NGO or a simple household).
This chapter seeks to examine the different types of potential that might in- fluence the increase in renewable energy development. Emphasising the factors within the different types of resource potential, the chapter also gives an insight into the Polish and Hungarian situation. As this is an overview, data and literature sources are provided in the text to go further and more deeply into the assumption of local potential taking into consideration the complexity of renewable energy use tackled in this chapter.
Hence, the methods in use for preparing this chapters based partly on the dif- ferent international and national projects (see in the acknowledgement) of the au- thor (where the author was the principal investigator of the Hungarian team). This synthesising analysis is supplemented by further literature and secondary analysis.
2. Energy transition
The notions of sustainability transition and technological transition have emerged in recent decades [11-12]. However, technological transitions not only involve changes in technology, but also changes in user practices, regulation, in- dustrial networks, infrastructure, and symbolic meaning or culture [13]. Sustaina- bility transition requires broader engagement, empowerment, and breakthrough strategies [14]. Transitions are situated in a 'socio-technical landscape' that has a set of heterogeneous factors, includes place-based cultural and normative values and situated environmental challenges [13]. Concerning the model of Geels [11], energy transition is embedded into sustainability transition (Figure 1).
A multi-level perspective framework is a dominant concept in transition liter- ature. Geels [13] used this approach to describe the interrelationship between the tiers of niche, regime, and socio-technological landscape. Transition can be launched not only by governing processes within the niche but also by develop- ments at the other two levels [13, 15]. It also might mean that the changes in an individual situation or knowledge (that are usually caused by the change in external circumstances both at an upper or the same level) can open up the way towards
88
transition. Concerning Truffer and Coenen [16], this means the adaptation (or translation c.f. [17] or [18]) of national and international factors to the local con- text [16], which might include the knowledge, normative values, and resources that are locally available as well.
Figure 1. Framework of sustainability transition [11]
Source: Own elaboration
Energy transitions are underway on different levels, some reasonably fast, others excruciatingly slow, displaying different technologies and institutional structures, and reflecting differing public and private concerns and political ap- proaches [19]. Energy transition is a blurry and ambiguous concept [20], hence different approaches can be captured using the examples of different countries, for instance, taking Germany’s early and vigorous adoption of the concept of the En- ergiewende [21], or the stubborn adherence to coal by policymakers in Poland [22], while Hungary’s decarbonisation (or energy “transition”) based on nuclear energy (and new investment on it) and (small scale) photovoltaic (PV) investments.
Hence, energy transition does not necessarily mean decarbonising an energy sys- tem but simply moving from a primary energy source to another one [20].
Within energy transition, substituting renewable energy supplies for non-sus- tainable energy sources is considered to be one of the major mitigation options for climate change. Therefore, the “potentials” of renewable energy supplies (and re-
89
sources and circumstances) need to be assessed as accurately as possible. Estimat- ing these potentials is difficult, and requires a better understanding of locally avail- able natural resources, technology, economics, politics, and human behaviour [23], hence energy transition with renewable resources requires a comprehensive ap- proach to assess the (locally) available potentials.
3. Modelling the potentials
In order to increase the share of renewable energy production and consump- tion, a first issue to take into account is the availability of renewable energy resources. In the literature, different types of potentials can be found. One of the most frequently cited types and their definitions are the following [10]:
- Theoretical potential: The highest level of potential. This potential only considers natural and climatic parameters.
- Geographical potential: Geographical restrictions, elevation, land cover or land use can reduce the theoretical potential. Hence the geographical potential is the theoretical potential limited by the resources at geographical locations that are suitable.
- Technical potential: The geographical potential is further reduced due to tech- nical limitations.
- Economic potential: The economic potential is the technical potential at cost levels considered competitive.
- Market potential: The market potential is the total amount of renewable energy that can be implemented in the market taking into account the demand for en- ergy, the competing technologies, the costs and subsidies of renewable energy sources, and the barriers [10]. A significant element or influencing aspect of the market potential is the incentive usually produced by states and represent- ing the energy policy of a country (or meta governing level).
Beside the "hard" element, there are soft factors that can influence the available resources for use. Comprehensive management of local resources and the local development solutions (including renewable development) based on its resources presuppose the presence of an actor with a mandate to advance the community interest. In many countries, this agent is usually the local/regional government [9].
But before the local/regional government can take any action as an agent, it needs knowledge about the locally available resources (geographical potential), the best available technology (technological potential), the market that should be apply lo- cally, and the attitude of local actors (i.e. are they willing and capable to install any renewable resources?). All this can be named Local management potential.
To learn about these potentials, to know which potential can be used and how they can be achieved, in other words, the transfer of knowledge, is also challeng- ing. Collaboration, open communication, and trust between the actors involved are important and the actor also has to face the barriers [17].
90
3.1. Aspects of theoretical, geographical and technical potentials serving local development
3.1.1. Resource potentials
In general, estimating the radiant energy of the sun is the most common po- tential estimate, as the use and investment of this type of renewable energy source has become the most widespread in recent decades. The irradiation energy of a site can be determined in two ways. On the one hand, it can be measured with a pyra- nometer. Another type of determination is the use of analytical data available in different measurement databases. These make data from larger units of space avail- able instead of a single point, allowing calculations for larger areas. Examples of such databases are the European Centre for Medium Range Weather Forecasting or the NASA Surface Meteorology and Solar Energy databases. The most widely used database for comparing solar resources is the PVGIS (Photovoltaic Geo- graphical Information System) database of the EU Joint Research Centre [24]. Fig- ure 2 shows the theoretical potential of solar energy in Poland and Hungary. The figure clearly shows the theoretical differences that are further influenced and modified by geographic (elevation, exposure, land use etc.) features.
91
Figure 2. Yearly average global irradiance on an optimally inclined surface (W/m2), period 2007-16
Source: PVGIS, https://ec.europa.eu/jrc/en/PVGIS/downloads/CMSAF
Although PVGIS is suitable for assessing the theoretical potential of solar en- ergy use, one of the main obstacles to its usage is that it only calculates with a single technology [10]. In addition to this, technology is continuously evolving.
92
Therefore, there are several attempts to make individual measurements experienc- ing an appropriate technological set of solar energy use (and certainly to other re- newable energy uses). An example is made by the Regphosys (http://regphosys.eu) project, where three different PV panel technologies are measured and assessed regarding their electricity production, techno-economic and ecological characteristics [25].
For electromagnetic radiation, in addition to the duration, intensity is also im- portant. Both values can be influenced by (evidentially) physical and human geo- graphical factors. Especially around major cities, air pollution is a decisive factor.
Besides solar energy use, there is a growing global demand for wind energy production. A basic feature of geographical potential is that the wind speed increases with height. On the sloping side of the mountains, however, a wind shadow effect can be observed [26]. A large number of studies related to wind characteristics and wind power potential have been made in many countries in re- cent decades [27]. National meteorological services can usually provide infor- mation about the statistical characteristics of the wind, and a variety of probability density functions (PDFs) can be used to describe wind speed frequency distribu- tions. Among others, many wind energy potential assessment studies have been carried out with the help of the so-called Weibull distribution [28], and Bayesian methods are used to assess the uncertainties of the parameters [29]. Newer studies investigate the changes in future wind resources initiated by climate change that will influence wind resource assessments [30].
The use of biomass in energy production is usually classified by the states of matter of the biomass generated as a source of energy. Basically, solid, liquid and gas biomass can be distinguished. The most widely used (incinerable) bio- masses typically have relatively low content of humidity and consequently high calorific value. The use of these kind of biomasses requires special attention to be paid to the chemical composition and the careful deposition of non-combustible ashes. Biomass can also be categorised by the origin of its creation. Hence, bio- mass can originate from agriculture, forestry and solid waste [31]. Both theoretical and geographical potential can be assessed by taking into account the regional sta- tistical data on agriculture, forestry and waste management.
Agricultural biomass can be divided into biomass from farming – liquid and solid manure and biomass that originates from perennial crops. Depending on the technology, the biomass can be used for production of heat, electricity, mechanical energy (liquid fuels) as well as derivatives which can be used for the production of usable energy. Biogas is mostly produced by anaerobic digestion. The liquid bio- fuels bioethanol and biodiesel are produced by hydrolysis and esterification of veg- etable oils with alcohol. The theoretical annual energy potential of bioethanol pro- duction from corn and sugar beet and biodiesel production from rapeseed and soy are among the highest [31].
The most used wood biomass types for energy purposes are wood, wood chips, bark, sawdust, wood shaving, briquettes and pellets. Forestry biomass can
93
be used for the production of heat, electricity and liquid and gaseous fuels with different types of thermochemical and biochemical processes [31].
Solid waste biomass is considered a biodegradable part of municipal waste, besides, a significant amount can originate in the food and wood industries [31].
Waste can also be converted into fuel used for electricity production if not recycled, repaired or reused. In case remaining materials are deposited mixed, after a mechanical sorting process it still can converted into RDF (refuse derived fuel) or SRF (solid recovered fuel) and used [31].
Geothermal energy is the internal energy stored by the high temperature masses of the earth’s crust, mantle and core. This internal energy flows from the hot zones in the depths towards the surface, and this phenomenon is called geo- thermal heat flow. The closer the high temperature medium carrying the internal energy to the surface in a given area, the more advisable the production of geother- mal energy. The geothermal heat flow and the value of the geothermal gradient show specific territorial distribution [31].
3.1.2. Building upon potentials for modelling
In order to understand the operation and effects of innovation systems (including the transition of renewable energy), the mainstream research direction today is the study of economic life and the institutions of innovation phenomena.
Within institutional studies, a distinction is made between formal institutions, where, for example, legal and economic rules are analysed, and informal institu- tions, by which are meant the rules of a particular social arrangement [32]. Bodor (2013) calls this duality hard institutions, or “non-social factors,” or soft-informal institutions, or “social factors” [33].
All the factors that constitute the set of opportunities and provide value to developers and users are considered to be resources adaptive, bottom-up local development has at least three conditions: 1) Mobilisation of locally available com- munity and resources; 2) Possibility of room for manoeuvre in governance and decision making (at local/regional level); 3) Adaptive use of local development tools [14]. For the latter, the learning / lesson drawing / transfer of best practices can provide solutions to local problems for decision makers [18]; however, the adaption to the local context is the key aspect.
Local level has an important role within development processes through the interactions of local stakeholders and the mobilisation of internal and external re- sources [14]. This means the use of local natural, human, social and economic resources as well as resources from external sources, including financial or knowledge resources. The author argues that in renewable development locally available natural resources should be used due to the (environmental, social and economic) sustainability viewpoint that helps maintain local communities.
The local resource-based LED concept endeavours to use all local resources as efficiently as possible. One of the essential features of this local resource-based development approach is not the precondition of development, but its purpose: the
94
intervention’s focus on the interests of local actors and local resource owners of a territorial unit, and the interests of all other actors subordinate to it [14, 34].
Only a portion of local resources are owned by a community. However, resource mapping must also cover those elements that are privately owned, but the local government can have an impact on the way these resources are used and the opportunities for their development. The efficient use of resources is most often achieved in the common interest of the resource owners and the local community, in cooperation with the two groups of actors [35].
The resource mapping model provides a framework for decision makers.
The map provides current resource constraints and also considers alternative utili- sation options to assess development opportunities based solely on existing local resources [35].
Previous studies show that local governments do not treat environmental is- sues as predominant. In most cases, one of the major reasons is the lack of knowledge [36]. Therefore, a resource mapping should take into account the ecological and environmental conditions of the surroundings. The inventory of the use of renewable energy sources and the integration of their application possibili- ties into decision-making processes are no exception [35].
In order to make decisions at local level concerning the renewable energy sector – regardless of whether it is local regulation, investment permit, or self- sustaining investment – local decision-makers must have accurate knowledge of the potentials in renewable natural resources at the local / regional level [35].
Such a model, which is the basis of renewable resource mapping, has been created in the RURES (https://rures.eu). It provides information for local decision makers about solar, geothermic, biomass and waste potentials situated locally. This provi- sion of collection and synthesis of information on available renewable resources is especially important for smaller and / or rural municipalities. In most cases, expert knowledge and competence and capacity for coordination are absent.
Taking into account solar energy use, alongside the technology, land use is an important factor. It has been suggested to use brownfield and rooftop installation in order to avoid bad examples (such as in Hungary) of using active agricultural land for the installation of major photovoltaic systems. Due to its long-term research and measurement, the PVGIS database is appropriate for selecting tech- nologies. For Hungary, the PVGIS suggests crystalline silicon technology (poly- crystalline is the best in this country) with an annual optimal inclination angle of 35°, while in Poland it is 37°. Concerning other research, optimal tilt angles for fixed tilt solar PV panels is 30° for Hungary and 31° for Poland [37].
The meteorological module of PVGIS (https://re.jrc.ec.eu- ropa.eu/pvg_tools/en/#TMY) can help the user to visualise the windspeed and wind direction at a given point based on a 10 year-long measurement. Hence basic data for a typical meteorological year can be gained in (.csv, .json or .epw) data format. For the assumption of other resource potentials, there is a need for statisti- cal data and technological knowledge. In the aforementioned RURES project,
95
lower heating values for solid agricultural remains, annual energy potential of biogas production from different types of manure (cattle, pigs, poultry), and annual energy potential of liquid biofuel production (from corn, sugar beet, rape- seed and soy) were calculated based on national statistical databases and techno- logical documents. For wood biomass – using Corine land cover data – an assess- ment of the size of local forested areas (of settlements) were calculated taking into account the sustainability of the forest in extraction (4t/year/ha). A similar calcu- lation – based on waste management, and statistical and measurement data of waste composition – were applied to assess theoretical waste-based energetic potential [31].
The potential of geothermal energy is usually assessed by using the available data from geological boring made by oil companies. The catalogue of registered thermal wells can be the basis for these calculations [31]. In Hungary, the Pannon basin has a significant potential for geothermal usage [31], while in Poland, the Polish Lowlands is of similar importance [38].
As can be seen above, to take the potentials into account, there is a need for expert knowledge or knowing where resource data can be obtained. In order to bridge this gap, Mezei and colleagues – based on their elaborated methodology [31, 35] – have created an MS Excel-based model uploaded with data for all 3,255 settlements in Hungary [39]. In the drop-down menu template, all the settlements' decision makers can find the available renewable resources, the potentials and the exploitable energy (source) for their settlements. The aforementioned resource map includes not only data for renewables, but data for other resources (like human resources, and the state of the environmental, biodiversity, economic potentials of the settlement, meteorological data etc.). Here, Table 1 shows an image of the available renewable energy potentials. The model calculation is based on complex scientific methods; however, the representation was tailored to local decision mak- ers with an average understanding of technological and scientific language, i.e. scientific knowledge was translated.
Table 1. Content of the renewable energy potential decision-making tool for settlements created in the KÖFOP-2.3.3-VEKOP-16-2016-00001 project
From the drop-down menu, please choose the name of your settlement: ….
Data used for calculation
of the potentials for settlement Potentials, suggestions
Solar energy
Optimal annual irradiation
1452.72 kWh/m2
"The settlement does not have the best conditions for the use of solar energy in
the country (Hungary), but it is worth performing calculations."
Wind energy
Wind speed in a height of
75 m
5 m/s Calculated on the basis of the average na- tional reference value.
96
The rate of protected areas and inner settle-
ment
0.06%
No wind farm can be established in a na- ture conservation area and in the inner
area of a settlement!
Wind farm investment is not limited by the ratio of protected natural area to inner
area in your settlement.
Geother- mal po-
tential
Temperature of at least 50°C at a depth of 1,000 m.
Yes A thermal water investment may be considered.
Temperature at least 90°C at a depth of
2,000 m
No
Biomass Area of
forests 0.00 ha Potential Annual energy pro- duction capacity Protected
natural areas 0 ha 0.00 tons 0 MWh
Is there a livestock farm?
Yes Exploitable energy
Number of
cows 11 5,507 kWh
Number of
pigs 56 2,830 kWh
Number of
poultry 0 0 kWh
Landfill for landfill gas- fired power
plant:
No 0 kWh
Sewage plant that can be
used for a wastewater
gas power plant:
No 0 kWh
Is there a bio- mass power plant opera-
ting in the catchment area of the settlement?
No The establishment of new biomass power plant capacity is recommended.
Source: [39]
97
The model – based on a substantial number of cases – has been integrating data of energetics investments (costs, capacities, prices, economic indices etc.) us- ing the methodology – basically the set in the aforementioned Regphosys project [40-41]. Calculations concerned to payback time, unit cost (levelised cost of elec- tricity – LCOE) and net present value taking into consideration settlement poten- tials, desired located capacity, and the available and sufficient technological set- tings taking into account a wide range of technologies, for instance from gasifica- tion via pyrolysis to anaerobic digestions, in the case of biomass. Feedstock cost assessment by country and investment costs were also calculated [42]. However, these calculations require a considerable amount of market and economic data [31]
and have to consider the country specificities and the subsidy system of a given country. Hence, subsidy policy matters.
3.3. Influencing economic and market potentials
As Németh and colleagues argued, Eastern and Western Europe face different challenges in the growth of renewable energy and that has an effect on energy transition. Besides, in attempting to unify EU energy policy, Eastern Europe simply has a much deeper hole to climb out of to change their energy mix and traditional systems. Apart from the large hydropower capacity, mostly constructed several decades ago, renewable energy development is still at an early stage in Eastern Europe [43-44].
New technologies and eco-innovative solutions can contribute to increasing the share of renewable energy use; however, especially at an early stage, many renewable technologies require subsidy in order to spread out. Besides, a subsidy system can influence the geographical location of a renewable power plant [45], which is especially important in poorer regions where energy is needed. Further- more, physical geography is not the dominant factor in installation anymore in the case of solar energy use [44].
3.3.1. Subsidy policies
The aim of support policy is to correct non-priced pollution (external costs) from the burning of fossil fuels [46]. Jenner and his colleagues [47] argue that two main approaches can be distinguished in subsidies: it (1) regulates either the price of electricity from renewable sources or (2) the quantity produced [44].
Feed-in-tariff – taking over the price of electricity produced from renewable energy sources in a fixed way – is the most frequently used incentive method, sometimes combined with a premium price and a green certificate [48]. It has also been shown to be the most effective tool for promoting the fastest development of renewable energies [49]. The feed-in-tariff is higher than the normal market price, thus encouraging the spread of the investments [49-50]. However, the impact depends on the country-specific policy frames [51-54]. The guaranteed takeover price is regulated in many respects. In most countries, preferential conditions are no longer granted above certain installed capacities or are tied to a certain period.
98
However, in many countries the high-level feed-in-tariff spilled over into retail prices and resulted in the appearance of (sometimes speculative) investor groups in the renewable sector [55]. This phenomenon also pushes municipal or commu- nity initiatives into the background. (In Australia, as a counterexample, municipal- ities are “responsible” for half of all reductions in greenhouse gas emissions [44, 56]. Another issue raised in the research is that for grid-connected systems, the application of take-over price does not consider the spatial location of the power plant, which also increases feed-in and transportation costs over long dis- tances [44, 53].
The premium system, often accompanied by a tendering procedure, is an ad- ditional amount for the price calculated on the basis of the size of the renewable energy production, based on the (market) take-over price, which is used to 'reward' electricity produced from renewable energy sources. Typically, the combined mar- ket transfer price and premium price are usually less than the value of the guaran- teed transfer price [44, 47].
In the quota system, a given country's service / distributor providers grant a guaranteed receipt for electricity produced from renewable resources. The amount of the quota depends on the type of resource in use and the capacity of the power plant. The value of the receipt may vary from year to year. A fixed takeover price may also be specified for a fixed period [44].
The green certificate system is based on an obligation imposed on an element of the supply chain (such as consumption, distribution), according to which a cer- tain proportion of total electricity consumption must come from production based on renewable resources. A green certificate is required to show compliance with the obligation. These green certificates can then also develop a secondary trading market, which can make the system more expensive to operate [44, 48].
A "green certificate quota system” is a hybrid solution. The quota system is known as the quota obligation, which is called the “Renewable Portfolio Stand- ard” (RPS) in the USA. The price of energy is set by the participants in the pro- gramme, and quotas can also be traded [53, 55]. In this subsidy system, the renew- able energy producer receives different numbers of green certificates, depending on the technology applied. The electricity distribution company must purchase an electricity quota with the help of green certificates, between a specified minimum and maximum price. An additional obligation for the distribution company is to purchase a green certificate from renewable producers, the costs of which can then be passed on in the selling price of the electricity [57]. In the tendering process, (premium) quotas are spread during auctions / tendering procedures, based on which the beneficiaries are entitled to various benefits (e.g., subsidised takeover price) [55]. This procedure allows differentiations, hence territorial inequalities can be considered when allocating benefits [44].
Beside the subsidy of operation various forms of investment support are also emerging around the world. These include direct investment support, VAT or other
99
tax subsidies (e.g., business tax or income tax rebates or investment tax credit in the USA) and are also intended to encourage investment [44, 53].
3.3.2. Subsidies and their impacts in Poland and Hungary
During the take-off part of the trajectory of renewable energy investments, many countries applied incentive schemes (e.g., premium schemes, tendering).
The different supporting tools and their application periods, and the changes of supporting values resulted in territorial differences in Europe.
In Central and Eastern European (CEE) countries in 2000, firstly Poland (then Slovakia in 2003) declared tax-supporting and investment supporting tools in order to increase electricity production from renewable resources. In 2002 Czech Re- public, Hungary and Latvia, in 2003 Bulgaria, in 2004 Slovenia, in 2005 Slovakia, in 2007 Croatia and in 2009 Lithuania introduced fix or premium feed-in systems.
In 2008, Poland and Romania introduced quota systems (Jenner et al. 2013). How- ever, as can be seen later on, the date of introduction of a subsidy system could not influence the spread of renewables [44].
Having regarded firstly the photovoltaic (PV) deployment and other renewa- ble investments in Poland, one can say it was slow. The reason was the lack of an effective subsidy system and the negative approach of the Polish government (and the huge share of fossil energy in the mix). At the end of 2008, in-built PV capacity was little above 1 MWp, and almost all of these were off-grid investments. PV power plants had no priority in the connection to the grid and the connection pro- cess was also complex. Furthermore, the feed-in system did not distinguish be- tween types and sizes, therefore small investments had a drawback [58]. Poland introduced a feed-in tariff system from 2017, instead of the former green certifi- cate. The explanation (concerning the government) is that the feed-in tariff system is cheaper for the state and the treatment of it is also easier. The feed-in tariff is combined with auction in order to create a competitive situation [57]. The result of the change to the subsidy system caused a significant increased, achieving more than 1,300 MWp in-built capacity in Poland by the end of 2019 [44].
Unlike Hungary (see details bellow), Poland has a significant – actually the largest – increase in wind turbine energy production between 2000 and 2018. How- ever, the percentage of energy production from wind is only ranked fourteenth.
The dramatic increase is largely down to Poland’s previously very poor record [59]. This intensive increase was halted in 2017 (resulting in more than 50 GW in built capacity) and the effect of the (unfavourable) legal solutions for wind energy, in particular the Wind Farms Investment Act of May 20, 2016. The effect of the act was about a 10-fold increase in property tax, as it results from the conducted efficiency analysis for an example wind farm [6].
In the 2010's the promotion of renewables has contributed to an intensive in- crease in installed capacity, in wind energy, biomass and biogas in Poland. Be- sides, PV installations have become noticeable and a slight increase in hydroelec- tric power can be detected as well [6]. However, a challenging issue in Poland –
100
from the point of view of renewable transition – is that concerning the draft of the Energy Policy until 2040 taking into account domestic coal resources as an im- portant element of Poland’s energy security and the core of its energy balance [7].
As can be seen in Figure 2, the physical geographical situation is good in Hungary. From 2000, there has been a legal basis for renewable investments.
However, Hungary’s capacity remained very low until the mid of 2010's. Even though Hungary introduced steep recycling fees on solar modules in 2015 [44].
Until 2010, approximately 300 MW wind turbine capacity was settled; however, since then, no new permissions for major wind energy investment have been given.
The official reason cannot be published, the regulation on wind energy investment remained strict; it prescribes a 12 km buffer zone for non-household size wind farms from built-up or planned built areas. In practice, this means that there is no land for installing wind farms in Hungary [60]. Besides the traditional major water dam, solar energy is the preferred renewable energy in Hungary and the recent renewable energy policy builds upon this. However, the evolution of PV policy and investment has been uneven.
In Hungary, the actors of PV investments were and recently are mainly tele- communications companies and households (in order to reduce the price of elec- tricity). Hungary had the feed-in tariff (FIT) system until the end of 2016. The country had and has the lowest tariff in the region at around 32 HUF/kWh (without significant changes). This price meant 0.109 EUR/kWh in 2012, and recently the price of 34.14 HUF/kWh means 0.095 EUR/kWh. Although there is a Structural Fund-based support for renewable investors, the amount was very small. In Hun- gary, there was and still is another barrier to big investments. Electricity producers from 500 kWp must give an electricity production schedule for the operator in advance and if there is a discrepancy, the producers must pay a penalty. However, a manifold significant 'systemic' change occurred in the second half of the 2010's.
In the National Energy and Climate Plan of Hungary, the government had been committed to PV development, with special attention on small-scale (up to 50 kWp, household level) investments. Besides, based on the new energy strategy, domestic installed solar capacity is expected to exceed 6,000 MW by 2030 and to be close to 12,000 MW by 2040. Additionally, the boom is rooted in the fact that LCOE costs are now below the subsidised price level, and there is a favourable financing environment (low loan interest rate) for small scale investors [61]. Also, there was a change in the subsidy system in Hungary, from 2017. For PV investors (above 50 kWp), a new subsidy system is available, called/abbreviated in Hungar- ian METÁR, that is premium-type support. The former feed-in-tariff system (called KÁT in Hungarian) is available to small-scale investors, in its recent form, supposedly, until 2023. This special structure of subsidy meant that in the 2010's, the increase of cumulative PV capacity was due to the significant increase of small- scale (household, rooftop) investments in Hungary [44].
Having regarded the two countries, it can be said that although Poland and Hungary had different paths regarding renewable energy subsidy, the increases
101
in the two countries are not among the leaders. The reason for the slow movement may be that both countries have a core / massive non-renewable energy source in the mix. This is coal for Poland and nuclear for Hungary. In the latter case, the challenge may be that nuclear energy is promoted as a clean energy from the point of view of CO2 emissions, hence the new nuclear development plant plan does not facilitate a move towards a more renewable-oriented policy. This is the situation even though – as previously mentioned – the Hungarian energy policy is planning a significant increase in PV capacity.
3.4. The soft potentials
According to Polányi's substantive, sociological approach, economic behav- iour is embedded in society [62]. Beyond the sociology of economics, the (social) embeddedness of regional innovation systems also appears in the theoretical liter- ature of economics [63]. Hence, the efficiency of development policy depends not only on macroeconomic subsidies, but also on governance capacities, its social embeddedness, complexity, and its open or closed, hierarchical or horizontal na- ture [14]. This means both that social capacity affects integration and application of innovations and new (resource) investments, and the use of new technologies can influence local everyday people in their development directions.
The created resource potential model can help decision makers; however, suc- cessful application requires complex and conscious planning in the development process, including the human capacity. Rural territories in this sense have disad- vantages concerning some studies [64] that usually include unfavourable demo- graphic processes and a low activity rate. The low level of schooling is against the proliferation of major innovations and the spread of state-of-the-art technologies, and the base of vocational training and adult training is also in need of these re- gions’ development. These challenges decrease the capital absorption capacity.
Additionally it creates a gap for large businesses [64-65].
The basic condition for the use of renewable energies (as innovation) is the capacity of a given society. In addition to the above, social inclusion is also influ- enced by individuals and the formal, elected and informal leaders of local society [66].
3.4.1. Actors and institutions
As it can be seen above, national- or meta-governmental organisations – via subsidy policies – can influence actors in sustainability/renewable transition. Also, in the case of local knowledge regarding resources (c.f. chapter 3.1.2.), local stake- holders can also influence local everyday people in the choice of new (renewable) technology in order to transform the local society towards a more sustainable one.
However, there are other factors that influence the role of local / regional stake- holders' role in it.
Some empirical research shows that in Central and Eastern Europe, the ele- ments of sustainability do not appear with equal weight in the task-orientation
102
of local governments [67]. The sustainability of the natural environment and envi- ronmental protection activities are typically pushed into the background. Even if they do appear, they are not motivated by environmental awareness but by eco- nomic interests. In several countries, only those investments that have been sup- ported by ISPA / Cohesion Fund (CA) (investments in wastewater and waste man- agement) or renewable energy investments and legal obligations have been imple- mented so far [66].
It can be treated as axiomatic that the development of a settlement basically depends on the network of interests and personal competence of decision-makers, settlement leaders and local actors. “Behind personal influence systems in larger settlements there is always a complex organisational base” [68]. “The smaller the village, the more closely its prosperity depends on the local government, the mayor's abilities and personal ambitions” [69]. The lower the level we move to, the more marked the role of the individual, the unity. Therefore, from an environ- mental policy point of view, the active role of the local level is unavoidable [66].
Based on empirical international research (interviews with majors and case study researches), [66] it is argued that mayors were key players in municipal re- newable energy investments, and with their representative body they were able to accept the new direction. However, it can also be said that the decisions were driven by economic rationality, the environmental consideration did not appear or only barely appeared in the decisions. Later, the environmental aspect was used as a marketing tool. In addition to economic rationality, the educational function of the propagation of environmental protection as a spin-off effect can be utilised [66].
If information structures in energy are confusing and opaque, it also affects the decision-making process. Unfounded, ill-considered decisions based on mo- mentary interests can lead to a distorted energy structure and publicity. In its re- search analyses, the Energy Club states that the social public has suffered in many cases, transparency is limited, due to the fact that the reporting culture in energy is still underdeveloped in Hungary and the anomalies of the national legal environ- ment do not help efficiency. The analysis also reveals that law enforcement prac- tice also severely impairs the chances of environmental democracy [70].
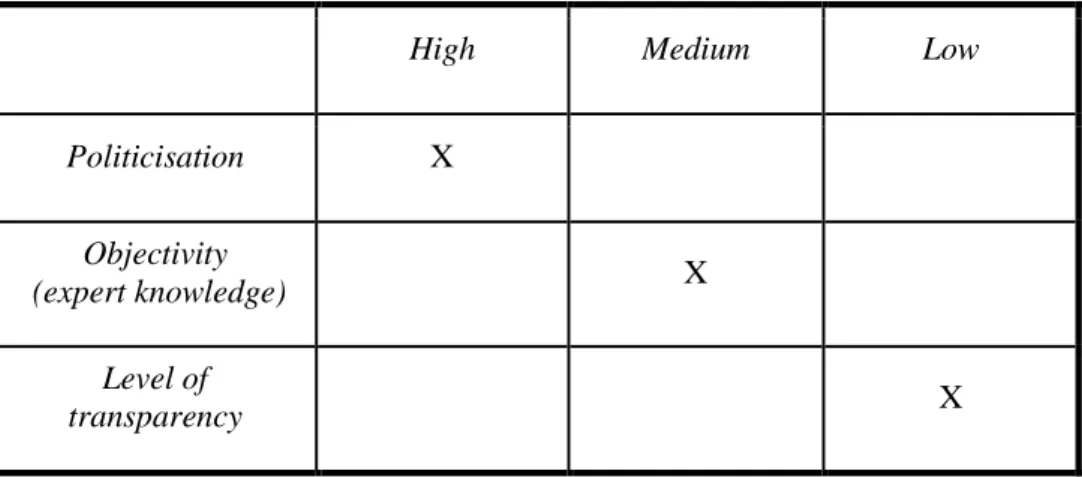
Varjú's international research showed the above-mentioned outcomes. Re- newable investments are largely contingent, linked to a call for proposals (the sup- port system is not as systematic as in Germany). According to them, the level of transparency related to renewable energy is low; however, the institutional sys- tem is quite politicised. Objectivity as well as the appearance of expertise is lim- ited, leaving something to be desired Table 2 [66].
103
Table 2. Typical distribution of answers to the question “How would you evaluate the attitude towards renewable energy in Hungary in terms of” based on interviews
High Medium Low
Politicisation X
Objectivity
(expert knowledge) X
Level of
transparency X
Source: [66]
The reason why the peculiarity of local stakeholder level matters is the partly mentioned fact that local governments have a relatively significant effect on inhabitants [68-69].
3.4.2. The role of Households
As can be seen above, both national and regional / local governmental level can influence the choice of everyday people. Hence, on one hand when considering the impacts of solar energy use, it becomes inevitable to also pay attention to the assessment of its social impacts, which means assessing how the communication affects a given social group and in what ways such communication affects renew- able/solar energy-related decisions made [71].
Pálvölgyi and colleagues – based on their analysis – summarised the influ- ences that a renewable energy development project can have [72]. This sustaina- bility refers to the potential positive and negative effects of it (Table 3).
Table 3. Potential effects of renewable uses on a local / regional society
Designation of social indicator Expected effect Human health Minimal effects (see detailed in
life-cycle analysis)
Quality of life Due to the sense of independence for the supply system, no or minimal effect Education, qualification,
knowledge
Positive effect, involvement of students into research tasks for the purpose
disseminating results Public awareness, approach,
presenting good examples
Positive: Give information and good examples / best practice
104 Mitigation of social disparities
Negative impact: Access to household level renewable systems (it mainly me- ans PV) is possible mainly for wealthy people and savings resulting from the use of such systems also contribute to
their cost-benefits, thus creating possibility for a further increase
in social disparities Enhancement of co-operation
between social actors, strengthening cohesion
Positive impact: Good example can be seen in cross-border cooperation
[73, 74]
Prevention of migration (job creation)
Exerting no impact: job-creation effect of PV or wind turbine systems usually does not appear in a given region (see detailed in the chapter about regional
impacts) Energy poverty alleviation
Positive impact: renewable energy not exploited as yet becomes incorporated
in the energy system
Source: Based on [71, 72] own contribution
On the other hand, it is unavoidable to have a look at on the local society, local cultural and moral circumstances that are the "social bed" of the local actions performed by households, as "the existence, lack, number, composition, applica- bility and value of social relationships exert a fundamental influence on the every- day life of an individual or that of a community” [75]. These factors have important implications for the spread of environmentally conscious patterns also including (i.e. pro-environmental attitude and behaviour) the advance of renewable/solar en- ergy investments [71].
Investigations on pro-environmental attitude and behaviour are increasingly in focus as the attitude is “a psychological tendency that is expressed by evaluating a particular entity with some degree of favour or disfavour” [76], and it is of vital importance in the forecasting of actual behaviour [77], including pro-environmen- tal or "pro-renewable attitude". A significant part of the environmental challenges can be traced back to human behaviour, so most investigations are targeted at the discovery of motivations. Several studies have explored the strong correlation be- tween a pro-environmental attitude and environmental action (or non-action) [78–80] focused, among other things, on the motivations of actions concerning environmental challenges, “counter-measures”. Beside attitude, the factors influ- encing behaviour include elements. Most of the work on environmental attitudes [81–83] concerns Ajzen's behaviour theory [84] as a basic work, which refers to subjective norm (which refers to the pressure by the environment potentially influencing one’s behaviour to implement or not implement some action),
105
or to “experienced behaviour control” (referring to the past experiences and visible obstacles like money, schooling, knowledge, and available time) as an additional factor in attitudes influencing behaviour [85]. Furthermore, the value system, iden- tity, moral convictions, the already experienced advantages and disadvantages, context and habits are also discussed as influencer elements [81, 82].
Less attention is in literature is paid to the examination of differences regard- ing the environmental attitude by territorial types. Freudenburg and McGinn [86]
found that previous research had quite a mixed opinion with respect to differences according to territorial character (urban vs. rural, industrial vs. agriculture-domi- nated areas) and environmental attitude. Some research did not find any difference between environmental conviction and the character of the respondents’ territory, and there were some that found a positive correlation between the urbanisation level and the environmental conviction [85].
Responding to the mentioned territorial question, Bodor et al.s' empirical re- search made an attempt to compare rural areas in Croatia and Hungary in the topic of renewable energy and energy efficiency. In their outcomes, they pointed out a contradiction when comparing attitudes to the actions conducted or behaviours.
On the one hand, the outcome of the survey revealed a higher environmental atti- tude among the Hungarian respondents, while Croatian respondents acted more environmentally consciously [85].
In this research, the examination of the regression model revealed that in- comes or the subjective financial situation had no significant impact on energy- efficient-oriented actions and in this respect, no difference can be seen between the older and younger generation [85]. However, another study that also relates pro- environmental attitude and behaviour found less concern for the negative effects of climate change are more likely to be characteristic of older age groups, and of those with lower levels of education [87]. It also draws to our attention to an important issue raised by scholars, namely that we cannot tackle pro-environmen- tal attitude and behaviour in one domain [88].
With regard to energy transition, there is the Eurobarometer 492 aimed at as- sessing awareness of climate and energy issues among EU citizens to better under- stand attitudes towards EU energy policy. To the question which detects what EU energy policy means to the respondents, at a national level, "shifting from fossil fuel to renewable energy sources to combat climate change" was the most-given answer in 17 out of the EU's 28 member states. In that sense, there is a huge gap in Poland and Hungary. While in Poland, with 31%, this was the most popular answer, in Hungary, with a 37%, respondents would see more competitive energy prices for consumers as an energy policy solution. The keen to encourage more investment in renewable energy is a little bit higher in Poland (91%), slightly above the EU average, while it is 89% (slightly below the EU average) in Hungary. (Alt- hough it is accompanied by a higher level of disagreement from the Hungarian side (10%) than that in Poland (6%).) Almost the same rate of respondents (Hungary
106
90%, Poland 89%) agreed with the statement that it should be the EU's responsi- bility to address energy poverty and ensure a fair energy transition so that no citi- zen or region is left behind. Alongside this attitude, both Hungarian (45%) and Polish (43%) respondents mentioned majorly that the EU should tackle "Ensuring that energy costs are as low as possible" as a priority instead of the option of "In- vesting in and developing clean energy technology"[89]. This suggests that in both countries, prices are more important than the energy transition.
In terms of energy-efficiency, what was interesting was that more Hungarian respondents recognised (81%) the "classic" EU energy label (that is usually used labelling the energy consumption of devices such as televisions or refractories) than respondents from Poland (76%). Also, 89% of the Hungarian respondents (first place in the EU) responded that it has an influence on the purchase of a device (this was 80%, but still above the EU average in Poland) [89].
4. Conclusion
According to endogenous growth theory, the successful development (i.e. lo- cal development) of a region depends on the optimum utilisation and appropriate use of local resources, including renewable energy and human resources [90-91].
The presented resource potential model can help decision makers; however, suc- cessful application requires complex and conscious planning in the development process, including the human capacity.
Local governments with financial difficulties are only able to carry out sig- nificant investments in a supportive regulatory and financing environment (even if a (renewable investment) has a slow payback), although it is evident that these developments can lead to considerable savings for the investor, for the local gov- ernment itself. In order to change this trend, the first step of successful adaptation is attitude shaping and conscious economic development activity which, in some places, is the reinforcement of the economic organisational function of local gov- ernments, activation of local businesses and inhabitants, their preparation and in- volvement in developments [64].
The positive effects of investment incentives affect not only the advance of renewable systems but also the spread of democracy, i.e. the so-called energy democracy [92], consequently to which “fundamental decisions are taken not by energy supply companies but by end-consumers who gain this predominance be- cause they themselves satisfy their energy needs by the application of low-capacity energy-generating equipment purchased by them” [92].
5. Acknowledgement
In this article the author partly used the data and synthesised the outcomes of the following research projects: IPA REGPHOSYS (HUHR/1101/2.1.3/0002), Interreg V/A (HUHR/1601/3.1.1/0033) RURES, and the National Research, De-
107
velopment and Innovation Fund of Hungary (Geopolitical Processes and Imagi- naries in Central Europe: States, Borders, Integration and Regional Development, NKFI K 134903) projects.
References
[1] Farkas J.Z., Hoyk E., Rakonczai J., Geographical analysis of climate vulnera- bility at a regional scale: the case of the Southern Great Plain in Hungary.
HunGeoBull, (2017) (66:) 129–144.
[2] Höfer T., Madlener R. A participatory stakeholder process for evaluating sus- tainable energy transition scenarios. Energy Policy, (2020) (139:) 111277.
[3] Jäger-Waldau A., PV status report 2018. LU: European Commission, Joint Research, Publications Office, https://data.eu- ropa.eu/doi/10.2760/826496
[4] In 2017 in Europe more electricity was generated from renewable sources than from coal | photon.info, https://www.photon.info/en/news/2017-europe-more- electricity-was-generated-renewable-sources-coal
[5] GSR2021 Full Report, https://www.ren21.net/wp-content/up- loads/2019/05/GSR2021_Full_Report.pdf
[6] Gnatowska R, Moryń-Kucharczyk E., Current status of wind energy policy in Poland. Renewable Energy, (2019) (135:) 232–237.
[7] Paska J., Surma T., Terlikowski P., et al., Electricity Generation from Renew- able Energy Sources in Poland as a Part of Commitment to the Polish and EU Energy Policy. Energies, (2020) (13:) 4261.
[8] László S., Mária B.L., Alfa D., et al., AZ ÚJ NEMZETI ENERGIASTRATÉ- GIA ÉRTÉKELÉSE, 4.
[9] Mezei C., Varjú V. A helyi erőforrásokon alapuló helyi fejlesztés lehetőségei az átalakuló hazai hulladékgazdálkodási közszolgáltatásban. Tér és Tár- sadalom, (2019) (33:) 41–61.
[10] Šljivac D., Solar Energy Resources in the Danube Region. In: Perspectives of Renewable Energy in the Danube Region. Pécs, Hungary: Institute for Re- gional Studies, CERS HAS, 257–266.
[11] Ghisellini P., Ulgiati S., Managing the transition to the circular economy, Handbook of the Circular Economy, https://www.elgaronline.com/view/ed- coll/9781788972710/9781788972710.00048.xml
[12] Loorbach D., Transition Management: new mode of governance for sustaina- ble development, https://repub.eur.nl/pub/10200
[13] Geels F.W., Technological transitions as evolutionary reconfiguration pro- cesses: a multi-level perspective and a case-study. Research Policy, (2002) (31:) 1257–1274.
108
[14] Varjú V., Mezei C., Vér C., Local resource-based development potential as reflected in waste management/circularity transition: Governance barriers in Hungary. ESR&P, (2020) (27:) 79–93.
[15] Williams S., Robinson J., Measuring sustainability: An evaluation framework for sustainability transition experiments. Environmental Science & Policy, 2020 (103:) 58–66.
[16] Truffer B., Coenen L., Environmental Innovation and Sustainability Transi- tions in Regional Studies. Regional Studies, (2012) (46:) 1–21.
[17] Dąbrowski M., Varjú V., Amenta L., Transferring Circular Economy Solu- tions across Differentiated Territories: Understanding and Overcoming the Barriers for Knowledge Transfer. Urban Planning, (2019) (4:) 52–62.
[18] Varjú V., The policy transfer of environmental policy integration: path de- pendency, route flexibility, or the Hungarian way? Policy Studies, (2021) (0:) 1–19.
[19] Benediktsson K., Conflicting imaginaries in the energy transition? Nature and renewable energy in Iceland. Moravian geographical Reports, (2021) 13.
[20] Millot A., Maïzi N., From open-loop energy revolutions to closed-loop transi- tion: What drives carbon neutrality? Technological Forecasting and Social Change, (2021) (172:) 121003.
[21] Steinbacher K., Exporting the Energiewende: German Renewable Energy Leadership and Policy Transfer. VS Verlag für Sozialwissenschaften. Epub ahead of print 2019. DOI: 10.1007/978-3-658-22496-7.
[22] Kuchler M., Bridge G., Down the black hole: Sustaining national socio-tech- nical imaginaries of coal in Poland. Energy Research & Social Science, (2018) (41:) 136–147.
[23] Verbruggen A., Fischedick M., Moomaw W., et al., Renewable energy costs, potentials, barriers: Conceptual issues. Energy Policy, (2010) (38:) 850–861.
[24] Šljivac D., A fotovoltaikus energiatermelés földrajzi, társadalmi, gazdasági és műszaki feltételei. In: Varjú V (ed) Napelemes energia és környezet. Pécs- Osijek: MTA KRTK Institute for Regional Studies - Sveučilište Josipa Jurja Strossmayera u Osijeku ETFOS, 11–13.
[25] Šljivac D., Module comparison based onstandard test conditions (STC) and PVGIS. In: Pelin D, Šljivac D, Topić D, et al. (eds) Regional Impacts of Dif- ferent Photovoltaic Systems. Pécs, Hungary: ID Research Kft. / Publikon Ki- adó, 98–98.
[26] Anda T., Kocsis T., (eds). Agrometeorológiai és klimatológiai alapismeretek.
Budapest: Mezőgazda Kiadó, (2010).
[27] Kwon S.D., Uncertainty analysis of wind energy potential assessment. Applied Energy, (2010) (87:) 856–865.
109
[28] Wu J., Wang J., Chi D., Wind energy potential assessment for the site of Inner Mongolia in China. Renewable and Sustainable Energy Reviews, (2013) (21:) 215–228.
[29] Jung S., Arda Vanli O., Kwon S.D., Wind energy potential assessment consid- ering the uncertainties due to limited data. Applied Energy, (2013) (102:) 1492–1503.
[30] Jung C., Schindler D., Introducing a new approach for wind energy potential assessment under climate change at the wind turbine scale. Energy Conversion and Management, (2020) (225:) 113425.
[31] Žnidarec M., Primorac M., Mezei C., et al., Renewable energy potential and decision support in the cross-border region of Croatia and Hungary -Potentials for a model application. In: Topić D, Varjú V, Horváthné Kovács B (eds) Re- newable energy sources and energy efficiency for rural areas. Pécs, Hungary:
MTA KRTK Institute for Regional Studies, 42–64.
[32] North D.C., Institutions, institutional change and economic performance.
Cambridge, UK: Cambridge University Press, 1990.
[33] Bodor Á., “Mivel van baj?” – A társadalmi kontextus megjelenése az inno- vációs szakemberek problémaérzékelésében. In: Innovációbarát kormányzás Magyarországon. Pécs, Hungary: MTA KRTK RKI, (2013) 127–142.
[34] Mezei C., Varjú V., Erőforrás-alapú, fenntartható önkormányzati fejlesztések lehetősége/modellezhetősége. In: Bányai O, Barta A (eds) A települési környezetvédelem elméleti és gyakorlati megközelítései. Budapest: Gondolat Kiadó, 119–137.
[35] Mezei C., Kovács SZ., Varjú V., A megújuló energiaforrásokra fókuszáló, helyierőforrás-alapú modellezés lokális lehetősége. In: Gál Z, Ricz A (eds) A környezet és a határok kutatója. Tiszteletkötet Nagy Imre 65. születésnapja alkalmából. Szabadka: Regionális Tudományi Társaság, (2019) 27–38.
[36] Varjú V., Környezetpolitika és/vagy területfejlesztés. Budapest-Pécs: Dialóg Campus - Dóm Kiadó, (2015).
[37] Jacobson M.Z., Jadhav V., World estimates of PV optimal tilt angles and ratios of sunlight incident upon tilted and tracked PV panels relative to horizontal panels. Solar Energy, (2018) (169:) 55–66.
[38] Sowiżdżał A., Hajto M., Hałaj E., Thermal waters of central Poland: a case study from Mogilno–Łódź Trough, Poland. Environ Earth Sci, (2020) (79:) 112.
[39] Mezei C., A helyierőforrás-térképezési kutatások összefoglalója. KÖFOP- 2.3.3-VEKOP-16-2016-00001 azonosító jelű ‘Helyi versenyképesség- fejlesztési kutatási program’ című kiemelt projekt kapcsán. Kézirat., https://bm-oki.hu/News/ViewFile?fileID=1130
[40] Pelin D., Kovács S.Z., Suvák A., et al., Cost-Benefit Analysis of Different Photovoltaic Systems in Croatia, Hungary, Serbia and Slovenia. In: Ortiz W,
110
Somogyvári M, Varjú V, et al. (eds) Perspectives of Renewable Energy in the Danube Region. Institute for Regional Studies CERS HAS, (2015) 278–290.
[41] Kovács S.Z., Suvák A., Model and Evaluation of the Panels. In: Pelin D., Šljivac D., Topić D., et al., (eds) Regional impacts of different photovoltaic systems. Pécs: IDResearch Kft, Publikon, (2014) 59–70.
[42] Knežević G., Fekete K., Technologies for utilization of renewable energy sources. In: Topić D, Varjú V, Horváthné Kovács B (eds) Renewable energy sources and energy efficiency for rural areas. Pécs: MTA KRTK Institute for Regional Studies, 65–85.
[43] Németh K., Birkner Z., Katona A., et al., Can Energy Be a “Local Product”
Again? Hungarian Case Study. Sustainability, (2020), (12:) 1118.
[44] Varjú V., Lessons from Central and Eastern Europe – Changes and Reasons of Renewable Energy Support Schemes. In: Varun NM, Praveen KR, Prafull S (eds) Geo-Information Technology in Earth Resources Monitoring and Man- agement. Nova Science Publishers, (2021), 309–326.
[45] Tóth T., A zöld erőművek területi elhelyezkedését befolyásoló telepítési tényezők, különös tekintettel a működési támogatásokra. PhD dissertation.
[46] Borenstein S., The Private and Public Economics of Renewable Electricity Generation. Journal of Economic Perspectives, (2012) (26:) 67–92.
[47] Jenner S., Groba F., Indvik J., Assessing the strength and effectiveness of re- newable electricity feed-in tariffs in European Union countries. Energy Policy, (2013) (52:) 385–401.
[48] Mezei C., ‘Támogatás politika.’ [Subsidy policy]. In: Varjú V (ed) Napelemes energia és környezet [Photovoltaic energy and Environment]. Pécs–Osijek:
MTA KRTK RKI and ETFOS, (2014) 38–39.
[49] Nicolini M., Tavoni M., Are renewable energy subsidies effective? Evidence from Europe. Renewable and Sustainable Energy Reviews, (2017), (74:) 412–
423.
[50] Průša J., Klimešová A., Janda K., Consumer loss in Czech photovoltaic power plants in 2010–2011. Energy Policy, (2013) (63:) 747–755.
[51] Feed-in Tariffs Go Global: Policy in Practice. Renewable Energy World, https://www.renewableenergyworld.com/baseload/feed-in-tariffs-go-global- policy-in-practice
[52] Couture T., Cory K., State Clean Energy Policies Analysis (SCEPA) Project:
An Analysis of Renewable Energy Feed-in Tariffs in the United States (Re- vised). NREL/TP-6A2-45551, National Renewable Energy Lab. (NREL), Golden, CO (United States). Epub ahead of print 1 June 2009. DOI:
10.2172/953830.
[53] Timilsina G.R., Kurdgelashvili L, Narbel PA. Solar energy: Markets, econom- ics and policies. Renewable and Sustainable Energy Reviews, (2012) (16:) 449–465.
111
[54] Sarasa-Maestro C.J., Dufo-López R., Bernal-Agustín J.L., Photovoltaic remu- neration policies in the European Union. Energy Policy, (2013) (55:) 317–328.
[55] Sarasa-Maestro C.J., Dufo-López R., Bernal-Agustín J.L., Photovoltaic remu- neration policies in the European Union. Energy Policy, (2013) (55:) 317–328.
[56] Cheung G, Davies PJ, Trück S. Financing alternative energy projects: An ex- amination of challenges and opportunities for local government. Energy Policy (2016) (97:) 354–364.
[57] Câmpeanu V., Pencea S., Renewable Energy Sources in Romania: From a “Paradise” of Investors to a Possible Abandon or to Another Boom? The Impact of a New Paradigm in Romanian Renewable Sources Policy. Procedia Economics and Finance, (2014) (8:) 129–137.
[58] Dusonchet L., Telaretti E., Economic analysis of different supporting policies for the production of electrical energy by solar photovoltaics in western Euro- pean Union countries. Energy Policy, (2010) (38:) 3297–3308.
[59] Poland and Czech Republic top of the EU league in wind power production growth, but still low on output. ScienceBusiness, https://sciencebusi- ness.net/news-byte/poland-and-czech-republic-top-eu-league-wind-power- production-growth-still-low-output
[60] Soha T., Munkácsy B., Szélturbinák Magyarországon - a technológia a hazai szabályozás területi vonatkozásainak tükrében. In: Munkácsy B (ed) SZÉLENERGIA A 21. SZÁZADBAN - ÉS MAGYARORSZÁGON. Buda- pest: Energiaklub, 40–45.
[61] Lados M., Somossy É.S., Tóth T., Financial subsidies and the location decision of solar power plants in Hungary: An empirical investigation. Reg Stat, (2020) (10:) 166–185.
[62] Polányi K., Az archaikus társadalom és a gazdasági szemlélet. Budapest: Gon- dolat Kiadó, (1976).
[63] Vas Z., Bajmóczy Z., Az innovációs rendszerek 25 éve. szakirodalmi áttekin- tés evolúciós közgazdaságtani megközelítésben. Közgazdasági Szemle, (2012) (49:) 1233–1256.
[64] Póla P., Kovács S.Z., Horeczki R., Socio-economic background criteria – strengthening the synergies between the use of renewable energy and rural de- velopment. In: Topić D, Varjú V, Horváthné Kovács B (eds) Renewable en- ergy sources and energy efficiency for rural areas. Pécs: MTA KRTK Institute for Regional Studies, (2018) 36–41.
[65] Póla P., Megújuló energiaforrások vidéki térségekben - lehetőségek, korlátok, helyi stratégiák. Falu Város Régió, (2018) 17–21.
[66] Varjú V., A napelemes rendszerek, mint a területfejlesztés motorjai - egy tár- sadalomtudományi értelmezés. Szociális Szemle, (2013) 122–128.
[67] Mezei C., The Role of Hungarian Local Governments in Local Economic De- velopment, (2008).
![Figure 1. Framework of sustainability transition [11]](https://thumb-eu.123doks.com/thumbv2/9dokorg/834638.43061/3.701.162.536.234.593/figure-framework-of-sustainability-transition.webp)

![wasrecentlydocumentedfortheEUtoreducegreenhouseemissionsbyatleastby55% goalwastointegratepoliticalandeconomiccooperationfully[ ].Energysecurityisaglobalconcernnowadays.Allnationsaroundtheworldhaveframedenergypoliciesincontrastwithsustainablegrowth.Almosta](data:image/gif;base64,R0lGODlhAQABAIAAAP///wAAACH5BAEAAAAALAAAAAABAAEAAAICRAEAOw==)