Abstract—Professional energy organizations perform analyses mainly on the global and national levels about the expected development of the share of renewables in electric power generation, heating and cooling, as well as the transport sectors. There are just a few publications, research institutions, non-profit organizations and national initiatives with a focus on studies in the individual towns, settlements. Issues concerning the self-supply of energy on the settlement level have not become too wide-spread. The goal of our energy geographic studies is to determine the share of local renewable energy sources in the settlement-based electricity supply across Hungary.
The Hungarian energy supply system defines four categories based on the installed capacities of electric power generating units. From these categories, the theoretical annual electricity production of small-scale household power plants (SSHPP) featuring installed capacities under 50 kW and small power plants with under 0.5 MW capacities have been taken into consideration. In the above-mentioned power plant categories, the Hungarian Electricity Act has allowed the establishment of power plants primarily for the utilization of renewable energy sources since 2008. Though with certain restrictions, these small power plants utilizing renewable energies have the closest links to individual settlements, and can be regarded as the achievements of the host settlements in the shift of energy use.
Based on 2017 data, we have ranked settlements to reflect the level of self-sufficiency in electricity production from renewable energy sources. The results show that the supply of all the energy demanded by settlements from local renewables is within reach now in small settlements, e.g. in the form of the small power plant categories discussed in the study, and is not at all impossible even in small towns and cities. In Hungary, 30 settlements produce more renewable electricity than their own annual electricity consumption. If these overproductive settlements export their excess electricity towards neighboring settlements, then full electricity supply can be realized on further 29 settlements from renewable sources by local small power plants.
These results allow the government to plan the process of energy transition (regulatory background, subsidization system, environmental education), and draw up development forecasts.
Keywords—decentralized energy production, energy export, energy geography, Hungary, renewable energy, self-sufficient settlements
B. Kulcsár Author is with the Department of Basic Technical Studies, Faculty of Engineering, University of Debrecen, H- 4028 Debrecen, Ótemető str. 2-4. Hungary (e-mail: kulcsarb@eng.unideb.hu)
I. INTRODUCTION
N the course of the extremely fast-paced spread of renewable energy sources worldwide, more and more municipalities aim to satisfy their own energy demands from renewable sources. Most of the energy is utilized in the settlements, and therefore it is evident that the most economical and most gentle procedure is to produce energy locally and from renewable energy sources. Nevertheless, just few studies and organizations deal with the implementation possibilities of electricity self-sufficiency or the measurement of results.
The goal of the studies is to find out in what proportions small-scale household power plants (SHPP) that belong to the category of small-scale power plants in the most decentralized locations and among local power plants, as well as small power plants with nominal capacities under 0.5 MW that are not subject to permits contribute to the satisfaction of the electricity demands of settlements when all the settlements in Hungary are concerned. It is also to be seen what results have been achieved in the process of energy transition during the ten years since the regulatory conditions for the construction of power plants were put in place, taking into consideration changes in the economic environment and the subsidization background.
• Are there settlements in Hungary that are able to satisfy 100% of their electricity demands from local renewable sources?
• What is the size of the local regions that overproducing settlements are able to supply?
This study sheds light on the theoretical potentials of the realization of decentralized, local, renewable-based energy supply systems in Hungary. This method will make energy policy more predictable for the future, gives way to the adjustment of the subsidization system and the modification of the energy mix, as well as the acceleration of the process of energy transition. Our studies have followed energy geography and settlement geography aspects.
A. Background
The issue of covering 100% of energy demands from B. Kulcsár
Establishing forecasts pointing towards the Hungarian energy change based on the results of local municipal renewable energy production and
energy export
I
renewable sources emerged on the national level as early as 1975 in Denmark [1], followed by further theories [2] and software models worldwide [3]. Beyond the scientific theories, the first specific steps were taken by Iceland in 1988, when a governmental decision was made about energy transition. The start of establishing self-sufficient systems for settlements is associated with the effective date of 1997 of the German Renewable Energy Act, which allowed for predictable returns [4]. The Stern Review in 2006 brought about another breakthrough in the estimation of the renewable sources, it authentically supported the inevitable and reasonable necessity of energy transition beyond the environmental and technological arguments also in the field of the economy [5]. In Hungary, the first computer model was developed at the Department of Environmental and Landscape Geography at Eötvös Loránd University (ELTE) [6]. The highest level of governmental commitment to energy transition so far was reached in the “Marrakech Vision”, where several countries – it is to be noted that those countries that are the most exposed to the negative effects of climate change – agreed to base their energy systems on renewables [7].
B. The first self-sufficient settlements
The earliest example on the settlement level was the Bavarian settlement of Wildpoldsried, where – following the adoption of the German Renewable Energy Act [4] – the settlement wished to ground their total electric power, heat energy and transport energy supply on renewable sources, with reliance on locally available sources [8]. Following the first successful, primarily German (Aller-Leine-Tal, Effelter, Alzey-Land region, Bruchsmühlbach-Miesau, Dardesheim, Groβbardorf), Danish (Samsø island, Frederikshavn) and Austrian (Güssing) examples in relation to settlements, among others Li Wen Li et al. 2016 examined the successful social, sociological aspects of the execution of projects relating to community-owned renewable energy through case studies in Germany [9]. The first good practices were followed by other settlements from villages to cities [10].
The technical literature concerning the electricity self- sufficiency of settlements seeks purely renewable and hybrid solutions primarily for ensuring 100% electric power supply of the off-grid, rural regions and islands [11], [12]. Duić- Carvalho, 2003 and Uyar-Beşikci, 2017 suggested the production of hydrogen for the storage of the local renewable electric power in order to realize self-sufficiency for these geographic regions and system balancing [13], [14]. Neves et al. 2016 [15], and Rahman et al. 2015 studied solutions for the storage of electric power from renewable sources through case studies of the off-grid rural regions of India and Canada, respectively [16].
C. Methods for the realization of self-sufficiency
The associated technical literature, official energy organizations, non-governmental organizations supporting renewable energy and community initiatives do not define criteria for the achievement of the 100% renewable share for the energy supply of regions with various geographical scales.
The goal can be realized by utilizing local renewable energy sources, purchasing import energy generated from renewable sources, energy exchange or energy compensation, as well as by using large power plants established from investment fund from beyond the territories of the settlement concerned. In our previous study, due to the lack of methodology, we studied the energy routes of members and methods for the implementation of the objectives, developed methodological categories based on case studies. These categories were introduced through the most typical case studies by considering the need to take examples from the broadest possible settlement sizes [17].
Based on these studies, the following categories could be identified:
• Securing the volume of renewable electricity that satisfies local demands from regional sources.
• Purchasing and local production of electric power generated from renewable sources.
• Utilization of locally available and locally produced renewable energy sources to provide for 100% of the existing energy demands. Community initiative and property (sharing economy).
• Energy compensation.
• Energy exchange with the neighbouring settlements.
• Energy export.
Strictly speaking about self-sufficiency, only those of the above-described methods can be regarded to be relevant where the electricity supply of the settlements is provided from renewable energies generated in their own areas. When determining the level of the self-sufficiency of the Hungarian settlement stock, primarily local sources were brought into the focus by considering the renewable energy resources that could be extracted within the boundaries of the individual settlements and thereby the local energy generation capabilities, while on the other hand this method also conformed to the criteria of decentralized energy production. In order to avoid the bias generated by the sizes of settlements, large power plants operating with renewable sources were not taken into consideration. At the current stage of the research, from among electricity production, heating–cooling and the transportation energy sectors, we focused on electric power generation. Our studies were conducted in relation to the year of 2017, as that has been the most recent year with respect to which the entire scope of relevant and adjusted data are available from all sources.
II. DATA AND METHODS
Magyar Villamosenergia-ipari Átviteli Rendszerirányító Zrt.
(Mavir Hungarian Transmission System Operator Company Ltd, MAVIR) distinguishes the following power plant categories with respect to the capacities of power plants in the Hungarian electricity system. Basically, power plants under 50 MW are categorized as small power plants, whereas power plants at or above 50 MW are large power plants. Small power plants with capacities between 50 and 50 MW, between 0.5 MW and 50 kW and below 50 kW are differentiated from each other within the below 50 MW category [18], [19]. The study considered the output of small-scale household power plants
(SSHPP) of 50 kVA (50 kW) or smaller capacity that are not subject to permitting, as well as non-SSHPP small power plants (small power plants) of installed electric output under 0.5 MW, similarly not being subject to permitting; their establishment has been allowed by the Hungarian Electricity Act since 1 January 2008.
SSHPPs are fundamentally installed by the institutional, corporate and household segment for the total or partial satisfaction of their electric power demands. Their electric power turnover is measured by electronic input–output consumption meters. The generated energy is utilized locally, while any excess is transferred to the network. In case production is suspended, the network supplies the required
electric power. Suppliers perform settlements by calculating the balance of the volumes of electricity drawn from and fed into the network as measured by the consumption meters and in view of the currently effective unit prices. The number of SSHPPs has showed dynamic increase in each year since 2008, there were 29,685 units at the end of 2017 with an aggregated nominal capacity reaching 241.4 MW. 99.41% of the power plants are solar power plants, while the remaining 0.59%
operates with such sources of energy as thermal methane gas, diesel, natural gas, biomass, biogas, water and wind. The volume of energy supplied to the network by SSHPPs was 105,086 MWh in 2017 [20] (Table I.).
TABLEI
SUMMARY DATA OF SMALL-SCALE HOUSEHOLD POWER PLANTS [20]
Nominal capacities of household-scale small power plants per energy sources (kW)
YEAR other diesel natural gas biomass thermal methane biogas hydro power wind power solar energy total
2017 36 11 291 20 206 115 112 619 239,960 241,370
Quantity of household-scale small power plants per energy sources (units)
YEAR other diesel natural gas biomass thermal methane biogas hydro power wind power solar energy total
2017 1 1 20 1 26 28 14 84 29,510 29,685
Volume of energy supplied to the network by household-scale small power plants per energy sources (MWh)
YEAR other diesel natural gas biomass thermal methane biogas hydro power wind power solar energy total
2017 125 0 258 0 553 32 387 105 103,626 105,086
The number of small power plants below 0.5 MW reached up to 238 until 31 December 2017, and their aggregate nominal capacity was 78.2 MW. The range of the utilized energy sources was wide, including both renewable and fossil energy sources.
Most of the electric power in this category is generated from renewables, including solar, wind and hydropower, biogas, landfill gas and wastewater gas. Fossil energy sources, to a smaller extent, also appear with small power plants, primarily at power plants producing energy from natural gas, thermal methane gas, other gases and petrol [20]. 71% of the power
plants are solar power plants, followed by biogas and wind power plants with 14% and 10% shares, respectively. Solar power plants are also on the top of the rank when capacity is concerned, with 78% of the nominal capacity of the category belonging to them, followed by biogas power plants with a 14%
share from capacities. Hydropower (4%) and natural gas (3%) similarly represent significant proportions in the energy mix (Figure 1).
Fig. 1 Distribution of small power plants with capacities below 0.5 MW among the various energy sources, with respect to the number units and their nominal capacities, based on data from [20]
Unlike SSHPP power plants, these facilities are mostly constructed by business operators. The establishment of these power plants is mostly driven by the goal of realizing business profits, with connection to the Mandatory Take-Off System (KÁT) effectively operated until 31 December 2016 [18], [21], [22], and thereafter, from 1 January 2017 to the Renewable Energy Support Scheme (METÁR) [18], [23], [24], [25], [26], [27].
The settlement-level SSHPP unit and capacity data were made available by E.ON Energiaszolgáltató Kft., ELMÜ- ÉMÁSZ Energiaszolgáltató Zrt. and Dél-magyarországi Áramszolgáltató Zrt. (DÉMÁSZ) as universal suppliers operating in the territory of Hungary, whereas unit and capacity data for small power plants under the capacity of 0.5 MW were disclosed by the Hungarian Energy and Public Utility Regulatory Authority (MEKH). Accurate settlement-level electricity production data are handled as business secret by the universal suppliers, MEKH and MAVIR, and therefore they were not made available for the purposes of the study;
additionally production data measured by universal suppliers fail to reflect the actual electric power production figures of the SSHPP power plant units. The underlying reason is that the energy consumed by any equipment installed before the meter is not fed into the network, and therefore, it is not measured, either. Universal suppliers are in possession of data only in relation to the volume of electric power that is transferred to the network by the generating power plant. As a result, the volume of electric power generated in the settlements from renewable sources cannot be determined based on the available data.
Therefore, local renewable electricity production data for the
settlements were generated with the use of calculations based on the following principles.
In order to determine the self-sufficiency level of the settlements where power plants belonging to the two categories are installed, the annual volume of electric power that can be theoretically produced by the power plants (for solar energy), and can be determined based on the average annual utilization rates (for other renewable energy sources) was compared to the annual electric power consumption of the settlement for the year of 2017 [28]. Calculations were made to see as to what proportions of the electric power demands of the settlements could be satisfied by the studied power plant categories, and more specifically by those power plants within these groups that utilize local renewable energy sources.
A theoretical electric power volume that could be produced annually was determined from the settlement-level total capacity data at the end of 2017 for solar panel systems. We used the Photovoltaic Geographical Information System (PVGIS) operated by the Joint Research Centre of the European Commission (Ispra, Italy). Using the software, we performed the calculations for every Hungarian settlement where SSHPP and/or photovoltaic small power plant capacities under 0.5 MW output was operated [29].
For other renewable energy sources, the annual renewable electric power volume that could be theoretically generated in the settlements in 2017 was established with the use of the average utilization rate data for the year of 2017, which were made available by MEKH (Table 2). The annual utilization rate data are also accessible for solar energy, but in the case of this energy source PVGIS
allowed for more accurate calculations.
TABLEII
AVERAGE UTILIZATION RATES OF SSHPPS AND SMALL POWER PLANTS WITH NOMINAL CAPACITIES UNDER 0.5MW AND UTILIZING RENEWABLE ENERGY SOURCE IN 2017[30]
ENERGY SOURCE wind power hydropower biomass biogas landfill gas sewage gas solar energy
AVERAGE UTILIZATION (%) 25.9 40.9 60.1 46.5 57.1 50.9 15.2
From among the other energy carriers, small power plants fueled with petrol, diesel, natural gas, gas and thermal methane gas were not considered, as they are fossil energy sources, and therefore are not relevant to our studies. The studies were performed for the territories of 3155 local municipalities in Hungary [31].
III. RESULTS
With the use of the above data and methods, all the settlements in Hungary have been subjected to the study of the settlement-level electric power self-sufficiency from local renewable resources. With the aggregation of data for the electricity generation capacities of small-scale household power plants (SSHPP) and small-scale power plants with installed capacities under 0.5 MW that are not subject to authorization or do not belong to the SSHPP category, combined capacities were examined.
A. Electricity generation capacities of small-scale household power plants (SSHPP) and small-scale power plants with installed capacities under 0.5 MW that are not subject to authorization or do not belong to the SSHPP category
In the light of these combined capacity studies, in 2017 there were 30 settlements in Hungary where the renewable-powered SSHPPs and/or small-scale power plants with installed capacities under 0.5 MW were able to cover more than 100%
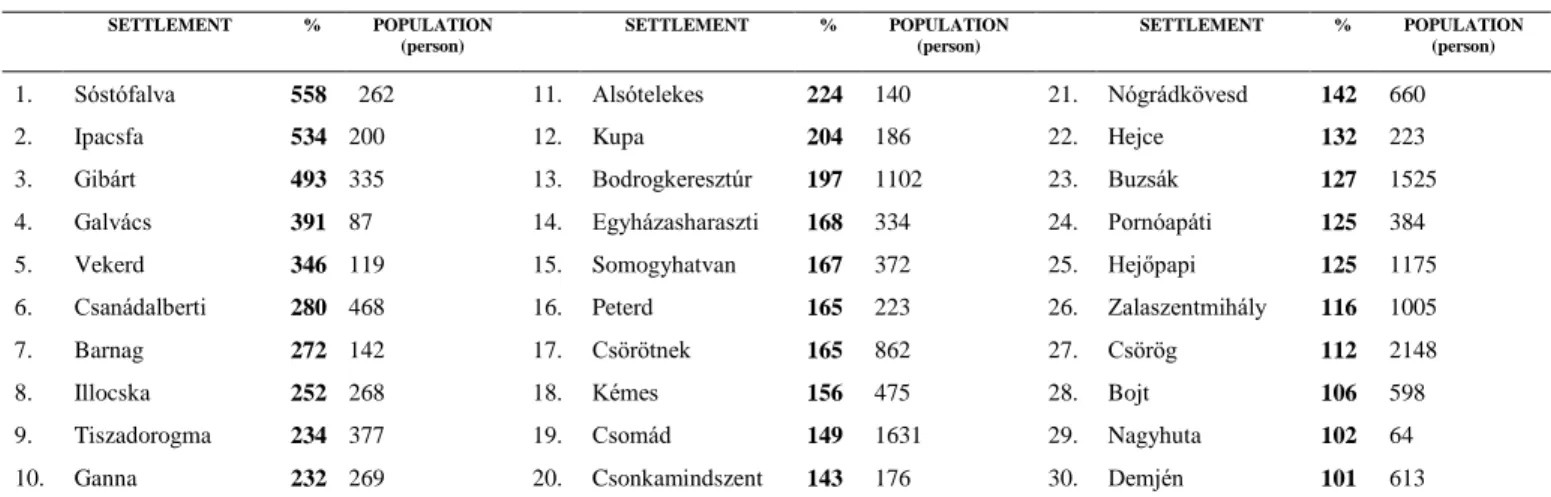
of the annual electricity demands of the settlements concerned (Table 3). 80% of these 30 settlements proved to be villages with populations under 1000 people, while 20% of them had more than 1000 inhabitants with the most populous of them being Csörög having 2148 inhabitants. In comparison with the annual energy demands, it is Sóstófalva that generates the
largest volume of electric power, i.e. more than a 5-fold volume, notably 558% of the electric power consumption of the village.
Ipacsfa and Gibárt closely follow with 534% and 493%, respectively. In Sóstófalva, all the renewable-energy power plants are operated with solar power, but SSHPPs and small- scale power plants with installed capacities under 0.5 MW can also be distinguished in 70% to 30% current proportions. This principle was followed for all the settlements presented in the map. The entire volume of renewable electricity in Ipacsfa come from small solar power plants, while Gibárt has a local hydropower plant that also belongs to the category of small- scale power plants with installed capacities under 0.5 MW. The majority of the power plants in the 30 settlements generate power from solar power in the form of small-scale power plants, with the exception of Demjén, where SSHPPs are responsible for most of the generated electricity. A more complex energy mix can be seen in Bodrogkeresztúr, where 9% of the renewable-generated electric power comes from solar energy, 35% from landfill gas and 56% from biogas. In the settlement of Csörötnek, hydropower covers 98% of production with 2%
originating from solar power. In Csomád, small-scale power plants generate 34% of renewable energy from biogas, 58%
comes from SSHPP biogas plants and 8% from SSHPP solar power. The situation is similar in Nógrádkövesd, where the corresponding distribution is 33%, 66% and 1% from small- scale power plant biogas, SSHPP biogas and solar power, respectively. In Pornóapáti, 98% of the renewable-generated electricity originates from hydropower and 2% from solar power, Zalaszentmihály has 98% biogas and 2% solar power share, and finally Csörög produces 97% from landfill gas and 3% from solar power again.
TABLEIII
PROPORTIONS OF ELECTRICITY FROM LOCAL RENEWABLE ENERGY RESOURCES IN THE ENERGY CONSUMPTION OF CONSEQUENTLY SELF-SUFFICIENT SETTLEMENTS WITH RESPECT TO THE COMBINED ELECTRICITY PRODUCTION CAPACITIES OF THE CATEGORIES OF SMALL-SCALE HOUSEHOLD POWER PLANTS
(SSHPP) AND SMALL-SCALE POWER PLANTS WITH INSTALLED CAPACITIES UNDER 0.5MW THAT ARE NOT SUBJECT TO AUTHORIZATION OR DO NOT BELONG TO THE
SSHPP CATEGORY (2017).
Individual settlements based on the combined capacities of small-scale household power plants (SSHPP) and
small-scale power plants with installed capacities under 0.5 MW that are not subject to authorization or do not belong to the SSHPP category
SETTLEMENT % POPULATION (person)
SETTLEMENT % POPULATION (person)
SETTLEMENT % POPULATION (person)
1. Sóstófalva 558 262 11. Alsótelekes 224 140 21. Nógrádkövesd 142 660
2. Ipacsfa 534 200 12. Kupa 204 186 22. Hejce 132 223
3. Gibárt 493 335 13. Bodrogkeresztúr 197 1102 23. Buzsák 127 1525
4. Galvács 391 87 14. Egyházasharaszti 168 334 24. Pornóapáti 125 384
5. Vekerd 346 119 15. Somogyhatvan 167 372 25. Hejőpapi 125 1175
6. Csanádalberti 280 468 16. Peterd 165 223 26. Zalaszentmihály 116 1005
7. Barnag 272 142 17. Csörötnek 165 862 27. Csörög 112 2148
8. Illocska 252 268 18. Kémes 156 475 28. Bojt 106 598
9. Tiszadorogma 234 377 19. Csomád 149 1631 29. Nagyhuta 102 64
10. Ganna 232 269 20. Csonkamindszent 143 176 30. Demjén 101 613
IV. SUBMISSION STUDY OF ENERGY EXPORT POTENTIALS IN RELATION TO SELF-SUFFICIENT SETTLEMENTS
In the light of the obtained results, as the next step, our studies focused on the size of the neighbouring settlement districts that the overproducing settlements were able to supply with the electric power that they did not consume themselves.
Similarly to the method applied earlier, the combined electricity production capacities of SSHPPs and small-scale power plants with installed capacities under 0.5 MW that are not subject to authorization or do not belong to the SSHPP category were taken into consideration. When selecting the direction of the transfer of excess electricity generated by the overproducing settlement, the fundamental goal was to reach the largest possible number of settlements to be provided with renewable- generated electric power. In some of the supplied settlements, green power fully comes from the overproducing settlement, whereas for others it is complementary to local, renewable- produced electricity.
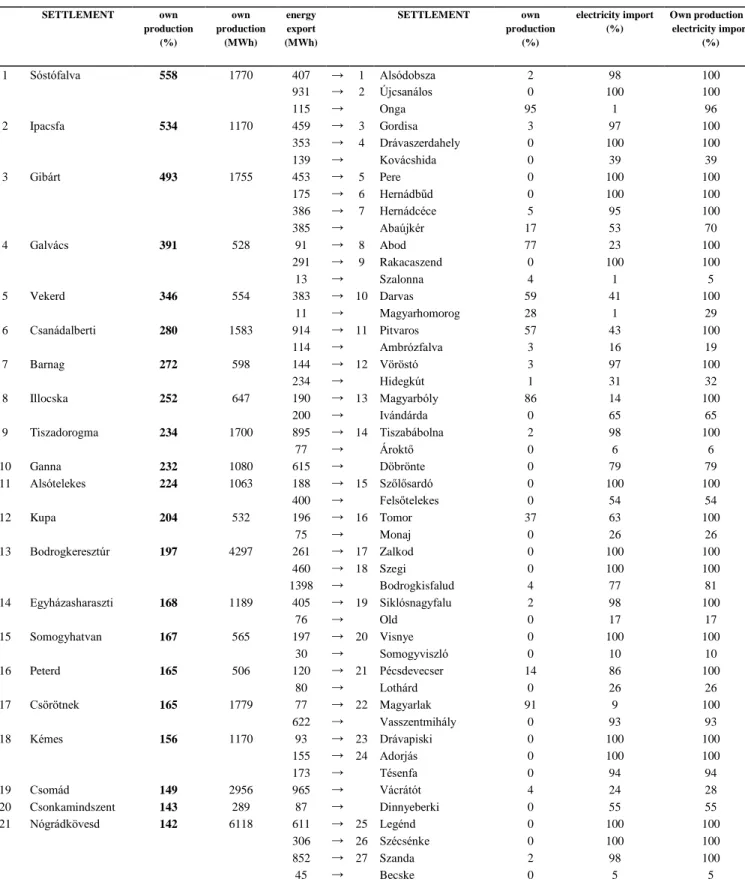
A. Overproducing settlements and their energy export based on the combined capacities of SSHPPs and small-scale power plants with installed capacities under 0.5 MW
With the aggregation of the electricity production of SSHPPs and small-scale power plants with installed capacities under 0.5 MW that are not subject to authorization or do not belong to the
SSHPP category, 30 Hungarian settlements are able to cover their own annual electric power demands (Figure 2). If these settlements transfer their excess green energy to neighbouring settlements, the annual electricity demands of 29 other settlements can be fully covered, and additionally complementary energy volumes can be handed over to 30 settlements (Table 4). This ratio ranges from 1% to 96%. Gibárt is able to supply the largest number of neighbouring settlements (Pere, Hernádbűd, Hernádcéce) and Nógrádkövesd (Legénd, Szécsénke, Szanda), and consequently these other settlements will become able to cover the total volume of their annual demands with electricity that originates from decentralized small power plants. The largest volume of renewable electric power is produced by Nógrádkövesd (6118 MWh p.a.) from biogas and solar power, followed by Bodrogkeresztúr (4227 MWh p.a.), where green energy is derived from biogas, landfill gas and solar energy. It means that if the combined renewable- produced electricity production capacities of these two power plant types are concerned, local production and the export of excess energy can potentially turn altogether 59 settlements solely green power consumers in Hungary. It can be achieved with the proper distribution of electricity generated in decentralized smaller power plants locally, with the utilization of renewable sources.
Fig. 2 Self-sufficient settlements in Hungary: the combined share of electricity produced in the categories of small-scale household power plants (SSHPP) and small-scale power plants with installed capacities under 0.5 MW – not subject to authorization or belonging to the SSHPP
category – from local renewable energy sources in the electricity consumption of the settlements (2017).
TABLEIV
SETTLEMENTS OVERPRODUCING ELECTRICITY IN THEIR OWN SSHPPS AND SMALL-SCALE POWER PLANTS WITH INSTALLED CAPACITIES UNDER 0.5MW UTILIZING RENEWABLE ENERGY RESOURCES, AS WELL AS SETTLEMENTS BECOMING FULLY OR PARTLY SELF-SUFFICIENT DUE TO ENERGY TRANSFERS FROM THE FORMER
SETTLEMENTS (2017).
Individual settlements based on the combined capacities of the two power plant categories
(SSHPP and small-scale power plants)
own production of settlements receiving energy transfers (SSHPP and small-scale power plants) completed with energy transfers from
overproducing settlements
SETTLEMENT
own production
(%)
own production
(MWh)
energy export (MWh)
SETTLEMENT
own production
(%)
electricity import (%)
Own production + electricity import
(%)
1 Sóstófalva 558 1770 407 → 1 Alsódobsza 2 98 100
931 → 2 Újcsanálos 0 100 100
115 → Onga 95 1 96
2 Ipacsfa 534 1170 459 → 3 Gordisa 3 97 100
353 → 4 Drávaszerdahely 0 100 100
139 → Kovácshida 0 39 39
3 Gibárt 493 1755 453 → 5 Pere 0 100 100
175 → 6 Hernádbűd 0 100 100
386 → 7 Hernádcéce 5 95 100
385 → Abaújkér 17 53 70
4 Galvács 391 528 91 → 8 Abod 77 23 100
291 → 9 Rakacaszend 0 100 100
13 → Szalonna 4 1 5
5 Vekerd 346 554 383 → 10 Darvas 59 41 100
11 → Magyarhomorog 28 1 29
6 Csanádalberti 280 1583 914 → 11 Pitvaros 57 43 100
114 → Ambrózfalva 3 16 19
7 Barnag 272 598 144 → 12 Vöröstó 3 97 100
234 → Hidegkút 1 31 32
8 Illocska 252 647 190 → 13 Magyarbóly 86 14 100
200 → Ivándárda 0 65 65
9 Tiszadorogma 234 1700 895 → 14 Tiszabábolna 2 98 100
77 → Ároktő 0 6 6
10 Ganna 232 1080 615 → Döbrönte 0 79 79
11 Alsótelekes 224 1063 188 → 15 Szőlősardó 0 100 100
400 → Felsőtelekes 0 54 54
12 Kupa 204 532 196 → 16 Tomor 37 63 100
75 → Monaj 0 26 26
13 Bodrogkeresztúr 197 4297 261 → 17 Zalkod 0 100 100
460 → 18 Szegi 0 100 100
1398 → Bodrogkisfalud 4 77 81
14 Egyházasharaszti 168 1189 405 → 19 Siklósnagyfalu 2 98 100
76 → Old 0 17 17
15 Somogyhatvan 167 565 197 → 20 Visnye 0 100 100
30 → Somogyviszló 0 10 10
16 Peterd 165 506 120 → 21 Pécsdevecser 14 86 100
80 → Lothárd 0 26 26
17 Csörötnek 165 1779 77 → 22 Magyarlak 91 9 100
622 → Vasszentmihály 0 93 93
18 Kémes 156 1170 93 → 23 Drávapiski 0 100 100
155 → 24 Adorjás 0 100 100
173 → Tésenfa 0 94 94
19 Csomád 149 2956 965 → Vácrátót 4 24 28
20 Csonkamindszent 143 289 87 → Dinnyeberki 0 55 55
21 Nógrádkövesd 142 6118 611 → 25 Legénd 0 100 100
306 → 26 Szécsénke 0 100 100
852 → 27 Szanda 2 98 100
45 → Becske 0 5 5
22 Hejce 132 628 153 → Fony 10 31 41
23 Buzsák 127 2863 472 → 28 Táska 0 100 100
134 → Nikla 1 14 15
24 Pornóapáti 125 975 199 → Horvátlövő 1 67 68
25 Hejőpapi 125 2481 491 → Szakáld 0 70 70
26 Zalaszentmihály 116 2070 179 → 29 Zalaigrice 0 100 100
106 → Nemesszentandrás 0 33 33
27 Csörög 112 2575 280 → Vácduka 4 15 19
28 Bojt 106 605 34 → Bedő 0 9 9
29 Nagyhuta 102 240 4 → Vágáshuta 63 3 66
30 Demjén 101 1670 10 → Tófalu 0 1 1
V. SUMMARY
In summary, it can be claimed that when the electricity power generation capacities of SSHPPs and small-scale power plants with installed capacities under 0.5 MW are combined, Hungary has 30 settlements that are able to generate more than 100% of the electric power demands of the individual settlements from the two power plant categories using renewable energy resources. Additionally, 24 settlements cover 100–50% of consumption in a similar manner, whereas in 164 and 1301 settlements the corresponding ratios are 50–10% and 10–1%, respectively. In 699 Hungarian settlements, this ratio is under 1%, while in 937 settlements neither SSHPPs, nor power plants belonging to the small-scale power plant category with installed capacities under 0.5 MW have been completed for the
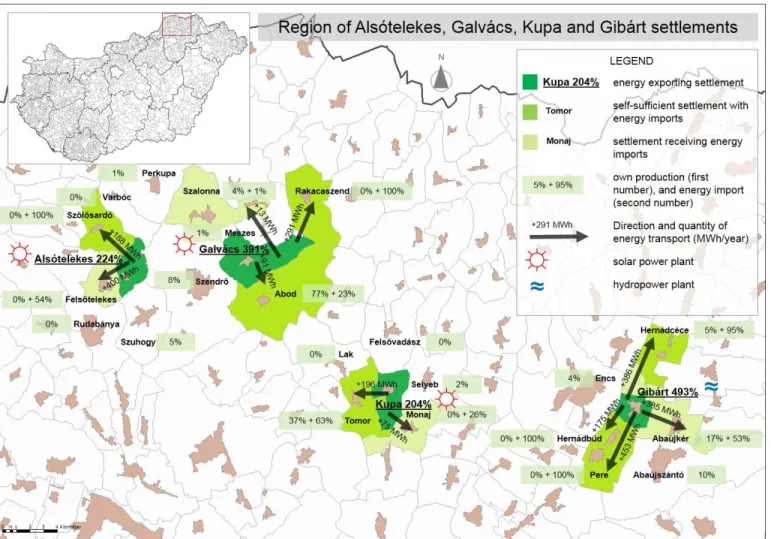
utilization of renewable sources (Table 5). With the combination of these two types of power plants, currently the electric power demands of settlements under 2000 inhabitants could be safely satisfied, and in the medium term the same is also feasible for settlements with populations up to 10,000 people. Settlements producing electricity in excess of their own demands are able to secure 100% renewable energy ratio in 29 other settlements by transferring their unused electric power, meaning that with these power plant categories combined 59 Hungarian settlements could be turned into solely green power consumers, as it can be seen in Figure 3 for the settlements situated in the Cserehát region. As a result, with the small-scale power plants operated with renewables in 2017 nearly 2% of the Hungarian settlement stock can become fully green power consumers from locally generated energy.
TABLEV
SEPARATE AND COMBINED CAPACITIES OF SMALL-SCALE HOUSEHOLD POWER PLANTS (SSHPP) AND SMALL-SCALE POWER PLANTS WITH INSTALLED CAPACITIES UNDER 0.5MW THAT ARE NOT SUBJECT TO AUTHORIZATION OR DO NOT BELONG TO THE SSHPP CATEGORY IN THE ELECTRIC POWER SUPPLY OF SETTLEMENTS, IN
2017
Number of settlements based on the percentage of electricity produced in a small-scale household power plant (SSHPP) and/or small power plant under 0.5 MW capacity from locally renewable energy sources (pcs):
over 100% 30
between 100-50% 24
between 50-10% 164
between 10-1% 1301
under 1% 699
0% 937
Fig. 3 Export of electricity that is available in excess of electric power demands from self-sufficient settlements to the neighbouring settlements in the case of Alsótelekes, Galvács, Kupa and Gibárt, in the northern part of Borsod-Abaúj-Zemplén County (2017).
With the above results, however, it needs to be admitted that still there are numerous obstacles to the implementation of the decentralized renewable energy production systems in Hungarian settlements. Such obstacles include the scarcity of funding, public ownership and the lack of social cooperation, issues concerning the regulatory environment, energy storage and distribution, as well as political determination.
The spread of the use of renewable energy sources can be efficiently accelerated or alternatively decelerated by means of legal regulation, economic incentives, education and environmental marketing. A clear example here is the amendment of Act LXXXV of 2011, which entered into effect on 1 January 2015 [32], and caused a major setback after the 2016 growth of the SSHPP utilizing mostly solar power [20].
Nevertheless, investments accompanying the evidently imposing rise of the SSHPP category are basically encouraged by energy savings in spite of the given parameters of the associated legislation and the lack of feed-in price subsidization.
For the future, an option can be energy transfer to the neighbouring settlements where overproducing settlements as microregional centers of renewable-generated electricity producers are in the position to supply neighbouring settlements [33].
On the other hand, an existing problem is that in Hungary there are no appropriate and sufficient capacities for the storage of electric power generated from renewables and fed into the grid, but it is stored just in the form of distribution via the grid.
At the same time, most of the imported electricity that increases the country’s energy dependence is compensatory energy purchased in periods when power is scarcely available.
ACKNOWLEDGMENT
This paper was supported by the János Bolyai Research Scholarship of the Hungarian Academy of Sciences.
„SUPPORTED BY THE ÚNKP-19-4-DE-36 NEW
NATIONAL EXCELLENCE PROGRAM OF THE
MINISTRY FOR INNOVATION AND TECHNOLOGY.”
This paper was supported by the University of Debrecen Faculty of Engineering
REFERENCES
[1] Sørensen, B. E. 1975: A plan is outlined according to which solar and wind power would supply Denmark’s needs by the year of 2050, Science.
189 (4199) 255-260, 1975., doi: 10.1126/science.189.4199.255 [2] Lovins, B. 1977: Energy Strategy: The road not taken? 55 Foreign affairs
65 (1976-1977)
[3] Lund, H. 2006: Large-scale integration of optimal combinations of PV, wind and wawe power into the electricity supply. In: Renewable energy,
Volume 31, Issue 4, April pp. 503-515., 2006, https://doi.org /10.1016/j.renene. 2005.04.008
[4] Bundesministerium für Wirtschaft und Energie: Erneuerbare-Energie- Gesetz EEG 2000-2017: https://www.erneuerbare- energien.de/EE/Redaktion/DE/Dossier/eeg.html?cms_docId=401818 (Download: 15.05.2018.)
[5] Stern, N. 2006: The Economics of Climate Change: The Stern Review.
2006. Cambridge University Press. ISBN 978-0-521-70080-1 http://mudancasclimaticas.cptec.inpe.br/~rmclima/pdfs/destaques/sternre view_report_complete.pdf
[6] Munkácsy B. et al. 2011: Erre van előre!: Egy fenntartható energiarendszer keretei Magyarországon (This is the Way Ahead – Frameworks of a Sustainable Energy System in Hungary), Vision 2040 Hungary 1.0. Szigetszentmiklós: Környezeti Nevelési Hálózat Országos Egyesület (Szigetszentmiklós: Environmental Education Network National Association), 2011, p. 155 (ISBN: 9789630820240)
[7] United Nations, 2016 Climate Change Conference, Marrakech, Morocco, on 7-18 November 2016. COP22, CMP12, CMA1, Marrakech Vision:
World's Most Climate-Vulnerable Countries Aiming For 100 Percent Green Energy, https://unfccc.int/process-and-meetings/conferences/past- conferences/marrakech-climate-change-conference-november- 2016/marrakech-climate-change-conference-november-2016
[8] Rajgor, G. 2012: Germany grapples with energy plan, Renewable Energy Focus, Volume 13, Issue 4, pp. 26-29., 2012, https://doi.org/10.1016/S1755-0084(12)70084-4
[9] Li Wen Li, J. Birmele, H. Schaich, and W. Konold 2013: Transitioning to Community-owned Renewable Energy: Lessons from Germany. Procedia Environmental Sciences. Volume 17, 2013, Pages 719-728, https://doi.org/10.1016/j.proenv.2013.02.089
[10] Sierra Club 2019: Ready for 100% https://www.sierraclub.org/ready-for- 100 (Download: 15.05.2018.)
[11] Ashok, S. 2007: Optimised model for community-based hybrid energy system. Renewable Energy. Volume 32, Issue 7, June 2007, Pages 1155- 1164. https://doi.org/10.1016/j.renene.2006.04.008
[12] Goodbody, C., E. Walsh, K. P. McDonnell and P. Owende 2013: Regional integration of renewable energy systems in Ireland – The role of hybrid energy systems for small communities. International Journal of Electrical Power & Energy Systems. Volume 44, Issue 1, January 2013, Pages 713- 720. https://doi.org/10.1016/j.ijepes.2012.08.012
[13] Duić, N., M. G. Carvalho 2004: Increasing renewable energy sources in island energy supply: case study Porto Santo. Renewable and Sustainable Energy Reviews. Volume 8, Issue 4, August 2004, Pages 383-399.
https://doi.org/10.1016/j.rser.2003.11.004
[14] Sıdkı Uyar, T. and D. Beşikci 2017: Integration of hydrogen energy systems into renewable energy systems for better design of 100%
renewable energy communities. International Journal of Hydrogen Energy. Volume 42, Issue 4, 26 January 2017, Pages 2453-2456, https://doi.org/10.1016/j.ijhydene.2016.09.086
[15] Neves, D., C. A. Silva and S. Connors 2014: Design and implementation of hybrid renewable energy systems on micro-communities: A review on case studies. Renewable and Sustainable Energy Reviews. Volume 31, March 2014, Pages 935-946, https://doi.org/10.1016/j.rser.2013.12.047 [16] Rahman, Md. M., Md. M-U-H. Khan, M. A. Ullah, X. Zhang and A.
Kumar 2016: A hybrid renewable energy system for a North American off-grid community. Energy. Volume 97, 15 February 2016, Pages 151- 160. https://doi.org/10.1016/j.energy.2015.12.105
[17] Kulcsár, B. 2018: Települési villamos energia önellátás meghatározásának módszerei. The methods of determination of settlement’s electricity self-sufficiency. International Journal of Engineering and Management Sciences (IJEMS) Vol. 3. (2018). No. 45.
DOI: 10.21791/IJEMS.2018.5.1.
http://ijems.lib.unideb.hu/file/9/5bebdbc6623ea/szerzo/10.21791IJEMS.
2018.5.1.pdf
[18] Act. LXXXVI of 2007 on electricity
[19] Government Decree 273/2007 (X. 19.) on the implementation of Act LXXXVI of 2007 on electricity
[20] Hungarian Energy and Public Utility Regulatory Authority (MEKH) 2018: Summary data of small power plants not subject to permitting, including small-scale household power plants (2008–2017) http://www.mekh.hu/download/7/28/60000/nem_engedelykoteles_es_h mke_beszamolo_2008_2017.pdf
[21] Government Decree 389/2007 (XII. 23.) on the mandatory off-take and off-take price of electricity generated using energy produced from renewable energy sources or waste and cogenerated electricity (KÁT Decree)
[22] Decree 63/2016 (XII.28.) NFM of the Ministry of National Development on the detailed rules pertaining to the form of determination and payment of the monetary assets needed for the funding of operating subsidies for electricity generated from renewable energy sources (Allocation Decree) [23] Government Decree 299/2017 (X. 17.) on the feed-in tariff for renewable
electricity and the premium tariff (KR)
[24] Decree 62/2016 (XII.28.) NFM of the Ministry of National Development on restrictions imposed subsidies for the generation of electricity from renewable resources and application procedures for premium subsidies (NFM Decree)
[25] Decree 63/2016 (XII.28.) NFM of the Ministry of National Development on the detailed rules pertaining to the form of determination and payment of the monetary assets needed for the funding of operating subsidies for electricity generated from renewable energy sources (Funding Decree) [26] Regulation 13/2017 (XI.8.) MEKH of the Hungarian Energy and Public
Utility Regulatory Authority on the rates of operating subsidies for electricity generated from renewable energy sources (MEKH Regulation) [27] Decree 55/2016 (XII.21.) NFM of the Ministry of National Development on the technical requirements associated with the use of subsidies for the purchasing and operations of equipment and systems generating renewable energy (Technical Decree)
[28] Hungarian Central Statistical Office (HCSO) 2017: System of territorial statistical data – TEIR 2017, Központi Statisztikai Hivatal – KSH, Hungarian Central Statistical Office (HCSO), Communal service supply, environment, total volume of electricity supplied (MWh) in 2017 (settlement), as well as the number of electricity consumers (units) in 2017 (settlement)
https://www.teir.hu/rqdist/main?rq_app=tdm_nd&rq_proc=main [29] PVGIS 2019: European Commission Joint Research Centre, Ispra, Italy,
Photovoltaic Geographical Information System (PVGIS) https://re.jrc.ec.europa.eu/pvg_tools/en/tools.html
[30] Magyar Villamosenergia-ipari Átviteli Rendszerirányító Zrt. - MAVIR, MAVIR Hungarian Independent Transmission Operator Company Ltd. A magyar villamosenergia- rendszer (VER) 2017.- évi statisztikai adatai.
Data of the Hungarian electricity system, 2017, HU ISSN 2560-1172 https://www.mavir.hu/documents/10258/154394509/MEKH+MAVIR+
VER+2017_kiadvany_vegleges_20181116.pdf/d345fdb8-7048-4af2- 9a63-1d7415bb84c9
[31] Hungarian Central Statistical Office (HCSO) 2017: Központi Statisztikai Hivatal (KSH), Magyarország közigazgatási helynévkönyve, 2017.
január 1., Gazetteer of Hungary 1 January 2017, Budapest, 2017, ISSN 1217-2952 https://www.ksh.hu/docs/hun/hnk/hnk_2017.pdf
[32] Act. LXXXV of 2011 on the environmental product levy
[33] Kulcsár, B. 2015: Implementation Opportunities of Geothermal Energy Systems in the Peripheries along the Border of Hungary and Romania, Geographica Pannonica, Volume 19, Issue 3, 88-100 (September 2015) Scopus, ISSN 0354-8724 (hard copy), ISSN 1820-7138 (online), http://www.dgt.uns.ac.rs/pannonica/papers/volume19_3_1.pdf
![Fig. 1 Distribution of small power plants with capacities below 0.5 MW among the various energy sources, with respect to the number units and their nominal capacities, based on data from [20]](https://thumb-eu.123doks.com/thumbv2/9dokorg/799019.38071/4.918.89.811.95.400/distribution-plants-capacities-various-sources-respect-nominal-capacities.webp)