1
Determination of settlement electricity self-sufficiency with the use of average utilization rate and PVGIS methods
Balázs KULCSÁR1
Keywords
self-sufficient settlements, renewable energy, small-scale power plants, local energy production, energy geography, Hungary
Acknowledgments
This paper was supported by the János Bolyai Research Scholarship of the Hungarian Academy of Sciences.
„SUPPORTED BY THE ÚNKP-19-4-DE-36 NEW NATIONAL EXCELLENCE PROGRAM OF THE MINISTRY FOR INNOVATION AND TECHNOLOGY.”
This paper was supported by the University of Debrecen Faculty of Engineering
1 University of Debrecen, Faculty of Engineering H-4028 Debrecen, Ótemető u. 2-4. Hungary, E-mail: kulcsarb@eng.unideb.hu
2 Abstract
The goal of the study is to develop an estimation method with software calculations and based on the mean utilization rate data in order to establish in what proportions small-scale household power plants (SSHPP) that belong to the category of small-scale power plants in the most decentralized locations and among local power plants, as well as small power plants with nominal capacities under 0.5 MW that are not subject to permits contribute to the satisfaction of the electricity demands of settlements when all the settlements in Hungary are concerned. In what ways are these proportions present in the settlements of various sizes? What results have been accomplished in the process of the energy transition during the past ten years since the regulatory conditions for the establishment of power plants were put in place when changes in the economic environment and subsidization background are also taken into consideration? Are there settlements in Hungary that are capable of satisfying 100% of their electric power demands from local renewable sources, i.e.
if the energy transition is feasible? With this method, energy policies can be planned better for the future, the subsidization system can be adjusted, the energy mix can be modified, and the process of energy transition can be accelerated. We have conducted our studies from the perspective of energy geography and settlement geography.
Introduction
The transition of the energy use to renewable energy sources has become an increasingly urgent global task, the necessity of which is supported by the results of a broad range of climate researches that tend to be more and more pessimistic. In order to mitigate this risk, energy transition should be implemented in the sectors of electricity, heat energy and transport energy alike.
Fossil energy sources still represent a significant proportion of the Hungarian energy balance, while their majority is imported. Therefore, it is important to increase the share of renewable energy sources in the Hungarian energy mix. In Hungary, the process of energy transition started at a relatively late date, however, significant results have been achieved in the past ten years, primarily by making the electric power production carbon neutral (MAVIR, 2017). However a significant time lag can be observed in comparison to the European level (EUROSTAT, 2017).
In the course of the extremely fast-paced spread of renewable energy sources worldwide, more and more municipalities aim to satisfy their own energy demands from renewable sources. Most of the energy is utilized in the settlements, and therefore it is evident that the most economical and most gentle procedure is to produce energy locally and from renewable energy sources. Nevertheless, just few studies and organizations deal with the implementation possibilities of electricity self- sufficiency or the measurement of results.
The goal of the studies is to find out in what proportions small-scale household power plants (SSHPP) that belong to the category of small-scale power plants in the most decentralized locations and among local power plants, as well as small power plants with nominal capacities under 0.5 MW that are not subject to permits contribute to the satisfaction of the electricity demands of settlements when all the settlements in Hungary are concerned. In what ways are these proportions present in the settlements of various sizes? What results have been accomplished in the process of the energy transition during the past ten years since the regulatory conditions for the establishment of power plants were put in place when changes in the economic environment and subsidization
3
background are also taken into consideration? Are there settlements in Hungary that are capable of satisfying 100% of their electric power demands from local renewable sources, i.e. if the energy transition is feasible?
Background
The issue of covering 100% of energy demands from renewable sources emerged on the national level as early as 1975 in Denmark (SØRENSEN,B.E. 1975), followed by further theories (LOVINS, B. 1977) and software models worldwide (LUND,H. 2006). Beyond the scientific theories, the first specific steps were taken by Iceland in 1988, when a governmental decision was made about energy transition. The start of establishing self-sufficient systems for settlements is associated with the effective date of 1997 of the German Renewable Energy Act, which allowed for predictable returns (EEG, 2017). The Stern Review in 2006 brought about another breakthrough in the estimation of the renewable sources, it authentically supported the inevitable and reasonable necessity of energy transition beyond the environmental and technological arguments also in the field of the economy (STERN, N. 2006). In Hungary, the first computer model was developed at the Department of Environmental and Landscape Geography at Eötvös Loránd University (ELTE) (MUNKÁCSY,B. et al. 2011). The highest level of governmental commitment to energy transition so far was reached in the “Marrakech Vision”, where several countries – it is to be noted that those countries that are the most exposed to the negative effects of climate change – agreed to base their energy systems on renewables (UN. 2016).
The first self-sufficient settlements
The earliest example on the settlement level was the Bavarian settlement of Wildpoldsried, where – following the adoption of the German Renewable Energy Act (EEG, 2017) – the settlement wished to ground their total electric power, heat energy and transport energy supply on renewable sources, with reliance on locally available sources (RAJGOR, G. 2012). Following the first successful, primarily German (Aller-Leine-Tal, Effelter, Alzey-Land region, Bruchsmühlbach- Miesau, Dardesheim, Groβbardorf), Danish (Samsø island, Frederikshavn) and Austrian (Güssing) examples in relation to settlements, among others LI WEN LI et al. (2016) examined the successful social, sociological aspects of the execution of projects relating to community-owned renewable energy through case studies in Germany. The first good practices were followed by other settlements from villages to cities (SIERRA CLUB,READY FOR 100%).
The technical literature concerning the electricity self-sufficiency of settlements seeks purely renewable and hybrid solutions primarily for ensuring 100% electric power supply of the off-grid, rural regions and islands (ASHOK,S. 2007 and GOODBODY,C. et al. 2013). DUIĆ N.-CARVALHO, N.G. (2003) and UYAR,T.D.-BEŞIKCI,D. (2017) suggested the production of hydrogen for the storage of the local renewable electric power in order to realize self-sufficiency for these geographic regions and system balancing. NEVES,D. et al. (2016), and RAHMAN,MD.M. et al.
(2016) studied solutions for the storage of electric power from renewable sources through case studies of the off-grid rural regions of India and Canada, respectively.
International energy organizations
4
Operating worldwide, there are several organizations that examine the energy system, follow trends, and develop prognoses and scenarios for future development in relation to renewable energy sources on global and regional scales: they are the International Energy Agency IEA, World Energy Council, International Renewable Energy Agency IRENA, European Renewable Energies Federation EREF, European Renewable Energy Council EREC, Bloomberg New Energy Finance, Bundesverband Erneuerbare Energie e.V. BEE, U.S. Energy Information Administration EIA.
They all monitor the rise of renewable energy sources, as well as the potential feasibility of energy transition and the possible times of the accomplishment of these goals on the global and regional level. However, instead of the official organizations, it is rather community initiatives and non- governmental organizations that focus on and act for the integration of the settlement-scale implementation of energy transition (IEA; WORLD ENERGY COUNCIL; IRENA; EREF; EREC;
BLOOMBERG NEF;BEE;EIA).
Research institutes, non-governmental organizations and community initiatives
The Global 100% Renewable Energy Platform is a worldwide organization that supports the conversion to using 100% renewable energy. It links up the supporters of overall energy transition, and creates a global network, organizes initiatives on the national, regional and local level. It serves as a mediator among the interested parties, campaigns with the political decision-makers, collects case studies and good practices from all over the world. The goal of the scientific, industrial and political founders of the non-governmental organization is to establish the global network and association of 100% RE regions in the field of electricity production, heating/cooling and transport energy. It encompasses 154 settlements worldwide. The form of the achievement of the 100%
renewable share is not determined, and therefore this goal can be met by utilizing both local and imported energy (THE GLOBAL 100%). The Go 100% Renewable Energy organization has similar objectives in support of the transition to 100% renewable energy sources in all three consumer sectors. The organization is working on an interactive map of projects associated with 100%
renewable energy on the world. It publishes educational and promotional materials, but does not determine methodologies. 166 projects are registered globally from residential communities to the state level (GO 100% RENEWABLE ENERGY).
The Institute for Local Self-Reliance (ILSR) is a national research and technical assistance organization that offers a framework for initiatives, projects leading sustainable energy policies with the use of local sources, and aiming to implement transition to 100% renewable energy. Their classification system evaluates the member states of the United Sates based on their energy policies, the freedom of choice among energies, the location and share of renewable energy production (ILSR). The American Sierra Club – Ready for 100% initiative keeps account of the settlements in the American United States that are already using 100% renewable energy and those places that have made a commitment to reach that state until target deadlines. Currently, 84 settlements are members of Ready for 100% (SIERRA CLUB,READY FOR 100%).
The 100% Erneuerbare-Energie-Regionen is a German development project (Entwicklungsperspektiven für nachhaltige 100%-Erneuerbare-Energie-Regionen in Deutschland"
– 100ee-Regionen) that connects the regions and settlements that are planning to rely fully on renewable energy sources in all the three sectors in the medium and long term. Currently, there are 150 regional associations, counties and settlements in Germany aiming to accomplish this objective (100EE ERNEUERBARE ENERGIE REGION). The 100% Renewable Energy Sources Communities is an organization similar to those described above with its fundamental goal being the promotion of
5
the utilization of renewable energy primarily in rural regions. The Hungarian Energiaklub Szakpolitikai Intézet Módszertani Központ (Methodological Center for the Energy Club Policy Institute) is one of its partners. Energy Club deals with the development of the Sustainable and Climate Action Plans for Hungarian settlements, and is involved in the preparation of technical studies tailored to local demands and counseling (ENERGY CLUB).
The associated technical literature, official energy organizations, non-governmental organizations supporting renewable energy and community initiatives do not define criteria for the achievement of the 100% renewable share for the energy supply of regions with various geographical scales.
The goal can be realized by utilizing local renewable energy sources, purchasing import energy generated from renewable sources, energy exchange or energy compensation, as well as by using large power plants established from investment fund from beyond the territories of the settlement concerned. In our previous study, due to the lack of methodology, we studied the energy routes of members and methods for the implementation of the objectives, developed methodological categories based on case studies. These categories were introduced through the most typical case studies by considering the need to take examples from the broadest possible settlement sizes (KULCSÁR,B. 2018). Based on these studies, the following categories could be identified:
- Securing the volume of renewable electricity that satisfies local demands from regional sources.
- Purchasing and local production of electric power generated from renewable sources.
- Utilization of locally available and locally produced renewable energy sources to provide for 100% of the existing energy demands. Community initiative and property (sharing economy).
- Energy compensation.
- Energy exchange with the neighbouring settlements.
- Energy export.
When determining the self-sufficiency level of Hungarian settlements, we aspired to consider local sources, and in this context the renewable energy sources obtainable on the strictly defined territory of the settlement, and consequently the energy-producing capacity of the settlement were calculated, while that method also met the criteria of decentralized energy production. In order to avoid the bias generated by the sizes of settlements, large power plants operating with renewable sources were not taken into consideration. At the current stage of the research, from among electricity production, heating–cooling and the transportation energy sectors, we focused on electric power generation. Our studies were conducted in relation to the year of 2017, as that has been the most recent year with respect to which the entire scope of relevant and adjusted data are available from all sources.
Data and methods
Magyar Villamosenergia-ipari Átviteli Rendszerirányító Zrt. (Mavir Hungarian Transmission System Operator Company Ltd, MAVIR) distinguishes the following power plant categories with respect to the capacities of power plants in the Hungarian electricity system. Basically, power plants under 50 MW are categorized as small power plants, whereas power plants at or above 50 MW are large power plants. Small power plants with capacities between 50 and 50 MW, between 0.5 MW and 50 kW and below 50 kW are differentiated from each other within the below 50 MW category (Act LXXXVI of 2007; Government Decree 273/2007). The study considered the output
6
of small-scale household power plants (SSHPP) of 50 kVA (50 kW) or smaller capacity that are not subject to permitting, as well as non-SSHPP small power plants (small power plants) of installed electric output under 0.5 MW, similarly not being subject to permitting; their establishment has been allowed by the Hungarian Electricity Act since 1 January 2008.
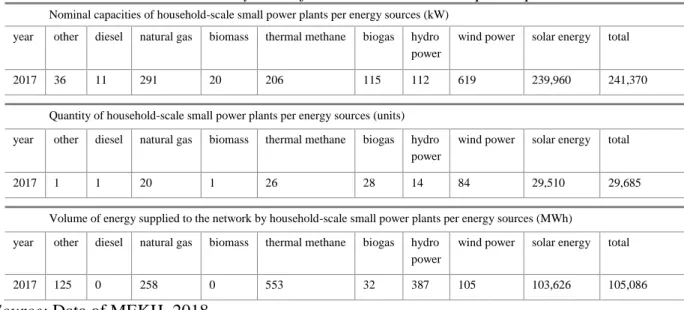
HMKEs are fundamentally installed by the institutional, corporate and household segment for the total or partial satisfaction of their electric power demands. Their electric power turnover is measured by electronic input–output consumption meters. The generated energy is utilized locally, while any excess is transferred to the network. In case production is suspended, the network supplies the required electric power. Suppliers perform settlements by calculating the balance of the volumes of electricity drawn from and fed into the network as measured by the consumption meters and in view of the currently effective unit prices. The number of SSHPPs has showed dynamic increase in each year since 2008, there were 29,685 units at the end of 2017 with an aggregated nominal capacity reaching 241.4 MW. 99.41% of the power plants are solar power plants, while the remaining 0.59% operates with such sources of energy as thermal methane gas, diesel, natural gas, biomass, biogas, water and wind. The volume of energy supplied to the network by SSHPPs was 105,086 MWh in 2017 (MEKH, 2018) (Table 1).
Table 1: Summary data of small-scale household power plants
Nominal capacities of household-scale small power plants per energy sources (kW) year other diesel natural gas biomass thermal methane biogas hydro
power
wind power solar energy total
2017 36 11 291 20 206 115 112 619 239,960 241,370
Quantity of household-scale small power plants per energy sources (units) year other diesel natural gas biomass thermal methane biogas hydro
power
wind power solar energy total
2017 1 1 20 1 26 28 14 84 29,510 29,685
Volume of energy supplied to the network by household-scale small power plants per energy sources (MWh) year other diesel natural gas biomass thermal methane biogas hydro
power
wind power solar energy total
2017 125 0 258 0 553 32 387 105 103,626 105,086
Source: Data of MEKH, 2018
The number of small power plants below 0.5 MW reached up to 238 until 31 December 2017, and their aggregate nominal capacity was 78.2 MW. The range of the utilized energy sources was wide, including both renewable and fossil energy sources. Most of the electric power in this category is generated from renewables, including solar, wind and hydropower, biogas, landfill gas and wastewater gas. Fossil energy sources, to a smaller extent, also appear with small power plants, primarily at power plants producing energy from natural gas, thermal methane gas, other gases and petrol (MEKH, 2018). 71% of the power plants are solar power plants, followed by biogas and wind power plants with 14% and 10% shares, respectively. Solar power plants are also on the top of the rank when capacity is concerned, with 78% of the nominal capacity of the category belonging to them, followed by biogas power plants with a 14% share from capacities. Hydropower (4%) and natural gas (3%) similarly represent significant proportions in the energy mix (Figure 1).
7
Fig. 1. Distribution of small power plants with capacities below 0.5 MW among the various energy sources, with respect to the number units and their nominal capacities. Source: Data of MEKH, 2018
These power plants, unlike the SSHPP power plants, are mostly established by companies. In general, they are constructed for profit-making by way of connection to the mandatory off-take system (KÁT), which was in effect until 31 December 2016 (Act LXXXVI of 2007; Government Decree 389/2007; Decree 63/2016) and thereafter to the renewable energy subsidization system (METÁR) from 1 January 2017 (Act LXXXVI of 2007; Government Decree 299/2017; Decree 62/2016I; Decree 63/2016; Regulation 13/2017; Decree 55/2016).
The settlement-level SSHPP unit and capacity data were made available by E.ON Energiaszolgáltató Kft., ELMÜ-ÉMÁSZ Energiaszolgáltató Zrt. and Dél-magyarországi Áramszolgáltató Zrt. (DÉMÁSZ) as universal suppliers operating in the territory of Hungary, whereas unit and capacity data for small power plants under the capacity of 0.5 MW were disclosed by the Hungarian Energy and Public Utility Regulatory Authority (MEKH). Accurate settlement- level electricity production data are handled as business secret by the universal suppliers, MEKH and MAVIR, and therefore they were not made available for the purposes of the study; additionally production data measured by universal suppliers fail to reflect the actual electric power production figures of the SSHPP power plant units. The underlying reason is that the energy consumed by any equipment installed before the meter is not fed into the network, and therefore, it is not measured, either. Universal suppliers are in possession of data only in relation to the volume of electric power that is transferred to the network by the generating power plant. As a result, the volume of electric power generated in the settlements from renewable sources cannot be determined based on the available data. Therefore, local renewable electricity production data for the settlements were generated with the use of calculations based on the following principles.
In order to determine the self-sufficiency level of the settlements where power plants belonging to the two categories are installed, the annual volume of electric power that can be theoretically produced by the power plants (for solar energy), and can be determined based on the average annual utilization rates (for other renewable energy sources) was compared to the annual electric power consumption of the settlement for the year of 2017 (TEIR, 2017). Calculations were made to see as to what proportions of the electric power demands of the settlements could be satisfied by the studied power plant categories, and more specifically by those power plants within these groups that utilize local renewable energy sources.
A theoretical electric power volume that could be produced annually was determined from the settlement-level total capacity data at the end of 2017 for solar panel systems. We used the
8
PHOTOVOLTAIC GEOGRAPHICAL INFORMATION SYSTEM (PVGIS) operated by the Joint Research Centre of the European Commission (Ispra, Italy). Using the software, we performed the calculations for every Hungarian settlement where SSHPP and/or photovoltaic small power plant capacities under 0.5 MW output was operated.
For other renewable energy sources, the annual renewable electric power volume that could be theoretically generated in the settlements in 2017 was established with the use of the average utilization rate data for the year of 2017, which were made available by MEKH (Table 2). The annual utilization rate data are also accessible for solar energy, but in the case of this energy source PVGIS allowed for more accurate calculations.
Table 2: Average utilization rates of HMKEs and small power plants with nominal capacities under 0.5 MW and utilizing renewable energy source in 2017
Energy source wind power hydropower biomass biogas landfill gas sewage gas solar energy
Average utilization (%) 25.9 40.9 60.1 46.5 57.1 50.9 15.2
Source: Data of MAVIR, 2017
From among the other energy carriers, small power plants fueled with petrol, diesel, natural gas, gas and thermal methane gas were not considered, as they are fossil energy sources, and therefore are not relevant to our studies.
The studies were performed for the territories of 3155 local municipalities in Hungary (HCSO, 2017). The conditions for the implementation of energy transition are uneven for settlements of different sizes. The accomplishment of the above objectives is on a different scale for a village with small population or a city of more than 100,000 inhabitants. In order to formulate a distinct view of in relation to the respective shares of renewable energy sources from the electric power supply of settlements of various sizes, three settlement categories were set up. Settlements with population under 10,000, between 10,000 and 100,000 and over 100,000 were differentiated.
The settlements were ranked in each of these settlement categories, as well as based on the above- referenced data and methods.
Results
With reliance on the above data and methods, local renewable electricity self-sufficiency for all the settlements in Hungary was studied on the settlement level, both separately and cumulatively. The data were run in the case of small-scale household power plants and then for small power plants under 0.5 MW, which were not subject to permitting, as well as for non-HMKE small power plants and finally by combining the two power plant categories with the examination of their combined capacities.
Capacity of the small-scale household power plants
First, the capacity of the power plants belonging to the small-scale household power plant category, using renewable energy sources, was examined. From among the 3155 Hungarian settlements, SSHPPs were set up in 2200 settlements between 1 January 2008 and 31 December 2017, and consequently the remaining 955 settlements have no small-scale household power plants using renewable energy. Based on the obtained results, this power plant category can satisfy 100% of the
9
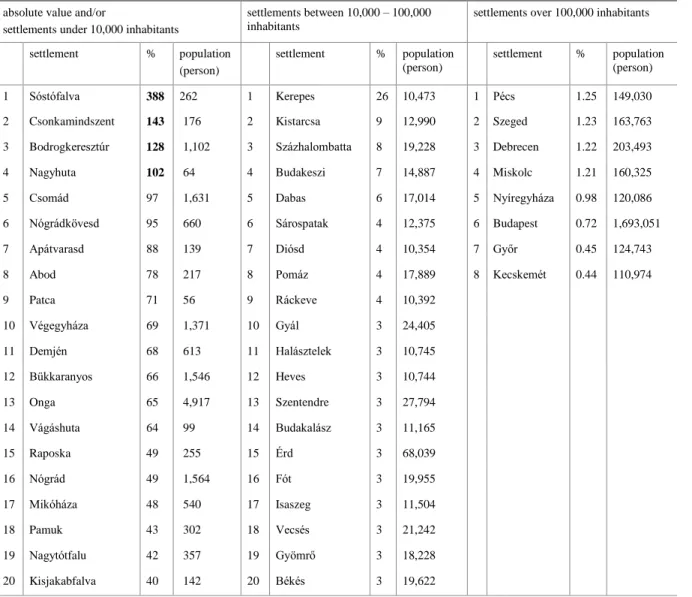
electric power demands in the case of four settlements. All of these settlements belong to the settlement size category featuring under 10,000 population (Table 3 and Figure 2). At the top of the ranking of these four settlement, there stands Sóstófalva with 262 inhabitants, where local renewable electric power production is at 388%, i.e. the village produces nearly four times as much electric power within its territory as its annual demand, solely in this power plant category and only with the use of solar energy from among renewable energy sources. Csonkamindszent with its 176 inhabitants is the second; here renewables cover 143% of the demands, also with reliance on solar power. The third-ranking settlement is Bodrogkeresztúr at 128%, where 85% of the renewable energy produced by SSHPPs is generated from biogas and the remaining 15% from solar energy.
This settlement is outstanding also because – in contracts with the former villages of a few hundred inhabitants – it is in fact a town of 1102 inhabitants. The fourth settlement is Nagyhuta with 64 inhabitants and at 102%, where the electric power demands are satisfied by solar panels. Of the first 20 settlements with population counts under 10,000, the population of five settlements exceeds 1000, and Onga with nearly 5000 inhabitants is the only one among them that ranks as a town; here renewable electric power satisfies 65% of the annual demand of the town, 96% of which comes from biogas and 4% originates from solar energy. In the HMKEs of these 20 settlements, besides solar energy, biogas has a significant role with its share being 87% in Csomád and almost 100% in Nógrádkövesd, while wind power has a significant role only in Bükkaranyos with 88%, where it complements solar energy.
10
Table 3: Proportion of the electric power generated from local renewable energy sources in the category of small-scale household power plant (SSHPP) in the electric power consumption of the
settlements
absolute value and/or
settlements under 10,000 inhabitants
settlements between 10,000 – 100,000 inhabitants
settlements over 100,000 inhabitants
settlement % population
(person)
settlement % population (person)
settlement % population (person)
1 Sóstófalva 388 262 1 Kerepes 26 10,473 1 Pécs 1.25 149,030
2 Csonkamindszent 143 176 2 Kistarcsa 9 12,990 2 Szeged 1.23 163,763
3 Bodrogkeresztúr 128 1,102 3 Százhalombatta 8 19,228 3 Debrecen 1.22 203,493
4 Nagyhuta 102 64 4 Budakeszi 7 14,887 4 Miskolc 1.21 160,325
5 Csomád 97 1,631 5 Dabas 6 17,014 5 Nyíregyháza 0.98 120,086
6 Nógrádkövesd 95 660 6 Sárospatak 4 12,375 6 Budapest 0.72 1,693,051
7 Apátvarasd 88 139 7 Diósd 4 10,354 7 Győr 0.45 124,743
8 Abod 78 217 8 Pomáz 4 17,889 8 Kecskemét 0.44 110,974
9 Patca 71 56 9 Ráckeve 4 10,392
10 Végegyháza 69 1,371 10 Gyál 3 24,405
11 Demjén 68 613 11 Halásztelek 3 10,745
12 Bükkaranyos 66 1,546 12 Heves 3 10,744
13 Onga 65 4,917 13 Szentendre 3 27,794
14 Vágáshuta 64 99 14 Budakalász 3 11,165
15 Raposka 49 255 15 Érd 3 68,039
16 Nógrád 49 1,564 16 Fót 3 19,955
17 Mikóháza 48 540 17 Isaszeg 3 11,504
18 Pamuk 43 302 18 Vecsés 3 21,242
19 Nagytótfalu 42 357 19 Gyömrő 3 18,228
20 Kisjakabfalva 40 142 20 Békés 3 19,622
Source: Edited by the author
11
Fig. 2. Proportion of the electric power generated from local renewable energy sources in the small- scale household power plant (SSHPP) category, not subject to permitting, in the electric power consumption of settlements. In all settlements, as well as in the population categories under 10,000 inhabitants, between 10,000 and 100,000 inhabitants and over 100,000. Source: Edited by the author
12
In the settlement category where the population is between 10,000 and 100,000 inhabitants, the highest, 26% renewable share is produced in Kerepes, a small town with 10,473 inhabitants. 74%
of the renewable electric power generated in small-scale household power plants is made from biogas, while 26% originates from solar energy. The next town far behind Kerepes is Kistarcsa with a 9% renewable share followed by Százhalombatta with 8% and population twice as large as that of the previous ones. In the vast majority of small towns, solar power plants produce renewable electricity. The exception is Gyál, where the proportion of biogas within renewables is 55%, Szentendre, where it is 8%, and Érd, where biogas accounts for only 1% of the renewable mix. The 26% proportion in Kerepes is outstanding, though it is feasible to achieve a 10% share even in the short run (Table 3). Most of the first 20 small towns in the settlement size category between 10,000 and 100,000 inhabitants are located within the Budapest agglomeration, and here the underlying reason is the suburban characteristics of the build-up structure and the higher standards of living in the population, which is also reflected in the investment capacity of the local governments and residents alike (Table 3 and Figure 2).
There are only eight settlements in the largest settlement category with over 100,000 inhabitants in Hungary. Here, Pécs has the best result, currently with 1.25%. Szeged (1.23%), Debrecen (1.22%) and Miskolc (1.21%) are not far behind. In Budapest, which is larger by an order of magnitude in terms of local population, which is also significant on the global scale, this share is 0.72%. In addition to the predominant solar energy, biogas is the one among the other renewable energy sources that reaches a measurable proportion, and it is so only in Miskolc, where it represents 20%
in the renewable portfolio. There is some wind power utilized in Budapest, Debrecen and Pécs, however, it is only around 1% in electricity generation from renewables (Table 3 and Figure 2).
Capacity of the small power plants with nominal capacities under 0.5 MW, not subject to permitting and belonging to the non-SSHPP group
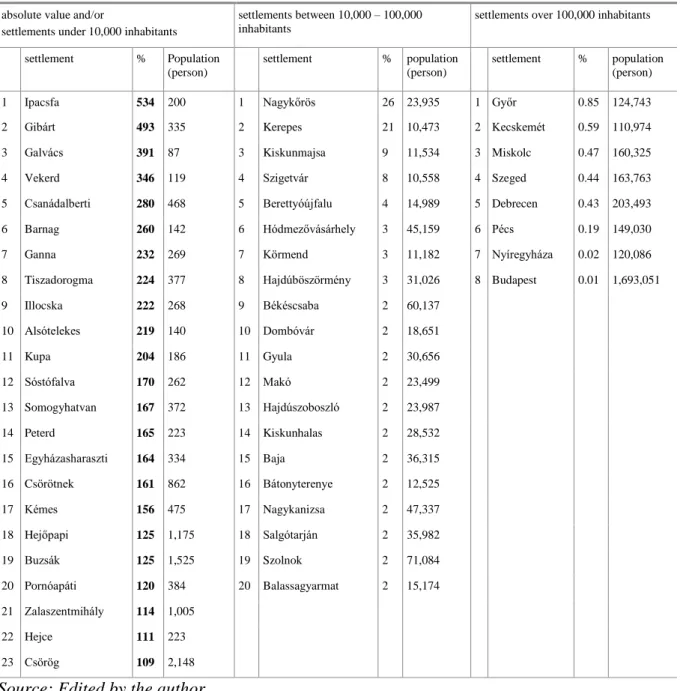
In the second phase of studying the electricity self-sufficiency of settlements, the outputs of the non-SSHPP small power plants with smaller than 0.5 MW capacities were determined in the electric power supply of the settlements where they were located. The 285 power plants established before the end of 2017 operates in 195 settlements, and the associated annual production exceeds the existing demands in 23 settlements. Compared to demands, the largest volume electric power is generated in Ipacsfa, where it reaches 534%. According to the figures presented in Table 4, the first 11 settlements generate multiples of their actual electric power demands with small power plants operated with renewables. Small villages with small population are at the top-ranking places of the list, though the population of Hejőpapi, Buzsák, Zalaszentmihály and Csörög is over 1000.
The majority of the power plants belongs to solar power plants, though Gibárt, ranking second, Csörötnek, ranking 16th and Pornóapáti, ranking 20th generate significant volumes of electric power with the use of water power. Hejőpapi and Csörög are also exceptions, where landfill gas – similarly to Zalaszentmihály, where biogas – is utilized. These 23 settlements are hard to be considered to have real renewable energy mix, as the emphasis falls on a single renewable energy source everywhere.
Among the settlements with population between 10,000 and 100,000, the largest volume of electric power compared to the annual consumption of the town is produce by the small power plants located in Nagykőrös, where 26% is generated from solar energy. Kerepes is next in the rank with 21%; here landfill gas is used as the source of renewable energy. In the top-ranking group of the first 20 settlements, the subsequent towns generate only 2 to 9 percent in small power plants located
13
in their areas, and this output is similar to the ones seen in the SSHPP category. In most towns, this ratio is realized with solar power plants, though hydropower is used in Körmend, biogas in Gyula, while power plants fuelled by landfill gas are operated in Salgótarján. This power plant and settlement size category is the one where the renewable energy portfolio features the broadest range. The 3% renewable electric power share in Hódmezővásárhely is generated from solar energy (38%), biogas (27%) and landfill gas (35%) as sources. 2% of the electricity demand of the county seat, Békéscsaba with more than 60,000 inhabitants originates from four renewable energy sources, notably 8% from solar energy, 18% from wastewater gas, 33% from biogas and 41% from landfill gas. In addition, the 2% electric power demand of Baja is generated from hydropower (11%) and solar energy (89%). Also 2% of the electric power demand of Nagykanizsa is made from landfill gas (79%) and solar energy (21%). In the 2% renewable share of the county seat, Szolnok with more than 71,000 inhabitants, alongside solar energy water power is also used (2%) (Figure 3).
In the annual electric power consumption of cities with over 100,000 inhabitants, small energy plants represent a share under 1% in each case. Győr produces the largest volume of renewable electric power for the energy consumption of the city, namely 85%. 83% of that volume is generated from landfill gas and 17% from solar energy. The next in rank is Kecskemét with 0.59%, where 100% of the renewables is from biogas, while in Nyíregyháza, Pécs and Budapest solar power plants have been deployed. In the case of Debrecen, 78% of renewable electric power production comes from landfill gas and 22% from solar energy; in Szeged, alongside 74% solar energy, biogas represents 26%, while in Miskolc, 58% of the green energy originates from landfill gas and 42% from solar power (Table 4).
14
Table 4: Proportion of the electric power generated from local renewable energy sources in the small power plant category under 0.5 MW, not subject to permitting and belonging to the non-
SSHPP category, in the electric power consumption of the settlements
absolute value and/or
settlements under 10,000 inhabitants
settlements between 10,000 – 100,000 inhabitants
settlements over 100,000 inhabitants
settlement % Population (person)
settlement % population (person)
settlement % population (person)
1 Ipacsfa 534 200 1 Nagykőrös 26 23,935 1 Győr 0.85 124,743
2 Gibárt 493 335 2 Kerepes 21 10,473 2 Kecskemét 0.59 110,974
3 Galvács 391 87 3 Kiskunmajsa 9 11,534 3 Miskolc 0.47 160,325
4 Vekerd 346 119 4 Szigetvár 8 10,558 4 Szeged 0.44 163,763
5 Csanádalberti 280 468 5 Berettyóújfalu 4 14,989 5 Debrecen 0.43 203,493
6 Barnag 260 142 6 Hódmezővásárhely 3 45,159 6 Pécs 0.19 149,030
7 Ganna 232 269 7 Körmend 3 11,182 7 Nyíregyháza 0.02 120,086
8 Tiszadorogma 224 377 8 Hajdúböszörmény 3 31,026 8 Budapest 0.01 1,693,051
9 Illocska 222 268 9 Békéscsaba 2 60,137
10 Alsótelekes 219 140 10 Dombóvár 2 18,651
11 Kupa 204 186 11 Gyula 2 30,656
12 Sóstófalva 170 262 12 Makó 2 23,499
13 Somogyhatvan 167 372 13 Hajdúszoboszló 2 23,987
14 Peterd 165 223 14 Kiskunhalas 2 28,532
15 Egyházasharaszti 164 334 15 Baja 2 36,315
16 Csörötnek 161 862 16 Bátonyterenye 2 12,525
17 Kémes 156 475 17 Nagykanizsa 2 47,337
18 Hejőpapi 125 1,175 18 Salgótarján 2 35,982
19 Buzsák 125 1,525 19 Szolnok 2 71,084
20 Pornóapáti 120 384 20 Balassagyarmat 2 15,174
21 Zalaszentmihály 114 1,005
22 Hejce 111 223
23 Csörög 109 2,148
Source: Edited by the author
15
Fig. 3. Proportion of the electric power generated from local renewable energy sources in the small power plant category under 0.5 MW, not subject to permitting and belonging to the non-SSHPP category, in the electric power consumption of the settlements. In all settlements, as well as in the population categories under 10,000 inhabitants, between 10,000 and 100,000 inhabitants and over 100,000. Source: Edited by the author
Aggregated electricity production capacity of household-scale power plants and small power plants with nominal capacities under 0.5 MW, not subject to permitting and belonging to non- SSHPP category
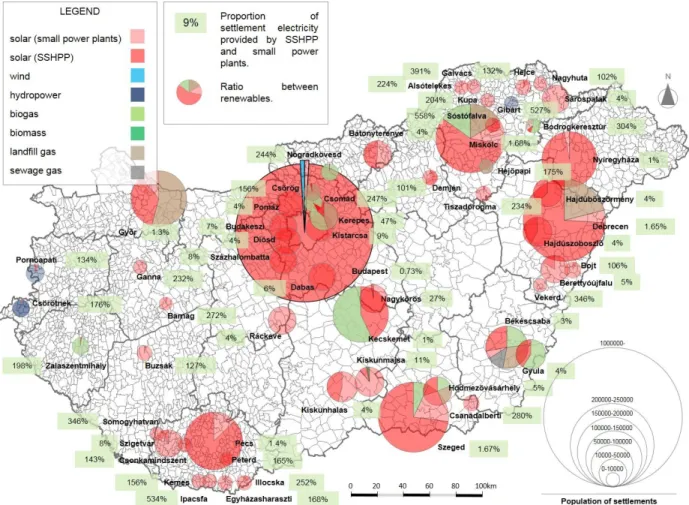
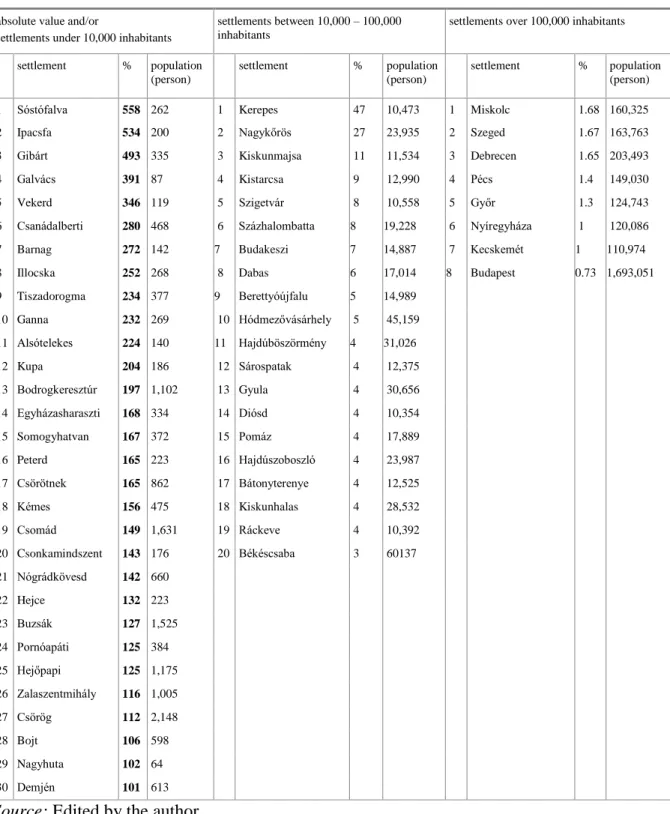
In the third phase of studying the renewable electricity self-sufficiency of settlements, self- sufficiency level with the aggregate capacity of the two previous small power plant categories was calculated. In this context, in 2017 there were 30 settlements in Hungary where SSHPPs and/or small power plants below 0.5 MW were operated with the utilization of renewable energy sources, and they were capable of covering more than 100% of the annual electric power demands of the settlements. Each of these 30 settlements belongs to the smallest settlement size category, 80% of which were villages with population under 1000, while 20% of them had population over 1000.
Compared to its own annual demand, Sóstófalva produced the largest volume of electricity, i.e.
more than five times larger than the consumption of the village, notably 558% (Table 5). Ipacsfa with 534% and Gibárt with 493% were not far behind. In the case of Sóstófalva, all power plants utilizing renewables operated with solar energy, still electric power generated in SSHPPs and small
16
power plants below 0.5 MW could be distinguished with their respective ratios in this specific case being 70% and 30%. The same principle was followed for several other settlements showed in the map (Figure 4). The total volume of renewable electric power in Ipacsfa is generated by solar power plants, and in Gibárt by the local water power plant, which also belongs to the power plant category below 0.5 MW. The majority of the power plants in the 30 settlements operate on solar energy, with the exception of Demjén, where SSHPPs provide the most part of electricity. A more complex energy mix can be observed in Bodrogkeresztúr, where alongside 9% solar energy, landfill gas provides for 35% and biogas for 56% of the electric power generated from renewables.
In Csörötnek, hydropower accounts for 98% of production, completed by 2% solar energy. In Csomád, beyond the 34% of small power plant biogas, an additional share of 58% is generated in SSHPP biogas power plants and 8% in SSHPP solar energy plants. The situation is similar in Nógrádkövesd, where the distribution between small power plant biogas, SSHPP biogas and solar energy is 33%, 66% and 1%, respectively. In Pornóapáti, 98% of the renewable electric power is generated from hydropower and 2% from solar energy, Zalaszentmihály has 98% from biogas and 2% from solar energy, whereas in Csörög 97% of this energy comes from landfill gas and 3% from solar energy.
Among the settlements belonging to the population category between 10,000 and 100,000 inhabitant, the most electric power compared to the electric power demand of the towns is generated in Kerepes, and it accounts for 47% of the electric power (Table 5). 47% of this renewable electric power is generated from landfill gas utilized in small power plants, 41% from SSHPP biogas and 14% from SSHPP solar energy (Figure 4). Nagykőrös is second in rank with a 27% renewable share, 97% of which is produced in small power plants and 3% from SSHPP solar energy. In the next town, Kiskunmajsa, the proportion of renewable electric power is only 11%
with 89% originating from small power plant solar energy, 8% from SSHPP solar energy and 3%
from SSHPP biomass. In the remaining towns of the first 20 settlements, power plants of the two small power plant categories contribute to the supply of the settlement in 9% to 3%. In the 20 towns, 80% of electricity generated from renewables is produced in HMKE and small solar power plants; apart from the above-mentioned Kerepes and Kiskunmajsa, from the 5% renewable electric power demand in Hódmezővásárhely, 30% comes from HMKE solar power plants, 26% from solar power plants below 0.5 MW, 25% is generated from small power plant landfill gas and 19% from small power plant biogas. In addition, Gyula with 4% and Békéscsaba with 3% boast of more varied energy mixes. In Gyula, besides the 41% of household-scale small solar power plants, small power plant biogas is also a part of renewable electricity production with around 59%. The portfolio of the renewable electric power sources is the broadest in Békéscsaba, where the energy mix consists of 30% small power plant landfill gas, 28% SSHPP solar energy, 23% small power plant biogas, 13% small power plant wastewater gas and 6% small power plant solar energy (Table 5 and Figure 4).
Studies concerning small power plants operating in the areas of cities with more than 100,000 inhabitants, with focus on the combined output of two power plant types, concluded that they were capable of covering maximally 1.68% of the annual electric power demand of the cities in question (Table 5). This result was achieved by Miskolc, followed by Szeged and Debrecen with 1.67% and 1.65%, respectively. Budapest arrived at 0.73% in this third phase of the studies. In Miskolc, the 1.68% proportion of renewables could be further split up to SSHPP solar power plants in 57%, landfill gas small power plants in 16%, SSHPP biogas small power plants in 15% and solar small power plants in 12%. In Szeged, 73% of the renewable electric power is produced by SSHPP solar
17
power plants, 20% by small solar power plants and 7% by biogas small power plants. In Debrecen – alongside 74% from SSHPPs and 5% solar energy generated in small power plants –, landfill gas utilized in small power plant plays a part in satisfying electric power demands up to 21%. Solar energy is dominant in Pécs, Nyíregyháza and Budapest, wind power is also represented in the capital city with almost 1%. In Győr, alongside 35% from HMKEs and 11% from solar power from small power plants, the 54% share of landfill gas is remarkable. Biogas has similar significance in Kecskemét, representing 57% of the green energy supply alongside solar energy.
Fig. 4. Aggregate share of electricity generated from local renewable energy sources in the categories of household-scale small power plants (SSHPP) and small power plants under 0.5 MW, not subject to permitting and belonging to the non-SSHPP category, in the electric power consumption of settlements. In all settlements, as well as in the population categories under 10,000 inhabitants, between 10,000 and 100,000 inhabitants and over 100,000. Source: Edited by the author
18
Table 5: Aggregate share of electricity generated from local renewable energy sources in the categories of small-scale household power plants (SSHPP) and small power plants under 0.5 MW, not subject to permitting and belonging to the non-SSHPP category, in the electric power
consumption of settlements
absolute value and/or
settlements under 10,000 inhabitants
settlements between 10,000 – 100,000 inhabitants
settlements over 100,000 inhabitants
settlement % population (person)
settlement % population (person)
settlement % population (person)
1 Sóstófalva 558 262 1 Kerepes 47 10,473 1 Miskolc 1.68 160,325
2 Ipacsfa 534 200 2 Nagykőrös 27 23,935 2 Szeged 1.67 163,763
3 Gibárt 493 335 3 Kiskunmajsa 11 11,534 3 Debrecen 1.65 203,493
4 Galvács 391 87 4 Kistarcsa 9 12,990 4 Pécs 1.4 149,030
5 Vekerd 346 119 5 Szigetvár 8 10,558 5 Győr 1.3 124,743
6 Csanádalberti 280 468 6 Százhalombatta 8 19,228 6 Nyíregyháza 1 120,086
7 Barnag 272 142 7 Budakeszi 7 14,887 7 Kecskemét 1 110,974
8 Illocska 252 268 8 Dabas 6 17,014 8 Budapest 0.73 1,693,051
9 Tiszadorogma 234 377 9 Berettyóújfalu 5 14,989
10 Ganna 232 269 10 Hódmezővásárhely 5 45,159
11 Alsótelekes 224 140 11 Hajdúböszörmény 4 31,026
12 Kupa 204 186 12 Sárospatak 4 12,375
13 Bodrogkeresztúr 197 1,102 13 Gyula 4 30,656
14 Egyházasharaszti 168 334 14 Diósd 4 10,354
15 Somogyhatvan 167 372 15 Pomáz 4 17,889
16 Peterd 165 223 16 Hajdúszoboszló 4 23,987
17 Csörötnek 165 862 17 Bátonyterenye 4 12,525
18 Kémes 156 475 18 Kiskunhalas 4 28,532
19 Csomád 149 1,631 19 Ráckeve 4 10,392
20 Csonkamindszent 143 176 20 Békéscsaba 3 60137 21 Nógrádkövesd 142 660
22 Hejce 132 223
23 Buzsák 127 1,525
24 Pornóapáti 125 384 25 Hejőpapi 125 1,175 26 Zalaszentmihály 116 1,005
27 Csörög 112 2,148
28 Bojt 106 598
29 Nagyhuta 102 64
30 Demjén 101 613
Source: Edited by the author
19 Conclusions
In summary, it can be concluded that SSHPPs operating in 2200 of the 3155 Hungarian settlements can cover 100% of the annual electric power demands of the settlements in altogether four settlements. In ten other settlements, this ratio falls between 100% and 50%, in 118 settlements in the range of 50–10% and in 1316 settlements between 10% and 1%; in 752 settlement, the respective ratios are under 1% and in 955 settlements power plants belonging to this category still has not been installed (Table 6). The results show that in the case of settlements with fewer than 1000 inhabitants, this power plant category is potentially capable of satisfying electricity demands, which has become an achievable target for settlements with 1000 to 2000 inhabitants. In towns and cities with population between 10,000 and 100,000 inhabitants, hitting the 10% ratio can be a realistic goal in the short run, whereas in cities with over 100,000 inhabitants this power plant category can contribute to satisfying the electric power demands of cities from local renewable sources only in very small proportions despite the large number of power plants.
With nominal capacities under 0.5 MW small power plants that are not subject to permitting and do not belong to the non-SSHPP, while using renewable energies, can provide for more than 100%
of the annual electric power demands in 23 settlements, and in 19 settlements this ratio falls between 100% and 50%, in 52 settlements it is in the range of 50–10%, in 65 settlements is between 10% and 1% and in 36 settlements it is under 1%; finally, in 2960 settlements there were no such power plants installed in 2017 (Table 6). Small power plants can certainly cover the annual electric power demand of villages with fewer than 2000 inhabitants, and it does not seem to be an unachievable goal for the whole settlement category with population under 10,000 residents. In towns and cities where 10,000 to 100,000 people live, full-scale electricity self-sufficiency can be implemented in 10 to 20 years with reliance on broad energy mixes and the utilization of further significant renewable potentials. In the case of cities with more than 100,000 inhabitants, small power plants with capacities under 0.5 MW can achieve significant, double-digit ratios by exploiting the potentials that are similar to the ones in the previous settlement size category over the next few decades. Nevertheless, overall transition to renewables seems to be feasible only with large power plants.
When the electricity outputs of SSHPPs and small power plant under 0.5 MW are combined, there are 30 settlements in Hungary where power plants belonging to the two categories in question and utilizing renewable energy sources are capable of generating more than 100% of the annual electric power demands of the given settlement. In addition, they cover 100–50% of consumption in 24 settlements, 50–10% in 164 settlements, while in 1301 other settlement this ratio falls between 10% and 1%. In Hungarian 699 settlements, this share is not up to 1%, while in 937 settlements there are neither SSHPPs, nor such small power plants under 0.5 MW that would utilize renewable energy sources (Table 6). By combining the two power plant types, the electric power demands of settlements with fewer than 2000 residents can be satisfied safely, and it can be implemented in the medium term also in settlements with fewer than 10,000 inhabitants. These two power plant sizes and with them broad renewable energy portfolios have the potential to significantly accelerate the full-scale transition of towns and cities with population between 10,000 and 100,000 to renewable energy sources, and therefore the above objectives can be accomplished more safely and within shorter whiles. In the case of cities with more than 100,000 inhabitants, when the electric power demands of these settlements, the locally available renewable energy potentials and accessible supplies are taken into consideration alongside the current technologies, proper solutions can be found in the form of centralized large power plants.
20
Table 6: Individual and combined outputs of small-scale household power plants (SSHPP) and small power plants with nominal capacities under 0.5 MW, not subject to permitting, in the
electric power supply of the settlements
Number of settlements by the percentage of electric power demands supplied from locally available renewable energy sources with power generation in household-scale power plants (units):
Number of settlements by the percentage of electric power demands supplied from locally available renewable energy sources with power generation in small power plants with capacities under 0.5 MW (units):
Number of settlements by the percentage of electric power demands supplied from locally available renewable energy sources with power generation in household-scale power plants and small power plants with capacities under 0.5 MW (units):
over 100% 4 over 100% 23 over 100% 30
100–50% 10 100–50% 19 100–50% 24
50–10% 118 50–10% 52 50–10% 164
10–1% 1316 10–1% 65 10–1% 1301
under 1% 752 under 1% 36 under 1% 699
0% 955 0% 2960 0% 937
Source: Edited by the author
The spread of renewable energy sources can be effectively accelerated, yet time also delayed, by means of legislation, economic incentives, education and marketing activities for environment protection. It is well exemplified by the amendment of Act LXXXV of 2011 entering into effective on 1 January 2015 (Act. LXXXV of 2011), which substantially influenced growth values in the SSHPP segment mostly using solar energy in 2016 (MEKH, 2018). On the other hand, investments in the SSHPP category showing undoubtedly impressive growth rates have been driven by energy saving aspirations in spite of the lack of adequate regulations and feed-in price subsidies.
Energy transport to neighbouring settlements may be an option for the future, where settlements producing excess energy can supply the neighbouring settlements as microregional or district centers of renewable energy production (KULCSÁR, B. 2015).
Nevertheless, problems are posed by the current absence of adequate and sufficient capacities for the storage of electricity produced with the use of renewable sources and fed into the network, as these volumes are handled by means of distribution over the network. At the same time, a significant proportion of imported electric power, which otherwise increases Hungary’s energy dependency is balancing power purchased in periods of energy shortage.
References
Act. LXXXVI of 2007 on electricity
Act. LXXXV of 2011 on the environmental product levy
ASHOK,S. 2007. Optimised model for community-based hybrid energy system. Renewable Energy. Volume 32, Issue 7, June 2007, Pages 1155-1164.
https://doi.org/10.1016/j.renene.2006.04.008
BLOOMBERG L.P. NEW ENERGY FINANCE, 2019.
http://www.bloomberg.com/search?query=New+Energy+Finance&category=Articles BUNDESMINISTERIUM FÜR WIRTSCHAFT UND ENERGIE: ERNEUERBARE-ENERGIE-GESETZ
EEG, 2000-2017. https://www.erneuerbare-
21
energien.de/EE/Redaktion/DE/Dossier/eeg.html?cms_docId=401818 (Download:
15.05.2018.)
Decree 55/2016 (XII.21.) NFM of the Ministry of National Development on the technical requirements associated with the use of subsidies for the purchasing and operations of equipment and systems generating renewable energy (Technical Decree)
Decree 62/2016 (XII.28.) NFM of the Ministry of National Development on restrictions imposed subsidies for the generation of electricity from renewable resources and application procedures for premium subsidies (NFM Decree)
Decree 63/2016 (XII.28.) NFM of the Ministry of National Development on the detailed rules pertaining to the form of determination and payment of the monetary assets needed for the funding of operating subsidies for electricity generated from renewable energy sources (Allocation Decree)
Decree 63/2016 (XII.28.) NFM of the Ministry of National Development on the detailed rules pertaining to the form of determination and payment of the monetary assets needed for the funding of operating subsidies for electricity generated from renewable energy sources (Funding Decree)
DUIĆ,N.,M.G.CARVALHO, 2004. Increasing renewable energy sources in island energy supply: case study Porto Santo. Renewable and Sustainable Energy Reviews. Volume 8, Issue 4, August 2004, Pages 383-399. https://doi.org/10.1016/j.rser.2003.11.004
EUROPEAN RENEWABLE ENERGY COUNCIL (EREC), 2019. http://www.erec.org/
EUROPEAN RENEWABLE ENERGIES FEDERATION (EREF), 2019. http://www.eref-europe.org/
EUROSTAT, 2017. Share of electricity of renewable energy sources in gross electricity consumption, 2004-2017. https://ec.europa.eu/eurostat/statistics- explained/index.php?title=File:Share_of_electricity_from_renewable_sources_in_gross_ele ctricity_consumption,_2004-2017_(%25).png
GERMAN RENEWABLE ENERGY ASSOCIATION / BUNDESVERBAND ERNEUERBARE ENERGIE E.V.(BEE), 2019. http://www.bee-ev.de/BEE/BEE.php
GOODBODY,C.,WALSH,E.,MCDONNELL,K.P.andOWENDE,P. 2013. Regional integration of renewable energy systems in Ireland – The role of hybrid energy systems for small communities. International Journal of Electrical Power & Energy Systems. Volume 44, Issue 1, January 2013, Pages 713-720. https://doi.org/10.1016/j.ijepes.2012.08.012
GO 100% RENEWABLE ENERGY 2019. http://www.go100percent.org/cms/
Government Decree 273/2007 (X.19.) on the implementation of Act LXXXVI of 2007 on electricity
Government Decree 299/2017 (X.17.) on the feed-in tariffs and premium subsidies for electricity generated from renewable energy sources
Government Decree 389/2007 (XII.23.) on the mandatory off-take and purchasing price of electricity generated from renewable energy sources or wastes (KÁT Decree)
INSTITUTE FOR LOCAL SELF-RELIANCE (ILSR), 2019. https://ilsr.org/community-power-map/
22
INTERNATIONAL RENEWABLE ENERGY AGENCY (IRENA), 2019. https://www.irena.org/
INTERNATIONAL ENERGY AGENCY (IEA), 2019. http://www.iea.org/
HUNGARIAN CENTRAL STATISTICAL OFFICE (HCSO), 2017. Gazetteer of Hungary 1 January 2017, (Központi Statisztikai Hivatal (KSH), Magyarország közigazgatási helynévkönyve,
2017. január 1., Budapest, 2017), ISSN 1217-2952
https://www.ksh.hu/docs/hun/hnk/hnk_2017.pdf
HUNGARIAN ENERGY AND PUBLIC UTILITY REGULATORY AUTHORITY (MEKH), 2018.
Summary data of small power plants not subject to permitting, including small-scale
household power plants (2008–2017)
http://www.mekh.hu/download/7/28/60000/nem_engedelykoteles_es_hmke_beszamolo_20 08_2017.pdf
KULCSÁR, B. 2015. Implementation Opportunities of Geothermal Energy Systems in the Peripheries along the Border of Hungary and Romania, Geographica Pannonica, Volume 19, Issue 3, 88-100 (September 2015) Scopus, ISSN 0354-8724 (hard copy), ISSN 1820- 7138 (online), http://www.dgt.uns.ac.rs/pannonica/papers/volume19_3_1.pdf
KULCSÁR,B. 2018. Települési villamos energia önellátás meghatározásának módszerei. The methods of determination of settlement’s electricity self-sufficiency. International Journal of Engineering and Management Sciences (IJEMS) Vol. 3. (2018). No. 45. DOI:
10.21791/IJEMS.2018.5.1.
http://ijems.lib.unideb.hu/file/9/5bebdbc6623ea/szerzo/10.21791IJEMS.2018.5.1.pdf LI WEN LI,BIRMELE,J.SCHAICH,H.andKONOLD,W. 2013. Transitioning to Community- owned Renewable Energy: Lessons from Germany. Procedia Environmental Sciences.
Volume 17, 2013, Pages 719-728, https://doi.org/10.1016/j.proenv.2013.02.089
LOVINS,B. 1977. Energy Strategy: The road not taken? 55 Foreign affairs 65 (1976-1977) LUND,H.2006. Large-scale integration of optimal combinations of PV, wind and wawe power into the electricity supply. In: Renewable energy, Volume 31, Issue 4, April pp. 503- 515., 2006, https://doi.org /10.1016/j.renene. 2005.04.008
MAVIRHUNGARIAN INDEPENDENT TRANSMISSION OPERATOR COMPANY LTD.(MAGYAR
VILLAMOSENERGIA-IPARI ÁTVITELI RENDSZERIRÁNYÍTÓ ZRT.–MAVIR), 2017. A magyar villamosenergia- rendszer (VER) 2017.- évi statisztikai adatai. Data of the Hungarian electricity system, 2017, HU ISSN 2560-1172
https://www.mavir.hu/documents/10258/154394509/MEKH+MAVIR+VER+2017_kiadvan y_vegleges_20181116.pdf/d345fdb8-7048-4af2-9a63-1d7415bb84c9
METHODOLOGICAL CENTER FOR THE ENERGY CLUB POLICY INSTITUTE, HUNGARY, 2019.
http://www.energiaklub.hu/
MUNKÁCSY B. 2011. Erre van előre!: Egy fenntartható energiarendszer keretei Magyarországon (This is the Way Ahead – Frameworks of a Sustainable Energy System in Hungary), Vision 2040 Hungary 1.0. Szigetszentmiklós: Környezeti Nevelési Hálózat Országos Egyesület (Szigetszentmiklós: Environmental Education Network National Association), 2011, p. 155 (ISBN: 9789630820240)