International Journal of Climate Change Strategies and Management
The proportion of alternative-powered vehicles and the state of energy self-sufficiency in the Hungarian settlement
stock
Journal: International Journal of Climate Change Strategies and Management Manuscript ID Draft
Manuscript Type: Research Paper
Keywords: electromobility, motor vehicle stock, self-sufficient settlements, renewable energy, energy geography, Hungary
International Journal of Climate Change Strategies and Management
International Journal of Climate Change Strategies and Management
1 The proportion of alternative-powered vehicles and
2 the state of energy self-sufficiency in the Hungarian
3 settlement stock
4
Abstract5
Purpose - Beside the examination of electric power from renewables, this study has sought the6
answer as to what a ratio of vehicles fueled by environmentally sparing technologies represent in7
the vehicle fleets of Hungarian settlements. It has been to shed light on the self-sufficiency of8
Hungarian settlements with respect to these two segments of energy consumption.9
Design/Methodology/Approach - When looking into self-sufficiency, the focus has been on the10
ratio of locally available renewable energy sources. Which settlements have the largest numbers of11
alternative-powered vehicles, and within the vehicle fleets of the settlements where these vehicles12
represent the most significant shares. The focal point of the studies has fallen on the spatial13
distribution of electric and hybrid vehicles, as well as vehicles powered with various biofuels. The14
composition of the vehicle fleet has been examined in the light of the quantities of renewable15
energies generated in the individual settlements in order to see whether there are settlements in16
Hungary that are capable of covering the energy needs of their vehicle stocks from local sources.17
Findings - Among the Hungarian settlements, there are 30 settlements that are able to generate more18
green electricity than their annual electric power demands. One of the potential ways to utilize the19
electricity from overproduction is to charge the electric and hybrid vehicles belonging to the20
settlement, which can be used to supply energy to local transport, as well.21
Research limitation/implications - The settlements that are up to self-sufficiency still have not had22
an electric vehicle fleet that would consume the excess energy locally. On the other hand, the23
settlements that are in possession of significant quantities of electric, hybrid and biofuel-powered24
vehicles seem to be unable to satisfy the energy demanded for the operation of these vehicles with25
renewable energy produced in their own areas. Besides, these vehicle fleets account for only a26
fraction of all the vehicles registered in the settlements concerned.27
Practical implications - One of the potential ways to utilize the electricity from overproduction is28
to charge the electric and hybrid vehicles belonging to the settlement, which can be used to supply29
energy to local transport, as well.30
Social implications - The results serve as useful feedback in relation to the outcomes of the31
governmental or municipal measures, allowances and subsidies taken and provided for spreading32
environmentally friendly technologies until the end of 2017, in the energy transition process of33
Hungary's system of transportation.34
Originality/value - Determining municipal energy self-sufficiency by examining the settlement35
stock of an entire country (in the electricity and transport sectors).36
Keywords: electromobility; motor vehicle stock; self-sufficient settlements; renewable energy;37
energy geography; Hungary38
Paper type - Research paper39
1. IntroductionPage 1 of 40 International Journal of Climate Change Strategies and Management
1 2 3 4 5 6 7 8 9 10 11 12 13 14 15 16 17 18 19 20 21 22 23 24 25 26 27 28 29 30 31 32 33 34 35 36 37 38 39 40 41 42 43 44 45 46 47 48 49 50 51 52 53 54 55 56 57 58 59 60
International Journal of Climate Change Strategies and Management
40
As opposed to meeting the ever-increasing energy needs of mankind, counteracting global41
warming poses significant challenges to the energy industry. Energy transition, i.e. the shift to42
renewable energy carriers with the elimination of the use of fossil fuels, would be an impossible move43
from one moment to the other, but the increasingly pessimistic climate change forecasts work as44
drivers behind faster action. Energy transition needs to be implemented in all three consumer sectors:45
in electricity generation, heating and cooling, as well as transport alike. A significant part of these46
energy needs together with the associated detrimental effects can be attributed to settlements, and47
therefore it is evident that efforts have to be taken to produce energy locally, too.48
Fossil energy sources still dominate the Hungarian energy balance, and furthermore their49
majority is imported. Consequently, a priority should be to increase the share of locally produced50
renewable energy sources in the Hungarian energy mix. In Hungary, the process of energy transition51
saw a relatively late launch, still it has made significant achievements in the past ten years, principally52
by making electricity production carbon-neutral (Hungarian Independent Transmission Operator53
Company Ltd. (MAVIR), 2017). At the European level, however, there is a wide negative gap54
(Eurostat, 2004-2017).55
The technology offers various alternatives for placing the transport sector on renewable56
grounds. However, the tendencies witnessed so far reflect the expanding use of electric and hybrid-57
powered vehicles, and as a result their market share has been on a steady rise lately. While global58
sales were at a few thousand units in 2010, this number climbed up to 2 million units in 2018, and59
forecasts suggest further increase (Bloomberg NEF, 2019).60
The target to cover 100% of energy demands from renewable resources at the national level was61
first worded as early as in 1975, in Denmark (Sørensen, 1975), followed by further theories (Lovins,62
1976-1977) and software models worldwide (Lund, 2006). Beyond scientific theories, the first actual63
steps were taken by Iceland in 1998, where a government decision was adopted on power transition.64
The earliest aspirations to develop self-sufficient systems for settlements can be traced back to the65
enactment of the German Renewable Energy Act in 1997, which allowed for predictable returns66
(Bundesministerium für Wirtschaft und Energie: Erneuerbare-Energie-Gesetz (EEG), 2000-2017). The67
Stern Review of 2006 brought about another breakthrough in the judgment of renewables, as in68
addition to environmental and technological arguments it also credibly underpinned the compelling69
and reasonable necessity of energy transition in the economic field, too (Stern, 2006). In Hungary, the70
first computer modeling was performed at the Department of Environmental and Landscape71
Geography of Eötvös Loránd University (ELTE) (Munkácsy et al., 2011).72
In the field of conversion to zero emission transport, Norway has been the most successful nation73
so far. In 2019, the ratio of the environmentally sparing vehicle park reached 17.4% (all-electric 9.3%,74
plug-in hybrid 4.1%, hybrid 4.0%). The number of purely electric vehicles was 260,692, while the ratio75
of newly sold electric vehicles was up at 46% in a country where the population counted just a bit76
over 5 million (Andresen, 2020). By 2019, the selling value of electric and plug-in hybrid vehicles went77
up to a 50% market share. For the past 25 years, the Norwegian governments have introduced a series78
of measures to encourage the transition, which have so far produced outstanding results, and pushed79
full-scaling transition within reach by now. From 2025, only zero-emission, electric or hydrogen-80
powered vehicles can be distributed in new car sales (Norsk elbilforening, Norwegian EV policy,81
2019). With respect to electric vehicles, an important factor is that sustainable operation can be82
realized only if the electricity utilized comes from renewable energy resources. In Norway, more than83
100% of electricity demands is covered from renewables with its vast majority generated by84
hydropower, which has proved to be a good basis for the Norwegian success (Eurostat, 2017).85
It was Kadurek et al. (2009) to first focus on the connection of the consumer sectors within the86
energy self-sufficient systems of settlements; they suggest that the electric vehicle fleet of a settlement87
can be effectively used to compensate for fluctuations in the outputs of renewable energy generation88
systems, as well as to back electricity consumption in the settlement and implement a zero-emission89
transport system. Several studies have addressed the system balancing potentials that are inherent in90
electric vehicles by allowing the storage, use and feeding of the electric power that is hectically91
generated by renewable electricity systems, through smart grids Dallinger and Wietschel, 2012).Page 2 of 40 International Journal of Climate Change Strategies and Management
1 2 3 4 5 6 7 8 9 10 11 12 13 14 15 16 17 18 19 20 21 22 23 24 25 26 27 28 29 30 31 32 33 34 35 36 37 38 39 40 41 42 43 44 45 46 47 48 49 50 51 52 53 54 55 56 57 58 59 60
International Journal of Climate Change Strategies and Management
92
On the level of the settlements, one of the earliest examples was the Bavarian settlement of93
Wildpoldsried, where after the German Renewable Energy Act (EEG, 2000–2017) the municipality94
wanted to ground its entire supply of electricity, heat energy and transport energy on renewables95
with reliance on locally available resources (Rajgor, 2012). After the first successful, primarily German96
(Aller-Leine-Tal, Effelter, Alzey-Land region, Bruchsmühlbach-Miesau, Dardesheim, Groβbardorf),97
Danish (Samsø Island, Frederikshavn) and Austrian (Güssing) settlements that played a model role,98
Li Wen Li et al. 2013 dealt with the social and sociological success factors of the implementation of99
community-owned renewable energy projects through case studies in Germany (Li Wen Li et al,100
2013). The first good practices were followed by other settlements ranging from villages to large cities101
(Energie Region, Aller-Leine-Tal; Bioenergiedorf-Effelter; Alzey-Land region; 100ee Erneuerbare102
Energie Region; Güssing Renewable Energy; Dardesheim Renewable Energy Projects; FWR Energie103
Genossenschaft, Groβbardorf; Sierra Club – Ready for 100%; Sperling, 2017; Lund, 2009).104
2. Aim of the study105
The aim of the study is to determine the proportion of vehicles partly or fully operated with106
clean energy sources in the vehicle fleets of Hungarian settlements, as well as the progress of107
Hungarian settlements towards the implementation of self-sufficiency in the light of their vehicle108
stocks. Which settlements have the largest numbers of alternative-powered vehicles, and within the109
vehicle fleets of the settlements where these vehicles represent the most significant shares. The focal110
point of the studies has fallen on the spatial distribution of electric and hybrid vehicles, as well as111
vehicles powered with various biofuels. The composition of the vehicle fleet has been examined in112
the light of the quantities of renewable energies generated in the individual settlements in order to113
see whether there are settlements in Hungary that are capable of covering the energy needs of their114
vehicle stocks from local sources.115
3. Materials and Methods116
For these studies, we used the structured database of the Hungarian Central Statistical Office117
(HCSO); it was compiled by the Office at our request, according to the following parameters. The118
database includes the details of the Hungarian motor vehicle stock for the years of 2008–2017. The119
stock is differentiated by fuel types or their combinations as the sources of power, and distinguishes120
passenger cars from freight vehicles, buses, tractors, slow vehicles, and motorcycles with all these121
data broken down for the individual settlements. In 2017, there were 3155 local governments122
operating in Hungary (Hungarian Central Statistical Office (HCSO), 2017), and their scope of powers123
included the registration of motor vehicles. Therefore, each of these vehicles belonged to a specific124
Hungarian settlement. Despite the necessary movement of the vehicle stock, this method links the125
vehicles the most accurately to a given settlement, and in this context their composition with respect126
to the individual settlements can be examined. The reason for our taking the period from 2008 to 2017127
into account is that this time interval offers the most recent information available among the data128
types used in our comparative analysis. The parallel data used include the number of local129
governments registered in the territorial database of the HCSO, the respective populations and the130
above-mentioned figures in relation to vehicles in the respective settlements (Hungarian Central131
Statistical Office (HCSO), 2008-2017. The Hungarian Energy and Public Utility Regulatory Authority132
(MEKH) and the universal public utility suppliers are the source of data for the number and capacity133
of small-scale household power plants (SSHPP) and small-scale power plants with installed134
capacities under 0.5 MW (not subject to authorization or not belonging to the SSHPP category). From135
the data of small-scale power plants that utilize local renewable energy sources and can be regarded136
as the most decentralized form of power generation, the settlement’s electricity production capacity137
can be calculated.138
3.1. Methods for the calculation of the electricity production capacity139
MAVIR Hungarian Transmission System Operator Company (Magyar Villamosenergia-ipari140
Átviteli Rendszerirányító Zrt.) distinguishes the following power plant categories by the capacity of Page 3 of 40 International Journal of Climate Change Strategies and Management1 2 3 4 5 6 7 8 9 10 11 12 13 14 15 16 17 18 19 20 21 22 23 24 25 26 27 28 29 30 31 32 33 34 35 36 37 38 39 40 41 42 43 44 45 46 47 48 49 50 51 52 53 54 55 56 57 58 59 60
International Journal of Climate Change Strategies and Management
141
the power plants in the Hungarian power system. Basically, power plants under 50 MW are142
categorized as small-scale power plants and power plants of 50 MW and above as large power plants.143
Small-scale power plants with capacities between 50 and 0.5 MW, between 0.5 MW and 50 kW and144
below 50 kW are distinguished within the below-50 MW category (Kulcsár, 2020; Act CXVII of 2010).145
Our studies have considered the capacities of small household-scale power plants at and under 50146
kVA (50 kW) not subject to authorization (SSHPP), as well as small-scale power plants with installed147
electric capacities under 0.5 MW that are not subject to authorization, and do not belong to the SSHPP148
category (small-scale power plants), the establishment of which has been allowed by the Hungarian149
Electric Energy Act since 1 January 2008.150
SSHPP units are basically installed by the institutional, corporate and household segment to151
cover their own electricity needs in full or part. Electricity input and consumption is measured with152
the use of electronic, single phase meters. The generated energy is used locally, whereas any153
superfluous volume is fed into the grid. When production is suspended, the necessary electric power154
is available from the grid. The service providers make settlements based on the balance calculated155
from the total quantities of consumed and input energy as recorded by the consumption meters, as156
well as the currently valid unit prices. Since 2008, the number of HSPP units has been dynamically157
growing; they counted 29,685 at the end of 2017 with a total installed capacity of 241.4 MW. 99.41%158
of the power plants use the power of the sun, while the remaining 0.59% rely on thermal methane159
gas, diesel, natural gas, biomass, biogas, water and wind energy sources. The volume of electricity160
fed by SSHPP units into the grid in 2017 was 105,086 MWh (Government Decree 279/2017 (IX. 22))161
(Table 1).162
Table 1. Summary data of small-scale household power plants at the end of 2017 (Government163
Decree 279/2017 (IX. 22))Nominal capacities of household-scale small power plants per energy sources (kW) year other diesel natural
gas
biomass thermal methane
biogas hydro power
wind power
solar energy
total
2017 36 11 291 20 206 115 112 619 239,960 241,370
Quantity of household-scale small power plants per energy sources (units) year other diesel natural
gas
biomass thermal methane
biogas hydro power
wind power
solar energy
total
2017 1 1 20 1 26 28 14 84 29,510 29,685
Volume of energy supplied to the network by household-scale small power plants per energy sources (MWh) year other diesel natural
gas
biomass thermal methane
biogas hydro power
wind power
solar energy
total
2017 125 0 258 0 553 32 387 105 103,626 105,086
164
The number of small-scale power plants under 0.5 MW was up to 238 as of 31 December 2017165
with an aggregate installed capacity of 78.2 MW. The energy carriers concerned embrace a broad166
spectrum, including both renewable and fossil energy sources. In this category, electricity is167
generated mostly from renewables, such as solar power, wind and water, biogas, landfill gas and168
sewage gas. Though to a small extent, fossil energy carriers are also among the energy sources of169
these small-scale power plants, primarily with production from natural gas, thermal methane gas,170
other gases and petrol (Government Decree 279/2017 (IX. 22)). 71% of the power plants are solar171
power facilities, followed by biogas and hydropower plants with 14% and 10%, respectively. With172
respect to capacities, solar power plants are on the top of the ranks with 78% of the installed capacity,173
and then comes the 14% share of biogas power plants from the aggregate capacity. Hydropower (4%)174
and natural gas (3%) also have considerable shares in the energy mix.Page 4 of 40 International Journal of Climate Change Strategies and Management
1 2 3 4 5 6 7 8 9 10 11 12 13 14 15 16 17 18 19 20 21 22 23 24 25 26 27 28 29 30 31 32 33 34 35 36 37 38 39 40 41 42 43 44 45 46 47 48 49 50 51 52 53 54 55 56 57 58 59 60
International Journal of Climate Change Strategies and Management
175
Unlike SSHPP units, these power plants are mostly constructed by business operators. The176
establishment of these power plants is mostly driven by the goal of realizing business profits, with177
connection to the Mandatory Take-Off System (KÁT) effectively operated until 31 December 2016178
[29, 32, 33] of the Ministry of National Development), and thereafter, from 1 January 2017 to the179
Renewable Energy Support Scheme (METÁR) (Directive 98/70/EC; Amendment of Directive180
2009/28/EC; Directive 2015/1513; ILUC Directive; Hungarian Energy and Public Utility Regulatory181
Authority (HEA), SHARES report, 2010–2020); National Utilities, e-Mobi Elektromobility Nonprofit182
Ltd.).183
The settlement-level SSHPP unit and capacity data were made available to us by E.ON184
Energiaszolgáltató Kft., ELMÜ-ÉMÁSZ Energiaszolgáltató Zrt. and Dél-magyarországi185
Áramszolgáltató Zrt. (DÉMÁSZ) as universal suppliers operating in the territory of Hungary,186
whereas information in relation to the number and capacities of small-scale power plants under 0.5187
MW was disclosed by the Hungarian Energy and Public Utility Regulatory Authority (MEKH). The188
detailed, settlement-level electricity production data are handled by MEKH and MAVIR as business189
secret, and therefore they are not available for studying, and furthermore the production data190
measured by universal suppliers do not reflect the real electric power generation in the SSHPP units.191
The underlying reason is that in the course of production the energy used by the consumers that are192
installed before the meters does not enter the grid, and therefore it is not metered. Universal suppliers193
are in possession of data of only electricity volumes that are in fact delivered by the production194
equipment. As a result, the available data are not suitable for determining the volumes of electric195
power generated in the settlements from renewable energy sources. Therefore, information in196
relation to the electricity generated locally from renewables and settlement-level data were generated197
by calculations based on the following principles.198
To determine the level of self-sufficiency in settlements that accommodate power plants from199
the two categories, the annual volume of electricity that can be theoretically generated by the power200
plants (for solar power), and that can be determined based on the average level of utilization annually201
(for other renewable energy sources) were compared with the annual electricity consumption of the202
respective settlements in 2017 (Hungarian Regional-development and Spatial-planning Information203
System (HRSIS) 2017). Our calculations were made to see as in what proportions the studied power204
plant categories, and notably the power plants utilizing local energy resources were able to satisfy205
the electricity demands of the individual settlements.206
For solar panel systems, the settlement-level data for total capacities in 2017 were considered to207
determine the theoretical quantity of electricity produced annually. The calculations were performed208
using the Photovoltaic Geographical Information System (PVGIS) operated by the European209
Commission Joint Research Centre (Ispra, Italy) (Photovoltaic Geographical Information System210
(PVGIS), 2019). With reliance on the software, the calculations were performed for all the Hungarian211
settlements where SSHPP and/or small-scale photovoltaic power plants under 0.5 MW capacity were212
operated.213
In the case of the other renewable energy sources, their average national utilization data for 2017214
were used to determine the volume of electricity that could be theoretically generated in the215
settlements during 2017, for which purpose average utilization figures were provided by MEKH216
(Table 2). Annual utilization data were also available for solar power, but in the case of this source of217
energy PVGIS allowed more accurate calculations.218
Table 2. The average utilization rates of SSHPP units using renewable energy resources and small-219
scale power plants with installed capacities under 0.5 MW in 2017 (Hungarian Independent220
Transmission Operator Company Ltd. (MAVIR), 2017)Energy source wind power
hydropower biomass biogas landfill gas
sewage gas
solar energy Average utilization
(%)
25.9 40.9 60.1 46.5 57.1 50.9 15.2
Page 5 of 40 International Journal of Climate Change Strategies and Management
1 2 3 4 5 6 7 8 9 10 11 12 13 14 15 16 17 18 19 20 21 22 23 24 25 26 27 28 29 30 31 32 33 34 35 36 37 38 39 40 41 42 43 44 45 46 47 48 49 50 51 52 53 54 55 56 57 58 59 60
International Journal of Climate Change Strategies and Management
221
From among other energy carriers, wherever petrol, diesel, natural gas, gas and thermal222
methane gas were used in the small-scale power plants, these fossil energy sources as ones that were223
not relevant to our studies were not taken into consideration. The studies were conducted in relation224
to the areas of 3155 local governments in Hungary (Hungarian Central Statistical Office (HCSO),225
2017).226
It allowed the determination the level of self-sufficiency of the settlements with respect to227
electricity generation. Similarly, the roles of these settlements generating electric power in excess of228
their actual demands could be defined in regional electricity supply, i.e. the satisfaction of the needs229
of the neighbouring settlements by means of exporting their overproduction. In this context, the local230
renewable energy generation capacity of the settlements is known.231
3.2. Fuel types taken into consideration in the studies232
In 2017, Hungary's vehicle stock counted 4,342,447 vehicles, resulting from a steady increase233
since the three-year decline following the 2008 economic crisis. 80% of the vehicles are passenger cars,234
11% are freight vehicles, the ratio of buses is 0.5% with 1.5% for tractors, 3% for slow vehicles and235
nearly 4% for motorcycles.236
Half of the fuel types listed in the database come from purely fossil energy sources (10 fuel237
categories), mainly hydrocarbon derivatives and their combinations, such as petrol, diesel, mixed,238
liquefied petroleum gas (LPG) and compressed natural gas (CNG), LPG/petrol, CNG/diesel,239
CNG/petrol, diesel and LPG/diesel. Purely renewable energies and the combinations of renewable240
and fossil energies make up the other half of fuel types (11 fuel categories), including hybrid, electric,241
gas/vegetable oil, methanol, vegetable oil, biogas, petrol/ethanol (bioethanol – E85) and various242
hybrid combinations (Table 3):243
- HYB/E/P = hybrid/electric/petrol244
- HYB/E/P/LPG = hybrid/electric/petrol/LPG245
- HYB/E/G = hybrid/electric/gas246
- HYB/E/G/CNG = hybrid/electric/gas/CNG247
No data were available for vehicles powered with hydrogen (H2) and liquefied natural gas248
(LNG).249
For the purpose of the studies, the first group consisted of purely electric vehicles, the second250
group – by aggregating various hybrid combinations – included hybrids, and finally the third group251
– by aggregating gas/vegetable oil, methanol, vegetable oil, biogas and petrol/ethanol fuels – was252
made up of biofuel-powered vehicles.Page 6 of 40 International Journal of Climate Change Strategies and Management
1 2 3 4 5 6 7 8 9 10 11 12 13 14 15 16 17 18 19 20 21 22 23 24 25 26 27 28 29 30 31 32 33 34 35 36 37 38 39 40 41 42 43 44 45 46 47 48 49 50 51 52 53 54 55 56 57 58 59 60
International Journal of Climate Change Strategies and Management
253
Table 3. Changes in the number of vehicles in the period of 2008–2017, in Hungary.vehicle units 2008 2009 2010 2011 2012 2013 2014 2015 2016 2017
Petrol 2,644,209 2,584,932 2,533,936 2,491,458 2,461,538 2,458,558 2,454,682 2,459,602 2,484,902 2,553,338 Diesel 1,152,864 1,168,384 1,186,254 1,213,894 1,260,322 1,330,166 1,419,469 1,520,028 1,582,956 1,490,665
Hybrid 2,595 2,941 3,267 3,841 4,447 5,220 6,446 8,388 10,669 10,364
Electric 261 271 280 316 344 369 459 691 1,225 2,646
Mixed 2,569 2,594 1,220 940 761 647 490 332 206 156
Natural gas/
vegetable oil 0 0 84 140 198 207 211 209 275 269
LPG 0 0 8 10 21 20 26 32 33 33
CNG 0 0 27 72 297 573 967 1 178 1 381 1 570
LPG/petrol 0 0 3,708 9,507 17,792 21,665 23,805 25,014 26,029 26,938
CNG/gas oil 0 0 138 176 219 250 247 230 237 219
Methanol 0 0 3 10 12 17 26 43 56 47
Vegetable oil 0 0 2 3 4 6 8 11 11 6
Biogas 0 0 1 1 2 1 0 2 3 3
Petrol/ethanol 0 0 61 109 362 397 417 437 463 477
CNG/petrol 0 0 43 146 545 800 1,025 1,155 1,233 1,364
Gas oil 0 0 0 0 0 0 0 0 40,263 24,4650
HIB/E/B 0 0 0 0 0 0 0 119 1,775 9,473
HIB/E/B/LPG 0 0 0 0 0 0 0 3 7 14
HIB/E/G 0 0 0 0 0 0 0 5 46 184
HIB/E/G/CNG 0 0 0 0 0 0 0 0 1 1
LPG/gas oil 0 0 0 0 0 0 0 0 5 30
ALL VEHICLES
3,802,498
3,759,122 3,729,032 3,720,623 3,746,864 3,818,896
3,908,279
4,017,479 4,151,776
4,342,447
2008 2009 2010 2011 2012 2013 2014 2015 2016 2017
3,400,000 3,500,000 3,600,000 3,700,000 3,800,000 3,900,000 4,000,000 4,100,000 4,200,000 4,300,000 4,400,000
254
3.2. Proportion of renewable energy sources in fuels (vehicle units)255
Based on the statutory biofuel blending ratio prescribed in Act CXVII of 2010, fossil fuels are256
required to have some renewable energy content (Act CXVII of 2010; Government Decree 279/2017257
(IX. 22)). The given quantity of biofuels needs to be marketed by distributors in pure form or as258
blended into petrol or diesel fuel. Determined in the Act and its implementation decree, the259
maximum 5% ratio by volume was applied until 1 January 2020, after which – pursuant to the260
amendment of Directive 98/70/EC and Directive 2009/28/EC – the European Union’s Directive261
2015/1513 (9 September 2015) increased it to 10% by volume (Directive 98/70/EC; Amendment of262
Directive 2009/28/EC).Page 7 of 40 International Journal of Climate Change Strategies and Management
1 2 3 4 5 6 7 8 9 10 11 12 13 14 15 16 17 18 19 20 21 22 23 24 25 26 27 28 29 30 31 32 33 34 35 36 37 38 39 40 41 42 43 44 45 46 47 48 49 50 51 52 53 54 55 56 57 58 59 60
International Journal of Climate Change Strategies and Management
263
Since the effective dates of these legal regulations, the bioethanol content of 95 octane petrol was264
first set at 4.9%, and then increased to at least 6.1% on 1 January 2020, whereas the share of biodiesel265
blended with diesel fuel rose from 6.4% to 8.2%.266
In Hungary, the E85 fuel containing 85% bioethanol and 15% petrol has been marketed since267
2007. Its share within all fuels has been steadily declining since the reduction of the excise tax rate in268
2012, similarly to the number of fueling stations offering this type of fuels (Figure 1).269
A certain proportion of the electricity consumed by electric road vehicles has to be electric power270
produced from renewable energy sources, and is calculated with the use of the method determined271
in the ILUC Directive (ILUC Directive). In this context, according to the latest data from 2016, this272
ratio in Hungary is 27.46%, which is due to the electricity consumption of trolleybuses, while the273
associated statistics still have not been extended to cover electric motor vehicles.274
The use of biogas in the transport sector is in fact immeasurable, as a part of the biogas capacities275
operated in Hungary for this purpose is not serviceable. Others use the generated biogas for electric276
power production, or feed the biogas in the form of purified biomethane into the natural gas network.277
Due to the biomethane sold abroad, the volume of renewable energies fed into the network can no278
longer be recognized as domestic renewable energy use.279
The volume of energy produced from renewable energy resources and used in transport was 8.3280
PJ in 2015. Then, it increased to 8.9 PJ in 2016, which was mainly owing to the growing the use of281
electricity from renewable energy sources, as well as bioethanol and biodiesel [36] (Figure 1–2).282
283
Figure 1. Production and primary use of biofuels in Hungary during 2014–2018.284
285
Figure 2. Share of the use of energy produced from renewable energy resources in transport in286
Hungary, 2008–2018.Page 8 of 40 International Journal of Climate Change Strategies and Management
1 2 3 4 5 6 7 8 9 10 11 12 13 14 15 16 17 18 19 20 21 22 23 24 25 26 27 28 29 30 31 32 33 34 35 36 37 38 39 40 41 42 43 44 45 46 47 48 49 50 51 52 53 54 55 56 57 58 59 60
International Journal of Climate Change Strategies and Management
287
By breaking down the data at the settlement level, the numbers of vehicles in the individual288
settlements become available by fuel type alongside their ratios among the vehicles registered in the289
same settlements. Consequently, the level that a settlement concerned has achieved in the shift to290
environmentally friendly vehicles within the transport sector, i.e. its progress in energy transition can291
be determined. These data, however, reflect only conditional self-sufficiency, because some fuels and292
electricity for transport purposes are not necessary produced locally, but are brought to the293
consumers of the settlement by means of transport. Nevertheless, the results suggest which294
settlements would be able to supply their vehicle fleet with energy from local renewable sources.295
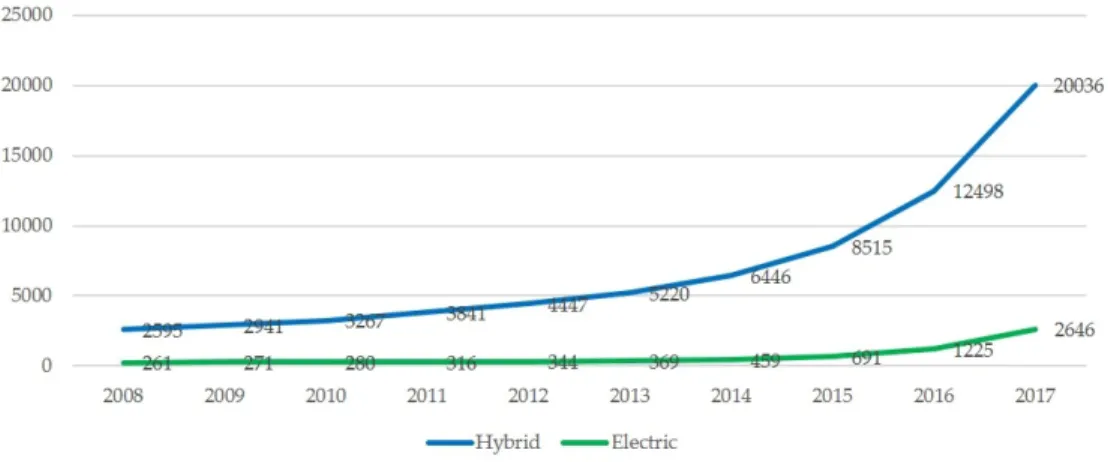
3.3. Changes in the number of alternative-powered vehicles from 2008 until 2017296
The number of hybrid vehicles increased at a moderate pace from 2008 until 2015, followed by297
a dynamic growth thereafter. From 2016 to 2017, their number nearly doubled. The stock of purely298
electric vehicles was almost negligible until 2015, but in the following two years their number299
doubled, and the trend continued into 2018 (4272 vehicles) and 2019 (7432 vehicles) alike. The reason300
for the stronger popularity of hybrid vehicles is the longer and more reliable range owing to the301
internal combustion engine installed in addition to the electric motor, as well as the more moderate302
purchase prices compared to those of purely electric vehicles. However, this price level can still be303
considered to be high under the Hungarian circumstances. Arguments in favour of electric vehicles304
include low operating costs, charging, parking and tax rebates – provided that the vehicle is a purely305
electric car carrying a green number plate or a hybrid capable of covering 25 km by purely electric306
means – and a subsidization scheme made available from the end of 2018 to support the purchasing307
of electric cars. Despite the advantages, the small volume of this vehicle stock is due to the308
consistently high prices of the vehicles, the short range and the insufficient charging capacities that309
were available at that time. The increased amount of the subsidy from June 2020, as well as the option310
to use the subsidy for purchasing lower priced models can be helpful in this situation. Furthermore,311
the country became fully traversable in the middle of 2019 with the commissioning of approximately312
330 charging stations (National Utilities, e-Mobi Elektromobility Nonprofit Ltd.). (Figure 3).313
314
Figure 3. Changes in the number of electric and hybrid vehicles between 2008 and 2017 in Hungary315
(vehicle units).316
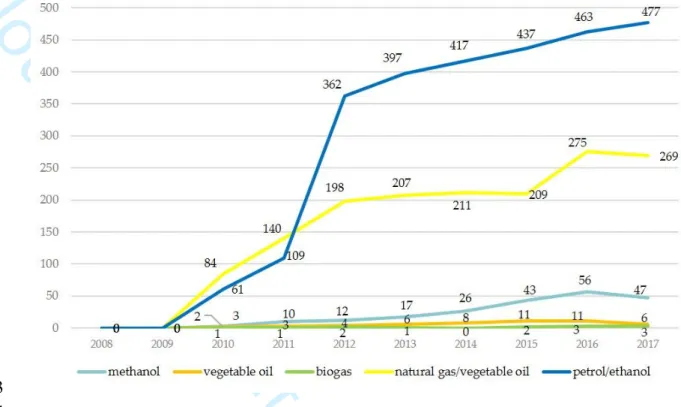
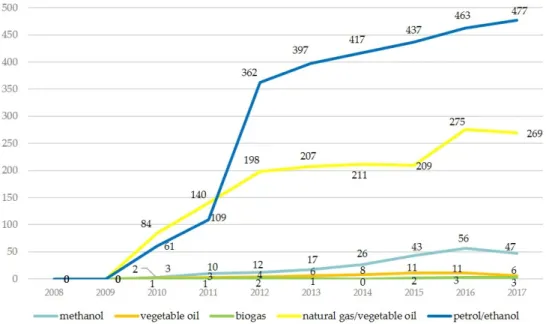
The number of vehicles running on gas/vegetable oil, methanol, vegetable oil, biogas and317
petrol/ethanol fuels is negligible within the Hungarian vehicle stock with their number reaching only318
802 by 2017. The great majority of vehicles running on methanol are passenger cars, and are319
fundamentally vehicles used for competitive sports, while those running on vegetable oil and biogas320
are so-called experimental vehicles. Concerning the five fuel combinations, significant vehicle321
numbers belong to the gas/vegetable oil and petrol/ethanol fuels (Figure 4). In general, the combined322
biofuel category does not and is unlikely to constitute a perceivable vehicle fleet in the future.Page 9 of 40 International Journal of Climate Change Strategies and Management
1 2 3 4 5 6 7 8 9 10 11 12 13 14 15 16 17 18 19 20 21 22 23 24 25 26 27 28 29 30 31 32 33 34 35 36 37 38 39 40 41 42 43 44 45 46 47 48 49 50 51 52 53 54 55 56 57 58 59 60
International Journal of Climate Change Strategies and Management
323
324
Figure 4. Changes in the number of vehicles powered by purely or partially renewable fuels in the325
period of 2008–2017 in Hungary – gas with vegetable oil, methanol, vegetable oil, biogas and326
petrol/ethanol (vehicle units).327
For any settlement, energy self-sufficiency in the transport sector can be realized if the settlement328
is able to supply the energy that is necessary for its vehicle stock from local renewable energy329
resources. In broader circles, this goal can be accomplished by serving the electric power demands of330
electric and hybrid vehicles.331
4. Results332
During the evaluation of the results, as corresponding to the three environmentally friendly333
groups of fuels, separate ranks were established based on the numbers of the purely electric, hybrid334
and biofuel-powered vehicles in the individual settlements and their proportions within the335
respective vehicle fleets.336
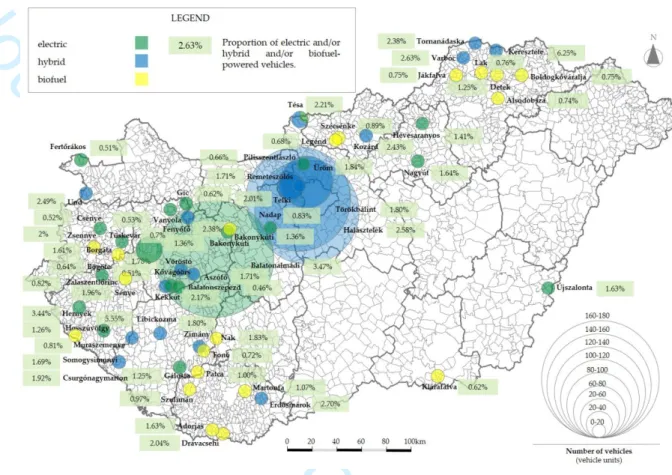
4.1. Number and proportion of electric vehicles337
In Hungary, only 2646 purely electric vehicles were operated in 2017. Most of them, i.e. some338
1273 vehicles in Budapest with other larger fleets used in the county seats and the smaller town of339
the Budapest metropolitan area. The number of these vehicles in the individual settlements ranged340
between 10 to 40. There were two settlements that contradicted the dominance of large cities; one of341
them was Balatonalmádi, where 180 electric vehicles had been registered until the end of 2017. On342
the whole, purely electric vehicles make up 3.47% of the vehicle stock of this small-sized town.343
However, these cars belong to a corporate fleet registered in the settlement. Lying in the middle of344
the Transdanubian with just over 500 inhabitants, the village of Tüskevár is in a similar situation, as345
it has a fleet of 21 electric vehicles (Table 4).346
When the number of electric vehicles belonging to the individual settlements is related to the347
number of vehicles registered in the same settlements, then Balatonalmádi, having a population of348
8640 inhabitants, is again on the top of the rank, with 3.47%, which represents the highest proportion349
of electric vehicles in a single settlement across the country. The vast majority of the top 20 settlements350
in the ranking are villages with small populations and fleets consisting of just a few vehicles, and351
therefore one or two electric vehicles represent perceivable proportions, such as in the case of352
Hernyék in Zala County (Table 4, Figure 5).Page 10 of 40 International Journal of Climate Change Strategies and Management
1 2 3 4 5 6 7 8 9 10 11 12 13 14 15 16 17 18 19 20 21 22 23 24 25 26 27 28 29 30 31 32 33 34 35 36 37 38 39 40 41 42 43 44 45 46 47 48 49 50 51 52 53 54 55 56 57 58 59 60
International Journal of Climate Change Strategies and Management
353
Table 4 shows the number and ratio of electric vehicles. Next these figures, the ratio of electricity354
produced in the settlement in local small-scale power plants from renewable energy sources. It can355
be seen that the cities and towns in the left-hand side of the table are in possession of the largest356
numbers of electric vehicles countrywide, but in terms of the proportions the given numbers of357
vehicles represent they are still not sufficient to bring about noticeable changes in self-sufficiency358
when transport in the settlements is concerned. Balatonalmádi boasts of the highest ratio, where359
2.63% of electricity consumption comes from renewable sources in addition to the 3.47% share of360
electric vehicles. From among the settlements with the largest vehicle ratios in the country as shown361
in the right side, beside Balatonalmádi Patca can boast of a 70.55% level of electric power self-362
sufficiency with a 1% share of electric vehicles. Kővágóörs is similarly outstanding with a 0.5% ratio363
of electric vehicles accompanied by 41.6% renewable electricity.364
Consequently, in 2017 none of the settlements with the largest numbers and highest proportions365
of electric vehicles was able to become energy self-sufficient in transport or electricity generation, yet.366
Patca has come the closest to generating the electric power needed for charging electric vehicles from367
renewable sources. In this settlement, after the installation of electric power generation capacities to368
cover a further 30% proportion of electricity consumption from renewable sources, excess electric369
power could be used to charge the electric vehicles of the settlement.Page 11 of 40 International Journal of Climate Change Strategies and Management
1 2 3 4 5 6 7 8 9 10 11 12 13 14 15 16 17 18 19 20 21 22 23 24 25 26 27 28 29 30 31 32 33 34 35 36 37 38 39 40 41 42 43 44 45 46 47 48 49 50 51 52 53 54 55 56 57 58 59 60
International Journal of Climate Change Strategies and Management
370
Table 4. Number and proportion of electric vehicles in the vehicle fleets of Hungarian settlements,371
as well as the proportions of electricity produced by SSHPPs and small-scale power plants under 0.5372
MW in the consumption of the settlements (2017).Number and proportion of electric vehicles in settlements
with the largest number of electric vehicles Number and proportion of electric vehicles in settlements with the highest proportion of electric vehicles
(settlement rank) SETTLEMENT Number
of electric vehicles
in total (vehicle units)
Proportion of electric vehicles
(%)
Ratio of the annual electricity demand of
the settlement covered from
renewable energy sources (%)
SETTLEMENT Number of electric vehicles
in total (vehicle units)
Proportion of electric
vehicles (%)
Ratio of the annual electricity demand of
the settlement
covered from renewable
energy sources (%)
1 Budapest 1 273 0.16 0.73 1 Balatonalmádi 180 3.47 2.63
2 Balatonalmádi 180 3.47 2.63 2 Hernyék 1 3.44 0
3 Székesfehérvár 41 0.08 0.36 3 Nagyút 3 1.64 0
4 Kecskemét 37 0.06 1.03 4 Újszalonta 1 1.63 0
5 Győr 36 0.05 1.31 5 Borgáta 1 1.61 0
6 Debrecen 35 0.04 1.65 6 Hevesaranyos 2 1.41 0
7 Érd 33 0.09 3.00 7 Bakonykúti 1 1.36 0
8 Vecsés 31 0.25 2.87 8 Hosszúvölgy 1 1.26 0
9 Miskolc 25 0.04 1.68 9 Tésa 5 1.07 0
10 Budaörs 24 0.13 2.07 10 Patca 2 1.00 70.55
11 Szeged 22 0.03 1.67 11 Nadap 7 0.83 7.28
12 Pécs 21 0.03 1.44 12 Zalaszentlőrinc 1 0.82 0
13 Tüskevár 21 0.70 0 13 Tüskevár 21 0.70 0
14 Szombathely 20 0.05 1.49 14 Pilisszentlászló 4 0.66 6.59
15 Dunakeszi 18 0.08 2.78 15 Gic 1 0.62 0.97
16 Szentendre 16 0.11 3.18 16 Vanyola 1 0.53 1.36
17 Szigetszentmiklós 16 0.08 2.09 17 Csénye 2 0.52 1.70
18 Nyíregyháza 15 0.02 1.01 18 Kővágóörs 2 0.51 41.60
19 Zalaegerszeg 14 0.04 1.73 19 Fertőrákos 6 0.51 0.46
20 Siófok 13 0.09 2.11 20 Balatonszepezd 1 0.46 3.46
373
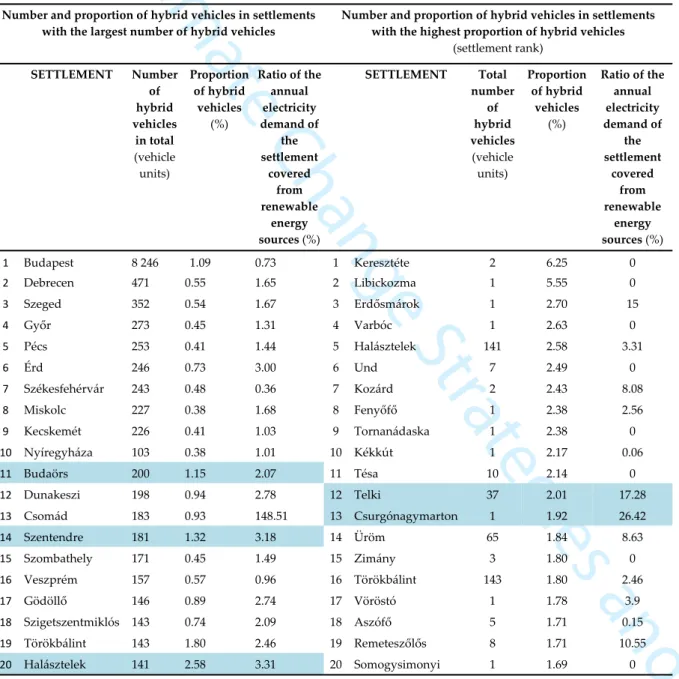
4.2. Number and proportion of hybrid vehicles374
Shown in Table 5, hybrid vehicles counted approximately 20,000 vehicle units in 2017. Almost375
half of these vehicles running on Hungarian roads are registered in Budapest. In each of the county376
seats, there are 100–500 vehicles. Large cities listed in the left column are again interspersed with the377
settlements of the Budapest metropolitan area. The underlying reason is the more favourable378
investment positions of the wealthier population living there, as they can more easily exploit the379
benefits offered with alternative-powered vehicles, and make use of the economical operating380
characteristics for commuting within a 50-km range. Out of the 20 settlements with the highest381
proportions of hybrid vehicles, Keresztéte in Borsod County tops the rank with 6.25%, followed by382
Libickozma with 5.55%. These high ratios are given by one and two vehicles, respectively. The383
situation is similar in most of the settlements included in the ranking, as one or two cars represent384
significant ratios due to the small populations. Six settlements stand out in this list; Halásztelek and385
Törökbálint boast of 141 and 143 hybrid cars, which make up 2.58% and 2.8% of the local vehicle386
fleets, respectively. The settlements of Telki and Üröm are also to be specifically mentioned with theirPage 12 of 40 International Journal of Climate Change Strategies and Management
1 2 3 4 5 6 7 8 9 10 11 12 13 14 15 16 17 18 19 20 21 22 23 24 25 26 27 28 29 30 31 32 33 34 35 36 37 38 39 40 41 42 43 44 45 46 47 48 49 50 51 52 53 54 55 56 57 58 59 60
International Journal of Climate Change Strategies and Management
387
fleets of 37 and 65 hybrid cars, respectively, which account for ratios of around 2% (Table 5, Figure388
5).389
In cities with the largest numbers of hybrid vehicles, the share of electric power from renewable390
sources tends to be small. In Budaörs, Szentendre and Halásztelek, the 1–3% hybrid shares are391
coupled with the 2–3% ratios of electricity, but these figures are far from indicating self-sufficiency.392
From among settlements with higher green electricity production, Telki has a 2% hybrid ratio and393
17% renewable electricity generation. In Csurgónagymarton, the ratio of hybrid vehicles is 2%, and394
26% of electricity comes from renewables. These settlements do produce considerable volumes of395
green electricity, but still cannot hit the watermark of self-sufficiency in spite of the fact that in their396
own areas they generate renewable electric power on the highest level in proportion of local397
consumption. As a result, none of the settlements is capable of supplying their hybrid vehicle stocks398
with local renewable energy sources (Table 5).399
Table 5. Number and proportion of hybrid vehicles in the vehicle fleets of Hungarian settlements,400
as well as the proportions of electricity produced by SSHPPs and small-scale power plants under 0.5401
MW in the consumption of the settlements (2017).Number and proportion of hybrid vehicles in settlements
with the largest number of hybrid vehicles Number and proportion of hybrid vehicles in settlements with the highest proportion of hybrid vehicles
(settlement rank) SETTLEMENT Number
of hybrid vehicles
in total (vehicle units)
Proportion of hybrid
vehicles (%)
Ratio of the annual electricity demand of
the settlement
covered from renewable
energy sources (%)
SETTLEMENT Total number
of hybrid vehicles (vehicle units)
Proportion of hybrid
vehicles (%)
Ratio of the annual electricity demand of
the settlement
covered from renewable
energy sources (%)
1 Budapest 8 246 1.09 0.73 1 Keresztéte 2 6.25 0
2 Debrecen 471 0.55 1.65 2 Libickozma 1 5.55 0
3 Szeged 352 0.54 1.67 3 Erdősmárok 1 2.70 15
4 Győr 273 0.45 1.31 4 Varbóc 1 2.63 0
5 Pécs 253 0.41 1.44 5 Halásztelek 141 2.58 3.31
6 Érd 246 0.73 3.00 6 Und 7 2.49 0
7 Székesfehérvár 243 0.48 0.36 7 Kozárd 2 2.43 8.08
8 Miskolc 227 0.38 1.68 8 Fenyőfő 1 2.38 2.56
9 Kecskemét 226 0.41 1.03 9 Tornanádaska 1 2.38 0
10 Nyíregyháza 103 0.38 1.01 10 Kékkút 1 2.17 0.06
11 Budaörs 200 1.15 2.07 11 Tésa 10 2.14 0
12 Dunakeszi 198 0.94 2.78 12 Telki 37 2.01 17.28
13 Csomád 183 0.93 148.51 13 Csurgónagymarton 1 1.92 26.42
14 Szentendre 181 1.32 3.18 14 Üröm 65 1.84 8.63
15 Szombathely 171 0.45 1.49 15 Zimány 3 1.80 0
16 Veszprém 157 0.57 0.96 16 Törökbálint 143 1.80 2.46
17 Gödöllő 146 0.89 2.74 17 Vöröstó 1 1.78 3.9
18 Szigetszentmiklós 143 0.74 2.09 18 Aszófő 5 1.71 0.15
19 Törökbálint 143 1.80 2.46 19 Remeteszőlős 8 1.71 10.55
20 Halásztelek 141 2.58 3.31 20 Somogysimonyi 1 1.69 0
402
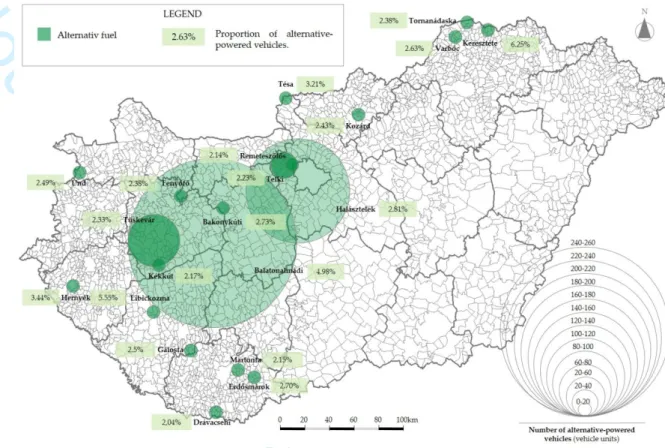
4.3. Number and proportion of biofuel-powered vehiclesPage 13 of 40 International Journal of Climate Change Strategies and Management
1 2 3 4 5 6 7 8 9 10 11 12 13 14 15 16 17 18 19 20 21 22 23 24 25 26 27 28 29 30 31 32 33 34 35 36 37 38 39 40 41 42 43 44 45 46 47 48 49 50 51 52 53 54 55 56 57 58 59 60
International Journal of Climate Change Strategies and Management
403
In 2017, the total number of vehicles running on biofuels in Hungary remained under 1000. Most404
of these vehicles, altogether some 133 cars can be found in Budapest, but they represent an invisible405
number in the city's fleet counting more than 750,000 vehicles. Even in cities where the largest406
numbers of cars powered by bioenergy are used, the number of cars fueled with methanol, biogas,407
vegetable oil and petrol/ethanol ranges between 6 and 14. All the first 20 top-ranking settlements with408
the largest rates of biofuel-powered vehicles are villages with small populations, and therefore the409
one or two registered vehicles account for 0.5–2% (Table 6, Figure 5).410
Beyond covering the annual electricity demands of the settlements the electric power generated411
from local renewables has no relevance to the operation of vehicles running on biofuel. Still, in a412
significant part of these settlements the source of electricity originating from renewable sources is413
biogas, landfill gas and sewage gas, which can potentially serve as local options for the fuel supply414
of partially or fully gas-powered vehicles. The ranking names settlements such as Győr, Miskolc,415
Debrecen, Szeged or Hódmezővásárhely, which latter one has the largest share of renewable416
electricity (Table 6, Figure 7). In Debrecen, for instance, buses serving urban transport run on417
biomethane that is produced from landfill gas and sewage gas generated in the city's landfill site and418
wastewater treatment plant by way of purification. Around half of the settlements with the highest419
proportions of biofuel-powered vehicles are capable of generating renewable electricity in their own420
areas, but none of them from energy sources that can be used for the vehicles in question. It is the421
result of the fact that with no exceptions the power plants of the 20 top-ranking settlements are solar422
power plants.Page 14 of 40 International Journal of Climate Change Strategies and Management
1 2 3 4 5 6 7 8 9 10 11 12 13 14 15 16 17 18 19 20 21 22 23 24 25 26 27 28 29 30 31 32 33 34 35 36 37 38 39 40 41 42 43 44 45 46 47 48 49 50 51 52 53 54 55 56 57 58 59 60