Ph.D. Thesis
VIRÁG ÁCS
SZENT ISTVÁN UNIVERSITY KAPOSVÁR CAMPUS
FACULTY OF AGRICULTURAL AND ENVIRONMENTAL SCIENCES
2020
SZENT ISTVÁN UNIVERSITY
FACULTY OF AGRICULTURAL AND ENVIRONMENTAL SCIENCES
Institute of Animal Science Department of Animal Sciences
Head of doctoral school:
PROF. DR. ANDRÁS SZABÓ DSc
Supervisor:
Prof. Dr. ISTVÁN NAGY DSc
Written by:
Virág Ács
POSSIBLE METHODS FOR IMPROVING MUSCLE MASS PRODUCTION IN THE PANNON LARGE AND THE PANNON WHITE
RABBIT BREEDS
KAPOSVÁR
2020
DOI: 10.17166/KE2020.010
acker-softwar acker-softwar
CONTENTS
LIST OF ABBREVIATIONS ... v
1. INTRODUCTION ... 1
2. LITERATURE REVIEW ... 3
2.1 Genetic background of muscle development ... 3
2.1.1 Postnatal muscle growth ... 3
2.1.2 Postnatal muscle composition ... 4
2.1.3 Molecular genetics serving the selection process ... 5
2.2 Production traits in rabbit breeding ... 6
2.2.1 Reproductive and growth traits ... 7
2.2.2 Genetic parameters for reproductive and growth traits ... 11
2.2.3 Carcass traits ... 12
2.2.4 Genetic parameters for carcass traits ... 14
2.3 Selection index method ... 15
2.3.1 Construction of a selection index ... 16
2.3.2 Economic selection index ... 18
2.3.3 Family selection index ... 20
2.3.4 Selection index method in rabbit breeding... 21
3. Aims of the present work: ... 27
4. MATERIALS AND METHODS ... 28
ii
4.1 Selection process of the Pannon white and the Pannon large
rabbit breeds ... 29
4.1.1. Selection process of the Pannon white ... 29
4.1.2 Selection process of the Pannon large ... 30
4.2 Desired-gain selection index in the Pannon white rabbit breed ... 30
4.2.1. Data collection ... 30
4.2.2 Animal models ... 31
4.2.3 Construction of the selection index ... 32
4.2.4 Testing the efficiency of the selection index ... 33
4.3 Desired-gain selection index for the Pannon Large breed ... 35
4.3.1 Data collection ... 35
4.3.2 Animal models ... 35
4.3.3 Selection index ... 36
4.4 Economic selection indices for the Pannon white rabbit breed36 4.4.1 Management system of the rabbitry ... 37
4.4.2 Costs, revenues, and profits ... 41
4.4.3 Marginal economic values and economic weights ... 43
4.4.4 Measured traits of the Pannon white ... 44
4.4.5 Standardised, absolute and relative economic weights ... 46
4.4.6 Base inputs for the Pannon white breed ... 48
4.4.6.3 Feeding and non-feeding costs of the rabbitry ... 53
acker-softwar acker-softwar
iii
5. RESULTS AND DISCUSSION ... 56
5.1 Desired-gain selection index in the Pannon white ... 56
5.1.1 Heritabilities, genetic correlations and standard errors ... 57
5.1.2 Consequences of changing the current selection method to the index-based selection... 58
5.2 Desired-gain selection index in the Pannon large ... 64
5.2.1 Heritabilities, genetic correlations ... 64
5.3 Results of EcoWeight Rabbit ... 67
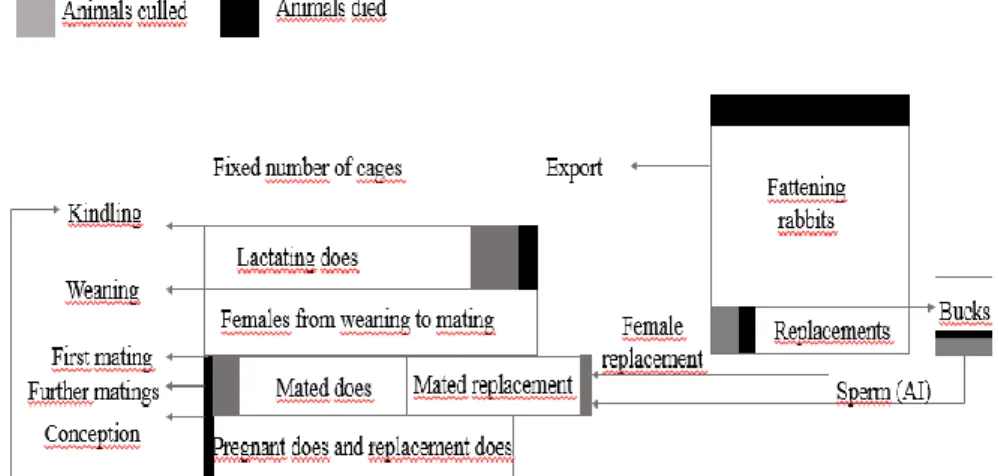
5.3.1 Structure of the doe herd ... 67
5.3.2 Costs in the rabbitry ... 74
5.3.3 Revenues in the rabbitry ... 78
5.3.4 Economic weights ... 79
6. CONCLUSIONS AND RECOMMENDATIONS ... 82
7. NEW SCIENTIFIC RESULTS ... 83
8. SUMMARY ... 84
9. ÖSSZEFOGLALÁS (SUMMARY IN HUNGARIAN)... 87
10. ACKNOWLEDGEMENTS ... 91
11. REFERENCES ... 92
12. SCIENTIFIC PAPERS AND LECTURES ON THE SUBJECT OF THE THESIS ... 110
12.1 Peer-reviewed papers published in foreign scientific journals 110
iv
12.2 Peer-reviewed papers published in Hungarian scientific
journals in English ... 110
12.3 Proceedings in French ... 110
12.4 Proceedings in Hungarian... 111
13. OTHER PUBLICATIONS ... 112
13.1 Peer-reviewed papers published in foreign scientific journals ... 112
13.2 Proceedings in Hungarian... 112
13.3 Proceedings in English ... 114
13.4 Abstracts in English ... 114
14. Curriculum Vitae ... 116
acker-softwar acker-softwar
v
LIST OF ABBREVIATIONS
ADG Average daily gain
A Additive genetic effect
abs(evst) absolute standardized economic weight for a trait
AI Artificial insemination
BLUP Best Linear Unbiased Prediction
BW Bodyweight
BrW Birth weight
CAST Calpastatin gene
CCW Chilled carcass weight
CE Common environmental effect
CT Computer Tomography
CSkW Commercial skin weight
CW Californian white
DE Digestible energy
DiFW Dissectible fat weight
DL Dorsal length
DLP Drip loss percentage
DM Double muscling
DNA Deoxyribonucleic acid
DoP Dressing out percentage
EBV Estimated breeding value
EBW Empty body weight
EGTW Empty gastrointestinal tract weight
EV Economic value
evr Relative economic weight
EW Economic weight
FCR Feed conversation ratio
FGTW Full gastrointestinal tract weight GDF Growth and differentiation factor gsd_d Genetic standard deviation for trait i.
GZ German line of Zika rabbits
HCW Hot carcass weight
hindp Percentage of the hind part in the reference carcass
HLV Hind leg muscle volume
vi
IFaW Inguinal fat weight
KiW Kidney weight
LHW Thymus, trachea, esophagus, lung and heart weight
LMV Loin muscle volume
LvW Liver weight
LW Live weight
LW21 Litter weight at 21 years of age
MEV Marginal economic value
MHC Myosin heavy chain
MI Mean of the selection index
midp Percentage of the mid part in the reference carcass
MSTN Myostatin
MW Total meat weight
MW Metabolic weight
NE Netto Energy
PE Permanent environmental effect
PFaW Perirenal fat weight
PIXEL Density range of muscle tissue QTL Quantitative trait loci
RCW Reference carcass weight
REML Restricted maximum likelihood
RI Relative importance
RR Number of reproduction cycles
SFaW Scapular fat weight
SNP Single nucleotide polymorphism
TL Thigh length
TMV Thigh muscle volume
TVAV Average value of a trait TVH Higher value of a trait
TVl Trait decreased with one unit
TW Total bone weight
valp Percentage of valuable parts in reference carcass YEARMONTH1 Year and month of kindling
YEARMONTH2 Year and month of CT measurement
acker-softwar acker-softwar
1
1. INTRODUCTION
Animal breeding concentrates to improve the quality of certain products such as the lean meat quantity of the rabbits’ carcass. Within the framework of breeding programs levels of selection pressure applied for the tissues (bone, fat, or muscle), can change the body composition (e.g. meat to bone ratio). The body size of the rabbits shows high variability from dwarf to giant. From the aspect of meat production, medium body size is preferred due to their growth rate and prolificacy. Meat quality and carcass yield of the various breeds also differ substantially.
Studies are focusing on the slaughter weight of the rabbit, measured in different breeds and age groups (Perrier and Ouhayoun, 1990; Lukefahr et al. 1982, 1983) determining the optimal slaughter age for the specific markets. The muscle tissue gives the largest part of the carcass weight regulated by ubiquitous and tissue-specific genes that can participate to expand fat and muscle tissue and thus, meat production. These genes can affect the cellular and biochemical composition of the muscle, thereby influencing not only the quality but also the quantity of the meat.
Achieving continuously improving performance through the successive generations is made possible by selection. For this reason, the whole process should not focus on the genetic merit of the current individuals but the expected merit of the next generation. To build an organized structure for the breeding process, the breeding goal has to be defined. This requires the specification of traits that can genetically improve the population. Thus, the accuracy of breeding value estimation plays an important role in the process, because it shows the amount of transmitted genetic value to the offspring.
2
Therefore, the parental generation has to contain individuals with the best breeding values (Oldenbroek et al. 2015).
Direct estimation of breeding values requires specific technical background such as DNA markering, so breeders usually have to rely on phenotypic observations that combine genetic and environmental factors and use a linear model to evaluate the genetic merit of the animals (Henderson, 1975).
For breeding value estimation BLUP method is widely used in practical animal breeding. Making meat production more intensive, rabbit breeders frequently use three-way crossbreeding schemes, and select lines for paternal and maternal traits to take advantage of positive heterosis (Baselga, 2004). Some breeding programs operate with profit models, which can help the breeder to rank the traits by the mathematical relationship of inputs and outputs (Armero and Blasco, 1992). Therefore the profit function can easily form the breeding goal because it is expressed in terms of economic values of the desired traits (ie. the expected profit per one unit increase of the trait).
acker-softwar acker-softwar
3
2. LITERATURE REVIEW
2.1 Genetic background of muscle development 2.1.1 Postnatal muscle growth
The number of muscle fibers is mainly determined by genetic factors that differ between species (Hall et al., 2004) and sexes (Seidemen and Crouse, 1986) controlled by a special biochemical regulation system. Muscle differentiation yields the largest tissue mass in the organism committing approximately ~1012 nuclei to the expression of muscle-specific genes.
Skeletal muscle involves muscle fibers from two distinct populations.
Primary myofibres provide the framework of secondary fibers and they are formed during the initial stages of myoblast (Wigmore and Evans, 2002).
The other population was firstly described by Moss and LeBlond (1971), called satellite cells, which are able to divide the myonuclei during postnatal growth. After birth, the total number of muscle fibers reported remaining unchanged in mammalian species, on the other hand, it is possible to increase the fiber number later as a result of maturation (Ontell and Kozeka 1984).
This process results the proliferation of mononucleated myogenic cells to turn multinucleated (Reznik, 1976). However, it is assumed that a subpopulation of myoblasts is not assimilating in the development of the syncytia, in turn, associates in the exterior of all developing fibers (Feldman and Stockdale, 1992). These stem cells also can make cell renewal by the Pax7, thereby ensuring the muscle, growth, and repair (Kuang et al. 2007).
Examining the satellite cell differentiation in rabbits Barjot et al. (1995) discovered that they differ according to their muscle type origin and slow- twitch and the fast-twitch originated satellite cells show different phenotypic properties. Many genetic markers can affect satellite cells, proliferating and differentiating myoblasts from distant anatomical locations.
4 2.1.2 Postnatal muscle composition
Muscle fiber type also can change during the maturation and the development of the skeletal muscle and affect meat quality. One of the major contracting proteins is the myosin heavy chain (MHC) containing a total of 11 isoforms revealing the existence of „pure” and „mixed” muscle fiber types depending on the number of the enclosed isoforms, accompanied by several proteins which can determine the functional properties (Staron and Pette, 1986). The genome includes at least 19 classes for the MHC gene superfamily comprising isogenes (Sellers et al., 1997). The phenotypic expression of these genes can be activated by thyroid hormone (Lompre et al. 1984; Izumo et al. 1986) passive stretch (Goldspink et al., 1992; Russell and Dix, 1992) and physical activity like electric stimulation (Pette and Vrbova, 1992). Besides, skeletal muscle fibers from different anatomical origins express various sets of genes adapting them to their required contractive activity. As an example, stretching and immobilizing the fast contracting tibialis anterior muscle of the rabbit results a 30% muscle growth within 4 days (Goldspink et al., 1992). Later, Yang et al. (1997) reported that IGF gene expression also has a serious impact on the muscle fiber length and the number of the sarcomeres of the rabbit.
Another regulator gene is Myostatin (MSTN), which is responsible for the regulation of muscle fiber types and sizes in the rabbit, acting as a negative regulator to muscle growth (McPherron and Lee 1997; Lee, 2004).
It is a part of TGF-β superfamily, phylogenetically classified as a growth and differentiation factor (GDF) in the GDF8 subgroup (Lee and McPherron, 1999). In pro-domain form, it can affect the mature C-terminal ligand (Massagué, 1990), antagonize its biological activity resulting increased muscle mass (Thies et al. 2001, Young et al. 2001) and eventuates fat loss even if the animal was exogenously treated with it (Lin et al. 2002; et al.
acker-softwar acker-softwar
5
2002). The double-muscling (DM) was firstly described in cattle (McPherron, 1997) resulting a serious increase in muscle fiber number, while the size remains unchanged. Thus, the amount of muscle mass thrives by almost 20% (Shahin and Berg, 1985; Wegner et al. 2000). The MSTN gene of the rabbit is composed of two introns and three exons. Kuang et al., (2014) studied the effect of MSTN to the longissimus dorsi and biceps femoris in Californian White (CW) and German great line of ZIKA (GZ) rabbits, where GZ rabbits showed less growth inhibition from MSTN which lead to 36% higher slaughter weight.
2.1.3 Molecular genetics serving the selection process Microsatellite analysis
Microsatellite markers are widely used in animal breeding. Fontanesi et al., (2008) applied DNA markers to identify the genetic variability of the growth hormone (GH) and MSTN to the production traits of rabbits. While GH showed no mutations on the sequenced regions, the polymorphism on the MSTN (C>T on intron 2) can be used as a gene marker to the production traits according to its allele distribution. Linkage and quantitative trait loci (QTL) mapping of the rabbit genome to carcass traits was described by Sternstein et al. (2015). identifying the major QTL on chromosome 7 responsible for carcass weight.
SNP markers
Single nucleotide polymorphisms (SNPs) were also detected by several authors, affecting the skeletal muscle development of the rabbit. Qiao et al.
(2014) found an SNP on the 476th locus of the 5’-regulatory region which had a significant effect on liver weight, carcass weight, and the weight of the forelegs. Fontanesi et al., (2011) found four SNPs in the MSTN gene of the rabbit, representing differences between breeds in conformation and muscle mass. Sternstein et al. (2014) reported a strong association between one, SNP
6
(c. 373+234G>A), and 9 carcass composition traits. (hot carcass weight, reference carcass weight, dressing out percentage, fore-intermediate and hind carcass weight, meat weight for the fore and intermediate part, and bone weight for the intermediate part). According to Abdel-Kafy et al. (2016) a
„G” allele of MSTN at the *194A>G SNP had positive effects on the growth performance and the carcass traits, on the other hand, did not produce any negative effects on reproduction.
SNP markers are also widely used for the genotyping of the meat quality traits. In this case, Calpastatin gene (CAST) and Myopalladin gene (MYPN) can be used (Wang et al., 2016, 2017), due to its allele frequency to the selection process. An SNP on the CAST gene (11th chromosome, g.16441502 C > T located at 67 bp in intron 3) determined the yellowness and the intramuscular fat content of the longissimus dorsi and biceps femoris muscles while a (g.18497416 G > A) was found at 229 bp in exon 13 of chromosome 18. showing strong correlations of the intramuscular fat content of the examined muscles.
CRISPR/Cas9
Genetically modified animal models are widely used in recent years.
CRISPR/Cas9 gene-editing technology generated gene-targeted animal models in sheep (Crispo et al. 2015), mice (Horii et al. 2014) and pigs (Wang et al. 2015). Rabbits were firstly used by Qingyan (2016) creating successfully MSTN KO rabbits, where skeletal muscle hypertrophy and hyperplasia along with increased body weight was observed and inherited to the F1 generation.
2.2 Production traits in rabbit breeding
To set up a breeding goal, there are several ways to get information about the population. Food production requires a combination of traits, such as health, reproduction, or welfare traits which allows adapting the
acker-softwar acker-softwar
7
technological changes more easily. Production traits, however, are more informative because they can be measured by phenotype and be a part of selection criteria.
2.2.1 Reproductive and growth traits
In rabbit breeding, probably the maternal effect has the greatest impact on the progeny performance, even for carcass traits. The morphology of the genital tract, i.e. length and capacity of the uterine horn affects the number of implanted embryos (Dziuk, 1968) but it is not necessarily enhancing litter size since intrauterine crowding results reabsorbed embryos between implantation and birth (Adams, 1960, Webel and Dziuk, 1974). To reduce these losses, Blasco et al. (2005) applied divergent selection for uterine capacity. Increasing litter size in maternal lines resulted higher mortality rates of rabbit kits coinciding with decreasing litter-heterogeneity (Bolet et al. 1996). The weakest animals (under 35g) are most likely to die of starvation during the first week (Szendrő and Barna, 1984) so birth weight (BrW) is one of the most important traits measured in rabbit breeding. Large heterogeneity of individual body weight within the litter leads to disease sensibility, thus post-natal survival rate may diminish rapidly. Falconer, (1952) reported a stabilizing selection for birth weight to prevent prompt death. Heteroscedastic models were also developed assuming that genetic factors also can modify environmental variability (San Cristobal-Gaudy et al. 1998, San Cristobal-Gaudy et al. 2001, Sorensen and Waagpetersen, 2003). Later on, Bolet et al. (2007) selected rabbit lines to evaluate within- litter homogeneity by analyzing the uterine capacity. He observed, that fetus weight and elongation significantly affected birth weigh and they also had an impact on selection efficiency. To improve pre-weaning survival, Garreau et al. (2008a) applied divergent selection on two rabbit lines and reported lower kit mortality in the homogeneous line than in the heterogeneous line.
8
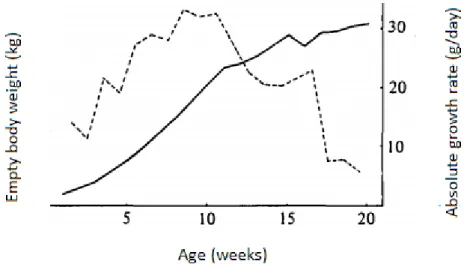
The growth rate after birth (Figure 1) follows the characteristics of a sigmoid curve, with an inflection point between the 5th and the 7th weeks of age.
Figure 1. Evolution of empty body weight with age ( ) and absolute growth rate (----). (Del Toro and Lopez, 1985)
From the 3rd week of age, milk is not enough to satisfy the high energy needs of rabbit kits so there is a break in the growth curve. Allometric coefficients of the rabbit (Table 1.) may change with age -also- numerous physiological modifications may occur.
acker-softwar acker-softwar
9
Table 1. Multiple correlation coefficients (r2) and parameters of the allometric equations (log y =α log x + log b) for the carcass (Del Toro and Lopez, 1985)
Components (y)
Period (weeks)
Intervals of empty body weights (g)
Growth ratio
r2 RSD b±sb
x = empty body weight
Carcass 1-3 136-313 1.268±0.011 0.9969 0.0114 4-20 464-2460 1.049±0.001 0.9991 0.0067
Bone 1-5 136-596 1.032±0.014 0.989 0.0267
6-20 786-2460 0.986±0.006 0.9789 0.0211
Lean 1-5 136-596 1.324±0.016 0.9916 0.0296
6-20 786-2460 1.208±0.003 0.996 0.0117 Fat (males) 1-6 136-786 0.859±0.050 0.8299 0.0853 7-20 983-2460 1.080±0.045 0.5914 0.0845 Fat (females) 1-6 136-786 0.789±0.046 0.8708 0.0733 7-20 983-2460 1.397±0.032 0.8778 0.0614
Head 1-5 136-596 0.787±0.011 0.9881 0.0212
6-20 786-2460 0.729±0.005 0.9753 0.0181 Breast and ribs 1-8 136-1179 0.955±0.004 0.9983 0.0122 9-20 1412-2460 1.334±0.008 0.9824 0.0124
Loin 1-3 136-313 1.395±0.022 0.9856 0.0414
4-20 464-2460 1.077±0.004 0.9928 0.0145 Forelegs 1-5 136-596 1.085±0.016 0.9874 0.0301 6-20 786-2460 0.967±0.004 0.9902 0.0301 Hind legs 1-5 136-596 1.395±0.022 0.9856 0.0414 6-20 786-2460 1.077±0.004 0.9928 0.0145 Abdominal
wall
1-5 136-786 1.357±0.013 0.9938 0.0298 6-20 963-2460 1.169±0.009 0.9717 0.0233 Where x is body size, y is organ size, log b is the intercept of the line on the y-axis and α is theslope of the line, also known as the allometric coefficient, RSD is the relative standard deviation
The allometric growth is an essential element for the management of animal resources butalso a tool to guide the work to the selection of animals for rapid growth. In addition, relativegrowth of different tissues determines the economic yield of the carcass. The allometric coefficients
10
are constant between 5-6 and 10-11 weeks of age, thus it is advisable to carry out measurements for selection in this period, as there are no significant physiological changes. When comparing rabbit lines or breeds, contrasts between them can be caused by age or genetic differences, thus they can be only accurately highlighted if they are measured in the same stage of maturity. Taylor et al. (1985) reported, that there are two genetic size-scaling rules in mammalian growth:
1. Treat all age and type variables for the ith genotype as directly proportional to Ai0.27
, where Ai is the mature body weight of the ith genotype 2. At every age-standardized, treat all cumulated inputs and outputs for the ith genotype as directly proportional to Ai
In commercial lines, when adult weight is not available comparisons at the same age can be used, but it has to be taken into account, that different- sized lines may have dissimilar maturity states, even at the same age (Pascual et al., 2015). Bodyweight of the growing rabbits has a wide range. Thus rabbits with the same weight are not necessarily in the same developmental stage. To determine skeletal development more precisely, body length is a more accurate assessment (Masoud et al. 1986).
Between-breed contrasts can be determined by the average daily gain (ADG). This trait is a useful tool to establish growth rates since breeds with a high growth rate can make more profit with the same maintenance costs.
Breeding programs also commonly operate with feed conversion ratio (FCR) as a selection criteria trait. Intensive rabbit farming improved FCR from 3.8 to 3.4 respectively (Gidenne et al. 2017) in the past 15 years.
FCR is defined as the ratio of feed consumed/kg weight gain of rabbit (finishing weight/weaning weight). After the age of 11 weeks, the feed efficiency of rabbits deteriorates drastically.
acker-softwar acker-softwar
11
However, in sire lines feed efficiency was not targeted by selection for a long time. The concept to add this trait to the breeding goal was firstly described by Brody (1945), who suggested to limit the feed costs by-product unit. This ratio has no biological interpretation and considering selection the relative selection pressure is unknown.
The concept of residual ingested energy was proposed: energy importation and exportation compartments are related to each other. His concept was extended by Tixier-Boichard et al. (2002) to the residual feed efficiency to select on the fraction of feed intake unexplained by maintenance requirements and production level, i.e. modifying feed efficiency without any change in the level of performance.
2.2.2 Genetic parameters for reproductive and growth traits The heritability estimates of weaning weight, slaughter weight, and average daily gain of the different breeds varied between 0.12 and 0.67. In general, body weight is considered to be highly heritable. Some authors mention dissimilar results due to large standard errors or applied models.
Besides, environmental variance greatly differs among farms and non- additive variability (maternal effects, epistasis, dominance) may take part in some estimations to modify heritability (Blasco et al. 2018). Heritability estimates for body weight (BW) at 10 weeks of age ranged from low to moderate (0.12-0.2) (Estany et al. 1992, Lukefahr et al. 1996).
In the Pannon white breed Matics et al. (2014) also reported moderate heritability for BW (0.2-0.26) and for ADG (0.3), similar to Lukefahr et al.
(1996), Gómez et al. (1998) and Baselga and García (2002). On the other hand, Moura et al. (1997) estimated higher heritabilities (0.29-0.48) for growth traits. Peiró et al. (2019) found low heritabilities for weaning weight, growth rate, and slaughter weight (0.09, 0.14 and 0.13) and positive
12
correlated response with ovulation rate. They also mentioned that selection for ovulation rate and litter size did not modify the variability of growth traits using independent culling levels. Piles et al. (2004) found lower genetic correlations between FCR and growth traits than in other species (-0.49 to - 0.47).
For growth traits, Wu et al., (2018) found a single nucleotide polymorphism (SNP) at the 9120 bp (g.9120A>C) in the 3′ untranslated region of TAS1R1 gene, showing greater body weight at 70 and 84 days of age (P<0.01 and P<0.05). Between 28 to 84 days of age (P <0.05) this SNP also pointed out higher ADG for genotype AC, than for genotype AA.
2.2.3 Carcass traits
In rabbit breeding, the quality of the carcass represents great economic value. In Europe, the rabbits’ carcass weight varies between 1-1.8 kg (differences may occur due to consumer demands), while slaughter yield is 51-66% of live weight according to Ouhayoun (1989), Dalle Zotte and Ouhayoun (1998) and Milisits et al. (2000). In 1994 the World Rabbit Science Association (WRSA) harmonized the criteria and terminology in rabbit meat research and production, where the commission set the standard measurement methods on rabbit meat and carcasses. For slaughtering data, the following parameters are measured till present:
Commercial skin weight (CSkW)
Full gastrointestinal tract weight (FGTW)
Empty gastrointestinal tract weight (EGTW)
Hot carcass weight (HCW)
Chilled carcass weight (CCW)
Drip loss percentage (DLP)
Dressing out percentage (DoP)
acker-softwar acker-softwar
13
For the prediction of carcass composition, the measured parameters are:
Total meat weight
Meat percentage
Meat to bone ratio
Total dissectible fat
Chilled carcass composition:
Liver weight (LvW)
Kidney weight (KiW)
Thymus, trachea, esophagus, lung and heart weight (LHW)
Reference carcass weight (RCW)
The characteristics of the reference carcass are:
Perirenal fat weight (PFaW)
Scapular fat weight (SFaW)
Inguinal fat weight (IFaW)
Dissectible fat weight (DiFW)
Total bone weight (TW)
Total meat weight (MW)
Linear measurements
Dorsal length (DL)
Thigh length (TL)
Lumbar Circumference (LC)
The retail cuts yield of the loin joint exposes 23-28%, (Ouhayoun, 1989), and the hind legs 27-29% of the chilled carcass (Parigi Bini et al.
1992). The meat-bone ratio of the carcass is 4.2-6.0 (Ouhayoun, 1989; Pla and Cervera 1997, Dal Bosco et al. 2000). The fatness of the chilled carcass
14
is expressed as the percentage of dissectible fat (3-6% of the reference carcass) Dalle Zotte and Ouhayoun (1998).
Rabbit breeds have short generation interval, thus meat quality and carcass traits may change rapidly. Based on consumer expectations the animals are usually slaughtered at a fixed weight, rather than at a fixed age.
In this case, carcass traits are mainly influenced by maturity and adult weight (Pla et al., 1996; Piles et al., 2000). However, selection for growth rate caused slaughtering rabbits at a lower age. Consequently, the degree of maturity of the rabbits is reduced affecting carcass and meat quality. Carcass characteristics may also be affected by sex (Cavani et al., 2000). Szendrő et al., (2012) examined the effect of age to the slaughter weight and concluded, that 74-day old rabbits were not mature enough. On the contrary, the age of 84 days was ideal for slaughter, considering the value of the loin fillet, thigh meat, and the whole carcass. The highest values were observed at the oldest age and the heaviest weight (9.1-9.31 €/ carcass for the whole and the total valuable parts of the carcass).
2.2.4 Genetic parameters for carcass traits
Estimated heritabilities for carcass traits were moderate (h2= 0.29-0.39).
(Al-Saef et al. 2008; Ferraz et al. 1992). Since estimating heritability for carcass traits requires the slaughter of many individuals the available literature is scarce.
The carcass ratio traits (e.g. meat-bone ratio, the ratio of the fore/mid/hind part to the reference carcass) had higher heritability values than the carcass composition and carcass parts. The highest heritability estimations were observed for the perirenal fat percentage; h2= 0.64-0.68 (Larzul et al. 2005; Nagy et al. 2016). For the valuable meat parts of the carcass, thigh muscle volume showed moderate heritability (Gyovai et al.
acker-softwar acker-softwar
15
2008; Gyovai et al. 2012; Nagy et al. 2010a; 2013). On the contrary, the L- value (average surface of the CT estimation of Longissimus dorsi et lumborum (LTL) muscle), showed higher heritability estimates. This parameter was also measured using an ultrasound device by Lenoir and Morien, (2016) getting similar results. For the carcass components and muscle traits, the random litter effects were low in all cases (Krogmeier et al. 1994; Gyovai et al. 2008, 2012; Nagy et al. 2010a, 2013). For the dressing out percentage due to the different slaughter ages (63 vs. 96 days), the results of different studies can only be compared with caution. Nevertheless according to a large number of studies (Krogmeier et al. 1994; Garreau et al.
2008b; Larzul et al. 2005) the heritability of this trait was moderate.
In order to obtain precise genetic correlations coefficients, a large number of rabbits should be slaughtered. However, almost all published papers reported with values together with relatively large standard errors therefore these estimates must be taken with caution.
2.3 Selection index method
Genetic improvement of animals involves several traits simultaneously thus setting up a breeding goal is not possible based on a single source of information. In the late 1930s and early 1940s Smith (1936) and Hazel (1943) were the first authors, introducing selection index theory in plant breeding, and in animal breeding, respectively. Hazel (1943) optimized various traits by their performance to select individuals in the most appropriate combination.
16 2.3.1 Construction of a selection index
The selection index is in the form of multiple regressions of breeding values of the phenotypic values as a deviation from the population mean.
Noting, that breeders have several traits to improve, the breeding values of these traits (X1, X2…Xi) have to be measured to make a proper selection index. Xi-s may come from different sources such as own performance records, performance records from ancestors (pedigree data) and performance records of descendants (progeny data), (e.g.: X1 can be an own performance data, X2 might be the average performance of the individual’s paternal half-sibs for the same trait, X3 might be the average performance of the individual’s progeny, and X4, X5, and X6 might represent the performance of the individual, half-sibs, and progeny respectively, for a correlated trait) (Kempthorne and Nordskog 1959; Smith, 1967). Applying selection indices requires the knowledge of fixed effects, variances, and covariances (phenotypic and genetic) alongside with economic values of the examined traits. The traits and the economic values are combined in the selection objective: H, Based on the parameters mentioned above, the selection index is as follows:
Selection index = b1X1 + b2X2 + …bmXm
Where the selection index is expressed in matrix notation: b’X and denoted as: I (for the selection index); b’ is the partial regression coefficient of the individual’s breeding value of each measurement. This weighting is done by finding the maximal correlation (rIA) between the index and the breeding value, leading to a set of simultaneous equations (as many as the measurements) and the solution gives the best b’ value used in the index (Pesek and Baker 1969; Casey 1970).
acker-softwar acker-softwar
17
Breeding programs operate with these selection criteria traits and also with selection objective traits. These parameters do not have to be the same, however, the number of traits in the selection criteria and the selection objective is required to be equal, thus the indexing method determines the selection index coefficients that maximize the response in the selection objective (H), with the selection index (I). Relationships between the traits and genetic/phenotypic levels are in matrix form were previously described by Kempthorne and Nordskog (1959) as follows:
P: Phenotypic variance-covariance matrix of traits in the selection index G: Genetic variance-covariance matrix between traits in the selection objective and the selection index
C: genetic variance-covariance matrix of traits in the selection objective. P and C matrices are symmetric, on the contrary, G matrix is only symmetric, when the number of traits measured is equal to the number of traits improved.
To predict the genetic merit, the derivation of selection criteria coefficients is more simple with matrix algebra. Thus, the variance of the selection index is:
𝑣𝑎𝑟(𝐼) = 𝑣𝑎𝑟(𝑏′𝑋) = 𝑏′𝑣𝑎𝑟(𝑋)𝑏 = 𝑏′𝑃𝑏 The variance of the selection objective is:
𝑣𝑎𝑟(𝐻) = 𝑣𝑎𝑟(𝑎′𝑌) = 𝑎′𝑣𝑎𝑟(𝑌)𝑎 = 𝑎′𝐶𝑎
Where: Y is a trait in the selection objective and a is the relative economic value of atrait.
The covariance of the selection criteria and the selection objective is:
𝑐𝑜𝑣(𝑏′𝑋, 𝑎′𝑌) = 𝑏′𝑐𝑜𝑣(𝑋, 𝑌)𝑎 = 𝑏′𝐺𝑎
18
With P, G matrices and the weighting factors b’, the selection criteria coefficients can be determined as the coefficients that minimize the squared difference between the selection objective and the genetic merit. Where the squared difference is:
𝜕(𝐻 − 𝐼)2
𝜕𝑏 = 2𝑃𝑏 − 2𝐺𝑎 Which, when equated to zero, results:
𝑏 = 𝑃−1𝐺𝑎
The selection index method can be separated into two types
1. Economic selection indices: Where information of traits is used to predict genetic merit for overall economic value
2. Family selection indices: Where information is combined from different types of relatives (sire, dam, offspring, etc.) to predict the genetic merit of an individual for a given trait.
2.3.2 Economic selection index
All traits in the breeding goal have economic importance, thus the breeding objective aims to maximize this economic merit. For economic indices, the additive genetic value of traits of interest forms the aggregate genotype (A).
𝐴 = 𝑣1𝑔1+ 𝑣2𝑔2+ ⋯ 𝑣𝑛𝑔𝑛
Where: gi is the additive genetic value of the ith trait, and vi is the economic weight, and A is the aggregate genotype.
Economic weights (EW) are economic values (EV) of a unit of a trait (Falconer and Mackay, 1996) and can be calculated from the profit function as the difference of cost per unit of a trait and the incomes (if the profit function is linear). However, Smith et al. (1986) characterized profit as the
acker-softwar acker-softwar
19
ratio of income/costs to calculate economic weights, while Amer and Fox (1992) derived it from marginal cost curves.
Non-linear profit functions are also used in animal breeding, and they can be computed with the Taylor series (Taylor, 1715) by linearising the profit.
Smith (1984) described the process as the profit increase done by a small improvement of the trait of interest, thus economic weights need to be recalculated after a few generations when the means of the traits are going to be different due to selection.
In economic indices, the base units for economic weights should be the same as the units forthe breeding value (eg.: body weight is expressed in kg, then economic weight should bedemonstrated in €/kg). It is worth noting, that traits of the aggregate genotype and traits in the index do not have to be the same, such as edible meat on the hind legs can be a part of the aggregate genotype due to its economic importance, but not measured because of the duration of the measurement. Wolfová and Wolf (2013) previously described strategies to calculate economic values in animal breeding, and reported, that traits in the breeding goal are not usually identical with traits in the selection criteria. Besides, EVs of traits need to be defined with complete information on assumptions used in analytical models, and details on interrelationships between traits are needed to be documented for better comparability. In animal breeding, many authors have addressed the economic index approach to selection for pigs, (Armer et al. 2014; Houška et al. 2004; Houška et al. 2010; Quinton et al. 2006; Wolfová et al. 2017), poultry (Kumar et al. 2006) dairy cattle (Wolfová, 2007) and aquaculture species (Janssen et al. 2017). However, the number of articles calculating EWs in rabbit breeding is very limited (Armero and Blasco, 1992; Prayaga
20
and Eady, 2000, Krupová et al., 2020). Re-calculation of these index weights is necessary for the changes in the industry.
2.3.3 Family selection index
For this index type, the information originates from different types of relatives, to make them more accurate estimation to the aggregate genotype.
𝐴 = 𝑔1
Where g1 is the genetic value of the trait of interest and A is the aggregate genotype.
In some cases, the economic importance of the trait is unclear (eg.: birth weight), and breeders usually interested in improving a questionable trait at the desired level. Yamada et al. (1975) created a selection index with desired gains based on the intended genetic changes from the breeder’s point of view, where the means of m traits are changed by the amount of Qj,=
1,2,…,m, and Q is the m x 1 vector of the intended genetic changes.
The selection is made by the following index:
𝐼 = 𝑏′𝑋
Where b is a weighting factor, and X is an n x 1 vector of sources of information.
The traits in the Q matrix are not necessarily the same as the traits in the index, and the genetic gains are calculated as follows:
∆𝐺∗ = 𝑖𝐼
𝜎𝐼𝐺∗′𝑅𝑏
Where: ∆𝐺∗ is a vector, consisting of ∆𝐺𝑘,𝐼,= 1,2, … 𝑚, 𝑙; G*is an n x 1 matrix of genetic covariance elements (𝜎𝐺𝑖𝑘) 𝜎𝐼.is the standard deviation of
acker-softwar acker-softwar
21
the index (b’Pb)1/2 ) and l is the selection intensity. The total changes of the examined traits after q generations of selection are:
𝑄∗= 𝑞∆𝐺∗ = 𝐺∗′𝑅𝑏
Where: R is an n x n diagonal matrix of ri, which is Wright’s coefficient of relationship between the candidate and its relatives, who provide information about X. R matrix consists of coefficient of coancestry or Wright’s inbreeding coefficient in the main diagonal, and the covariance of the additive genetic effect between two individuals.
Difficulties may occur for these desired gain indices when choosing the optimum set and level of traits in the selection objective. Thus, each trait can reach a maximum genetic gain by its relative importance (RI). However, adding desired gains for secondary important traits is not expedient (Cruz et al., 2014).
2.3.4 Selection index method in rabbit breeding
Management, nutrition, and genetic changes required to introduce the selection index method into rabbit farming. Matheron and Rouvier (1977) created a family index to increase the rate of response to litter size. Later, Estany et al. (1988) implanted a mixed-model method to the selection of dam lines. First economic weights in rabbit breeding ware described by Armero and Blasco (1992) for the main production traits and they defined profit function as follows:
PROFIT= RETURNS – COSTS
The weights -calculated below- were the partial derivates of the profit function applied to the mean value of the traits.
𝑤𝑖 = [𝜕𝑃𝑅𝑂𝐹𝐼𝑇
𝜕𝑋𝑖 ]
22
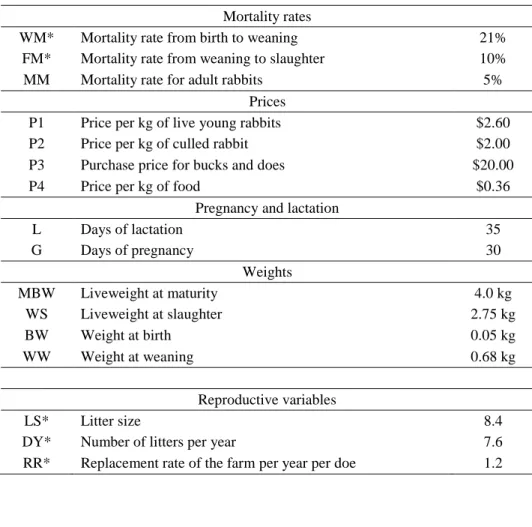
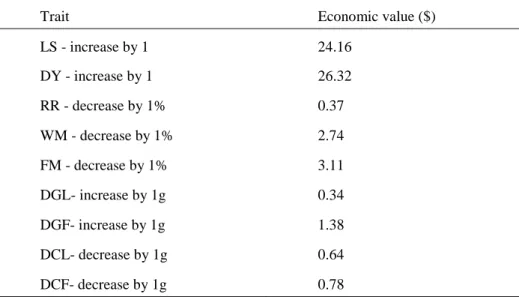
When creating the index mortalities, the number of deliveries per year, replacement rate, and body weight were taken into account. Later, Prayaga and Eady, (2000) estimated economic weights (Table 5.) for production traits in Australian rabbit breeding, where the mean values for the variables are summarized in Tables 2, 3 and 4.
acker-softwar acker-softwar
23
Table 2. Mean values of traits in rabbit meat production
Mortality rates
WM* Mortality rate from birth to weaning 21%
FM* Mortality rate from weaning to slaughter 10%
MM Mortality rate for adult rabbits 5%
Prices
P1 Price per kg of live young rabbits $2.60
P2 Price per kg of culled rabbit $2.00
P3 Purchase price for bucks and does $20.00
P4 Price per kg of food $0.36
Pregnancy and lactation
L Days of lactation 35
G Days of pregnancy 30
Weights
MBW Liveweight at maturity 4.0 kg
WS Liveweight at slaughter 2.75 kg
BW Weight at birth 0.05 kg
WW Weight at weaning 0.68 kg
Reproductive variables
LS* Litter size 8.4
DY* Number of litters per year 7.6
RR* Replacement rate of the farm per year per doe 1.2
Table 3. Mean values of feed consumption
Feed consumption
FMM Maintenance requirements of a male during its reproductive life 120g/day
44kg CREP Feed consumption of rabbits for replacement from 2-4 months 7.2 kg
PRM Maintenance requirements during pregnancy 160 g/day LRM Maintenance requirements during lactation 190 g/day ERRG Extra requirements of the doe for each gestated rabbit 5g/day ERRL Extra requirements of the doe during lactation per each kitten 25 g/day DCL* Daily consumption per kitten during lactation 10.3
g/day DCF* Daily consumption per young rabbit during the fattening period 46 g/day
24
Table 4. Mean values of health costs and other variables
Others
HC Health costs per adult rabbit per year $2.50 NM Proportion of slaughtered adult rabbits not sold 0.1
RATIO Ratio of bucks to does 1:07
FFC/MFC Female or male fixed costs per year $2.50 FC rep Fixed costs for holding the replacement stock $12.99
FCF Fixed costs at fattening per rabbit $0.01
Table 5. Economic weights per doe per year (for improvement of a unit of a trait)
Trait Economic value ($)
LS - increase by 1 24.16
DY - increase by 1 26.32
RR - decrease by 1% 0.37
WM - decrease by 1% 2.74
FM - decrease by 1% 3.11
DGL- increase by 1g 0.34
DGF- increase by 1g 1.38
DCL- decrease by 1g 0.64
DCF- decrease by 1g 0.78
The profit was calculated from the index by breeding doe per year, by estimating the returns from a doe. Later, these authors compared systems in Spain to the Australian meat production and remarked differences in slaughter weight, depending on consumer’s demands (Prayaga and Eady, 2000). The feed costs of the different countries are very diverse (10:1 for Spain and 6.5:1 for Australia) therefore it is advisable setting up the breeding objectives for the specified populations.
acker-softwar acker-softwar
25
Cartuche et al. (2014) also computed a linear profit function for production traits. The fixed costs were summarized as labor, utilities, amortization, and administration costs and divided per doe, per replacement doe and per litter weaned per year. In this study, the authors declared, that litter size and feed conversation ratio are the most important traits from the economic aspect.
Conclusions from the literature
The selection has the primary role in improving the performance of the subsequent generations. The process should always focus on the genetic merit of the future progeny yet to be born. To build an organized structure for the breeding process, the breeding goal has to be defined. This requires the specification of traits that have to be improved genetically in the population. Thus, the accuracy of breeding value estimation plays an important role in the process, because it shows the amount of transmitted genotypic value to the offspring. Therefore, the parental generation has to contain individuals with the best breeding values.
Direct estimation of breeding values requires specific technical background such as evaluation of DNA markers, which is not available or too expensive, breeders have to use phenotypic observations combining genetic and environmental factors to evaluate the genetic merit of the animals using linear models (BLUP).
In animal breeding, BLUP is a widely used procedure predicting breeding values. Making meat production more intensive, rabbit breeders frequently use three-way crossbreeding schemes, and select lines for paternal and maternal traits to take advantage of positive heterosis (Baselga, 2004). Some breeding programs operate with profit models, which can help the breeder to rank the traits by the mathematical relationship of inputs and
26
outputs (Armero and Blasco, 1992). Therefore the profit function can easily form the breeding goal because it is expressed in terms of economic values of the desired traits, so several equations can be calculated if the trait is improved by one unit, how much more profit can be expected. Other models are able to operate without the necessity of knowing precisely the economic importance of the traits in the breeding goal and focus on the desired genetic gain per generation.
acker-softwar acker-softwar
27
3. Aims of the present work:
1. Analyzing the Pannon Rabbit Breeding Program from the aspect of efficiency. The optimal selection procedure needs to be found for achieving a desired genetic gain of a trait in the breeding goal. As the breeding goal contains multiple traits, the selection procedure can be performed in two steps or using a selection index, that combines these traits.
2. Calculating aggregate genotype/desired gain index (BLUP index) for the production traits of the Pannon white and Pannon large rabbit breeds. Selection indices with desired gains are useful tools in practical animal breeding because they can predict the genetic progress of traits in the breeding goal without the necessity of calculating economic calculations.
3. Calculating economic index for the production traits of the Pannon white rabbit breed by applying the newly developed software package EcoWeight Rabbit 2.1. The last aim of this thesis is to demonstrate economic modeling for the Pannon white rabbit breed, which can spread more widely in the future in order to support rabbit farms. Traits in the selection criteria are not always identical with traits in the breeding goal.
This software package is a good solution for creating selection indices of traits that are not measured directly (such as traits measured with CT).
28
4. MATERIALS AND METHODS
The doctoral thesis contains two main chapters in connection with advanced selection decisions. First, genetic parameters and breeding values were estimated for the current selection criteria traits. Desired gain indices were then developed to improve selection efficiency. In the second part of the dissertation, a software package was used, to maximize the profit in rabbit farms by determining economic weights and to define economic indices.
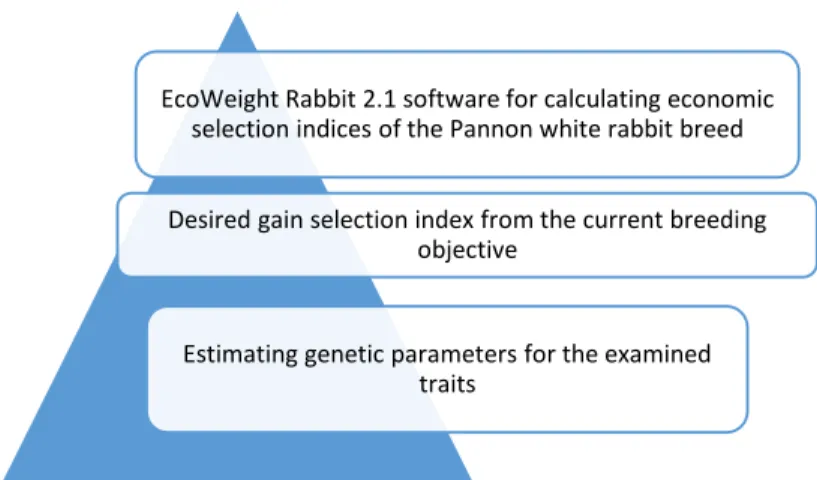
The logical order of the three parts is demonstrated in Figure 2.
Figure 2.: The logical order of studies in the thesis
EcoWeight Rabbit 2.1 software for calculating economic selection indices of the Pannon white rabbit breed
Desired gain selection index from the current breeding objective
Estimating genetic parameters for the examined traits
acker-softwar acker-softwar
29
4.1 Selection process of the Pannon white and the Pannon large rabbit breeds
4.1.1. Selection process of the Pannon white
Pannon white breed was initiated from New Zealand white and Californian white rabbits since the late 1980’s at Kaposvár University.
Selection for carcass traits based on CT evaluations began in 1992 (Szendrő et al. 1992), where L-value (the average surface of muscle longissimus dorsi between the 2nd and 3rd, and 4th and 5th lumbar vertebrae) was the first carcass trait in the breeding goal.
From 2004, L-value was replaced by TMV (thigh muscle volume), due to its bigger surface and the breeding program was completed by a reproductive trait :LW21 (litter weight at 21 days of age) in order to maintain an optimal reproduction. The selection procedure of the Pannon White breed is conducted in two consecutive steps for every kindling batch. In the first step, the expected LW21 breeding values of the growing rabbits are predicted based on the ancestors’ performances. Based on this prediction whole litters can be ranked within every population subgroup (ie. all full- sibs have the same expected breeding value). In the first step of selection from a given litter with a high LW21 breeding value generally, 1-2 males and 2-3 females are selected for the second selection step unless the parents of this litter already contributed a sufficient number of breeding animals (2 breeding males per buck and 5 breeding females per doe) to the population.
The second step of selection is performed based on the TMV breeding values following CT scans. A more detailed description of the selection procedure was given by Matics et al. (2014).
This selection process provides an opportunity to create a selection index for both selection steps.
30
To controll the rate of inbreeding, a circular mating sheme is applied for both breeds (Matics et al., 2014), where each breed is divided into 4 buck groups Females from one group are always mated with males from another group (1♀×4♂; 2♀×1♂; 3♀×2♂; 4♀×3♂).
4.1.2 Selection process of the Pannon large
Pannon large is a terminal line, basically created for an optimal paternal crossing partner. The breed was established in 2005, and its selection process also operates with two selection steps. In the first step, a phenotypic measurement takes place to calculate ADG (average daily gain) between 5 and 10 weekss of age without breeding value estimation, and HLV (hind leg muscle volume) is measured in the second step. Inserting the selection index method to the breeding program is only possible in the second selection step, where genetic evaluations are performed with BLUP method.
4.2 Desired-gain selection index in the Pannon white rabbit breed 4.2.1. Data collection
This analysis was based on the 22 002 21-day litter weight (LW21) and the 8124 thigh muscle volume (TMV) records of the Pannon White does and growing rabbits, respectively. The experimental data was collected between 1992 and 2016 at the Experimental Rabbit farm of Kaposvár University. The total number of animals in the pedigree file was 14 124.
The applied reproduction rhythm was 49 days and the generations were overlapping. To avoid a high inbreeding rate per generation a circular mating scheme was applied dividing the population into four subgroups.
This method was described in detail by Nagy et al. (2010b).
TMV data were determined at the Kaposvár University Health Center Institute of Diagnostic Imaging and Radiation Oncology. A Siemens Somatom Cardiac type multidetector CT was used to make the scans with
acker-softwar acker-softwar
31
the following settings: tube voltage: 120 kV, current: 140 mAs, data collection mode: spiral. The scanned rabbits were 11 weeks old and before scanning they were fixed with belts in a special plastic container without anesthesia. During the CT measurement, the scans were taken of the whole body and segmented with 3D Slicer’s automatic segmentation module (Fedorov et al., 2012) between the crista iliaca of the os ilium and the patella with 2 mm slice thickness. The muscle tissue was determined as the summed voxels between 0 and 140 on the HU (Hounsfield) scale of the CT scans.
4.2.2 Animal models
REML and BLUP methods were used to estimate the genetic parameters and breeding values for LW21 and TMV, and these traits were analyzed jointly using a two-trait animal model. PEST software (Neustadt, Germany) (Groeneveld, 1990) was used for data coding and the variance components were estimated with VCE 6 (Groeneveld et al. 2008). The matrix equation of the applied model was as follows:
(𝑦1
𝑦2) = (𝑥1 0 𝑥2) (𝑏1
𝑏2) + (𝑧1 0 𝑧2) (𝑎1
𝑎2) + (𝑤1 0 𝑤2) (𝑐1
𝑐2) + (𝑒1 𝑒2)
Where: yi= vector of the observations of the ith trait, bi =vector of the fixed effects of the ith trait, ai= the vector of random additive genetic effects for the ith trait, ci= vector of common litter effects for the ith trait, ei= vector of random residual effects for the ith trait. Xi, Zi, and Wi are the incidence
matrices relating to the records of the ith traits to fixed effects.
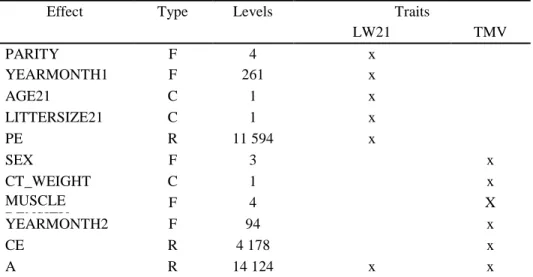
The structure of the applied model is summarized in Table 6.
32
Table 6. The structure of the applied animal model
Effect Type Levels Traits
LW21 TMV
PARITY F 4 x
YEARMONTH1 F 261 x
AGE21 C 1 x
LITTERSIZE21 C 1 x
PE R 11 594 x
SEX F 3 x
CT_WEIGHT C 1 x
MUSCLE DENSITY
F 4 X
YEARMONTH2 F 94 x
CE R 4 178 x
A R 14 124 x x
PARITY: Parity number of the doe; YEARMONTH1: Year and month of kindling; AGE21: Exact age of the kits at 21 days of measurement; LITTERSIZE21: Litter size at 21 days; PE: Permanent environmental effect; SEX: Sex of the growing rabbits; CT_WEIGHT: Bodyweight at CT measurement; MUSCLE DENSITY: Applied density ranges during 20 years of selection YEARMONTH2: Year and month of CT measurement; CE: Common environmental effect of the doe; A: Additive genetic effect
For muscle density, 4 ranges were used in the past 2 decades:
1. 10-100 HU 2. 20-200 HU 3. 40-120 HU 4. 50-130 HU
4.2.3 Construction of the selection index
To test the modification possibility of the breeding program a two-trait BLUP index (involving LW21 and TMV) was calculated using the software SEL-ACTION (Rutten and Bijma, 2001). The settings of the indexing are summarized in Table 7.
acker-softwar acker-softwar
33 Table 7. Settings of the selection index
Population size
Number of selected male parents 12
Number of selected female parents 28
Number of male selection candidates per dam 100 Number of female selection candidates per dam 40
Total selected proportion male parents 0.13 Total selected proportion male parents 0.13
Characteristics of the used groups
Full sib group 1 with 7 animals
Half-sib group 1 with 1 dam producing 8 animals Progeny group 1 with 1 dam producing 8 progeny
The contribution of each trait was set to 50%. Following the practice developed in pig breeding, the final selection index was standardized with Z transformation, where the calculated index values were subtracted by their average and divided by the standard deviation. Then the so-called Z-values were multiplied by 20 and finally, 100 was added to this product. Thus, the index means were obtained to 100 and a standard deviation of 20, in each buck group respectively.
4.2.4 Testing the efficiency of the selection index
The selection process was tested on a chosen kindling batch where the date of insemination was 29th of January 2016. At that time, the population consisted of 160 does and 60 bucks. In the kindling batch, 928 kits were born from 121 dams. Using both selection alternatives in the first step of selection 69 litters (122 individuals) were selected for CT scan (2nd step of selection) either based on either the expected breeding values of LW21 or on the calculated BLUP index scores. As the two methods resulted in different rankings, altogether 139 rabbits were sent to CT scan. Regardless of the method of the first step’s selection, after the CT scans the second step of
34
selection was accomplished based on TMV breeding values. Comparing selection methods was carried out using Welch-test due to unequal sample distribution variance, and the rank correlation coefficient was also calculated. All the mentioned statistical analyses were performed using the R-software package.
acker-softwar acker-softwar