DIVERGENT SELECTION FOR FAT INDEX IN PANNON KA RABBITS: GENETIC PARAMETERS, SELECTION RESPONSE
KASZA R.*, MATICS ZS. *, GERENCSÉR ZS. *, DONKÓ T.*
†, RADNAI I.*, SZENDRŐ ZS. *, NAGY I. *
*Faculty of Agricultural and Environmental Sciences, Kaposvár University, H-7400, Kaposvár, Guba Sándor Str. 40, Hungary.
†Medicopus Nonprofit Ltd., Guba S. Str. 40. H-7400, Kaposvár, Hungary.
Abstract: The objective of this study was to estimate the response to selection for total body fat content of rabbits measured by computer tomography (CT). A divergent selection experiment was performed using Pannon Ka rabbits, which were previously selected for number of kits born alive. The so-called zero generation consisted of 351 Pannon Ka rabbits, from which the index, total body fat volume (cm3) divided by the body weight (kg), was measured. Rabbits with low and high fat index values were selected to form the parent groups of the lean and fat lines, respectively. The lines consisted of 55-72 females and 35-47 males, depending on the line and generation. After three generations, the rabbits were evaluated by means of a single trait animal model. The fat index showed a moderate heritability estimate (0.28±0.03). The magnitude of the common litter effect was small (0.10±0.02). The breeding values averaged per generation provided slightly asymmetrical responses. Based on the results, the divergent selection was successful in confirming that CT is a very suitable method for performing selection for body composition traits.
Key Words: Divergent selection, fat index, rabbit.
INTRODUCTION
Based on current rabbit breeding programmes, the reproduction rhythm of the rabbit does is generally 42 d, which means that rabbit does spend their productive life either gestating, lactating or both. Females have to simultaneously allocate their resources to maintenance and to milk production, as well as to the developing foetuses (Garreau et al., 2017). This production system is very demanding, and consequently the annual replacement rate in rabbit does is very high (120%) Matics et al. (2014). The main causes for doe replacement are health problems, poor prolificacy or fertility and poor body condition (Garreau et al., 2017). Body condition is related to the energy balance of the does, which is positive during the first 3 wk of gestation and results in increased fat reserves. However, in the last week of gestation the energy balance is negative because of the growing foetuses and decreased feed intake of the rabbit does (Fortune-Lamothe, 2006). During lactation, although the feed intake is heavily increasing, the energy balance of the does is still negative, which is caused by milk production. A considerable amount of body fat is mobilised, especially in primiparous females, and this phenomenon is indirectly responsible for the reduced lifespan of the rabbit does (Fortune-Lamothe, 2006; Garreau et al., 2017). Changes in the body composition of rabbit does can be monitored using precise in vivo techniques such as CT (Romvári et al., 1996). Scanning the pregnant rabbit does at five different stages (at AI, days 14, 21, 28 of gestation and a few hours after kindling), Milisits et al. (1999) observed little difference during the first 14 d of pregnancy. Thereafter, a marked increase in densities was noted in the abdominal region, corresponding to water and water rich tissues, in keeping with the growth of uterine content.
From day 21 of pregnancy, decrease in fat was observed, especially in does with larger litter size (Milisits et al., 1999).
Computer tomography (CT) is useful in monitoring body composition but, more importantly, it can also be used for doi:10.4995/wrs.2020.12733
WRSA, UPV, 2003
Correspondence: I. Nagy, nagy.istvan@ke.hu. Received November 2019 - Accepted June 2020.
https://doi.org/10.4995/wrs.2020.12733
R a b b i t
S cience
selecting the rabbits for body composition traits (Szendrő et al., 1996). “Since reproductive success and reproductive lifespan are positively related to fat reserves of the rabbit does, a divergent selection experiment was performed to increase and decrease the ratio of total body fat volume (cm3) on the body weight (kg), i.e. fat index. The objective of this study was to estimate the response to the selection for fat index in rabbits measured by CT.”
MATERIALS AND METHODS
Animals and divergent selection
A divergent selection was performed over four generations —between 2014 and 2016— based on the Pannon Ka rabbit breed, which is one of the maternal rabbit breeds of the Pannon Rabbit Breeding Programme at the Kaposvár University. The development of the Pannon Ka breed commenced in 1999 and it was officially recognised as a synthetic breed in 2003. The breed has been selected for number of kits born ever since. The Pannon Ka rabbits were housed in closed buildings at the Experimental Rabbit Farm of the Kaposvár University. Two-three growing animals were housed per fattening cage and fed with commercial pellet, while water was available ad libitum. The zero generation of the divergent selection experiment was created by randomly selecting 351 Pannon Ka growing rabbits from two consecutive kindling batches in November 2013 and in January 2014, respectively. The selection trait was the so-called fat index, which is the ratio of the total body fat volume (cm3), measured in vivo on 10-wk old growing rabbits by CT, divided by the live body weight (kg). CT measurements were carried out at the Institute of Diagnostic Imaging and Radiation Oncology using Siemens Sensation Cardiac CT. The most important settings were the following: voltage 120 kV, current 140 mAs, data collection mode: spiral. Other technical details and the post processing method for CT scans were given in detail by Donkó et al. (2016). Based on the fat index of the animals forming the zero generation, rabbits with high and low fat indices formed the parent groups of the fat and lean lines.
These lines were then treated as separate lines and thereafter all matings were performed within lines.
At the beginning of the experiment, 142 male and 209 female Pannon Ka rabbits (maternal line of the Pannon Rabbit Breeding Programme) were examined by computer tomography (CT) (Table 1). Sixty-nine males and 144 females were chosen as breeding animals (Gen0). From the progenies of Gen0, male rabbits were selected at the first parity and female rabbits were selected at the second parity for future breeding animals (Gen1) (Table 1). From the progenies of Gen1, males were selected at the first and second parity and females were selected at second and third parity as future breeding animals (Gen2). The selection scheme of future breeding animals was the same for the Gen3. Due to the high cost of CT scanning, generally one male and one or two female rabbits within the normal body weight range (1.65-2.80 kg) were randomly selected from the litter mates. The numbers of scanned and selected rabbits per generation and the related descriptive statistics are presented in Table 1. Altogether, the study was based on 1663 fat index records of Pannon Ka rabbits and the pedigree file contained 2668 individuals.
Table 1: Descriptive statistics for the analysed traits.
Generations Line
Female Male
CT
scanned Fat index Selected Weighted
SD CT
scanned Fat index Selected Weighted SD
Gen0 Lean 209 75.2±20.0 72 –16.1 142 68.0±18.2 35 –22.2
Fat 72 21.6 34 17.6
Gen1 Lean 96 68.8±19.3 67 –8.93 80 69.2±18.8 40 –11.9
Fat 105 75.6±17.6 64 9.59 80 78.5±18.8 40 11.9
Gen2 Lean 180 61.5±15.5 61 –11.6 149 65.8±14.8 47 –8.3
Fat 187 75.5±16.7 61 12.9 142 78.5±17.3 47 16.9
Gen3 Lean 105 77.4±16.3 55 –8.1 112 75.0±15.9 44 –10.8
Fat 104 101±18.5 57 15.1 108 94.5±19.9 42 11.5
Weighted SD: Weighted selection differential.
Statistical analyses
Heritabilities, breeding values and genetic trends of fat indices were estimated applying best linear unbiased predictor (BLUP) and restricted maximum likelihood (REML) methods, using PEST (Groeneveld, 1990) and VCE6 software (Groeneveld et al., 2008) respectively. The fat indices of the lean and fat lines were considered as the same trait, thus a single trait animal model was applied. The structure of the model for fat index was the following:
y=Xb+Za+Wc+e (1)
where y=vector of phenotypic observations, b=vector of fixed effects, a=vector of additive genetic effects, c=vector of common litter effects, e=vector of residuals, X, Z and W are incidence matrices linking phenotypic records to parameters. Residuals were normally distributed with mean zero and they were uncorrelated. Additive effects were normally distributed with zero mean and a variance covariance structure defined by the relationship matrix. Additive, common litter effects and residual effects were uncorrelated.
The fixed effects taken into consideration were sex (males and females), line (lean and fat) and year-season respectively.
RESULTS AND DISCUSSION
Divergent selection has been applied in animal science for a long time (Falconer and Mackay, 1996). The method is popular because when applied it can quickly prove that a certain trait of interest is suitable to be modified genetically by means of selection.
The estimated heritability was moderate (0.28±0.03), while the magnitude of the common litter effect was low (0.10±0.02). Heritability estimates for fat related traits are not too frequent in the literature because, unless non- invasive techniques such as CT or total body electrical conductivity (TOBEC) are used, estimating heritability requires slaughtering animals. Different authors reported very different heritability estimates for total body fat, ranging from low (0.14-0.16) to very high (0.80) (Rouvier, 1970, Shemeis and Abdallah, 2000, Al-Saef et al. 2008) values, while for the perirenal fat weight (which characterises total body fat weight very well) Garreau et al., (2008) estimated a high heritability (0.64). For the dissectible fat percentage (sum of scapular and perirenal fat weights divided by reference carcass weight) Martínez-Álvaro et al. (2016) reported a high median estimate (0.70) and the highest posterior density interval at 95% probability was between 0.51 and 0.90. In previous studies where the Pannon White rabbit breed was measured with CT, the L-values, which is the average surface of the muscle longissimus dorsi, showed similar heritability (0.47) to that of the fat index (Nagy et al., 2006), while the volume of the thigh muscle showed lower heritabilities (0.20).
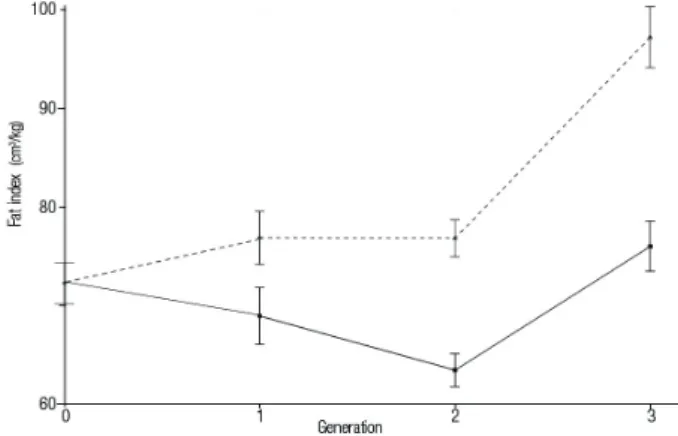
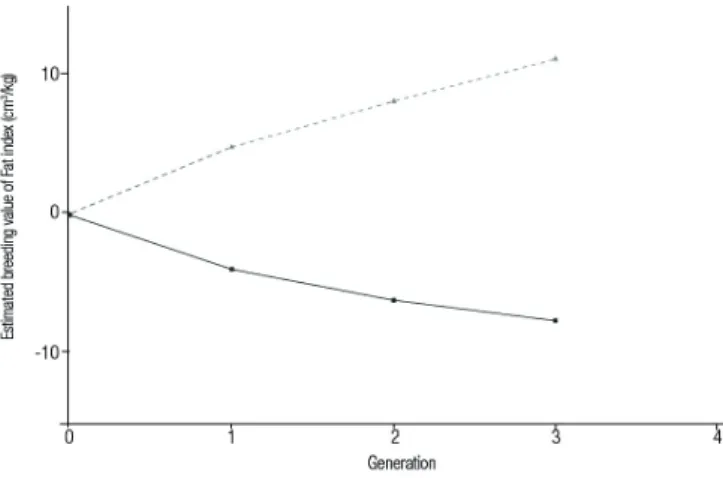
The phenotypic and genetic trends are provided in Figures 1 and 2, respectively. It can be observed that, according to both trends, the fat line showed a higher selection response than the lean line. Asymmetric selection response is
Figure 1: Phenotypic responses of fat indices in the fat and lean lines. Base: -- --; Fat: -- --; Lean: — —
often found in divergent selection experiments (Falconer and MacKay 1996). In addition to the gene frequency, other causes for asymmetric responses were summarised by Falconer and Mackay (1996), but unfortunately in most cases the exact cause cannot be identified. The females had on average 2.1 cm3/kg higher fat index than that of the males, while year-season effects were highly variable, showing a maximum difference of 17.8 cm3/kg between the best and worst year-season. When the seasonal and sex effects were removed, the estimated breeding values (averaged per generation) gave a much smoother trend. The genetic improvement achieved during this study roughly corresponded to the additive genetic standard deviation (9.6 cm3/kg) of the evaluated dataset (Figure 2), but it can be seen that the fat line showed greater improvement than that of the lean line. These results were corroborated by the findings of Martínez-Álvaro et al. (2016), who also reported asymmetric genetic trends for dissectible fat of rabbits (performing a divergent selection experiment for intramuscular fat). As proposed by Zomeño et al. (2013), a difference between the plus and minus lines can be considered as relevant if it reaches 33-50% of the standard variation. Therefore, it can be concluded that the present study provided relevant differences between the fat and lean lines. Using CT with Pannon White rabbits, Szendrő et al. (1996, 2012) conducted two divergent selection experiments for the L-value and for the thigh muscle volume. By the end of the second generation, the differences between the plus and minus rabbits were 5% and 9% respectively, confirming that CT is a very suitable method for performing selection for body composition traits.
CONCLUSIONS
The divergent selection experiment aiming to develop a fat and lean rabbit line was successful. The responses were asymmetric, the fat line showed slightly more progress than the lean line. Further studies are required in order to evaluate correlated responses (growth, reproductive performance and longevity).
Acknowledgements: The publication is supported by the EFOP-3.6.3-VEKOP-16-2017-00008 project. The project is co-financed by the European Union and the European Social Fund and the János Bolyai Research Scholarship of the Hungarian Academy of Sciences (BO/00871/19).
REFERENCES
Al-Saef A.M., Khalil M.H., Al-Dobaib S.N., Al-Homidan A.H., García M.L., Baselga M. 2008. Comparing Saudi synthetic lines of rabbits with the founder breeds for carcass, lean composition and meat quality traits. Livest. Res. Rural Dev., 20: 1-12.
Donkó T., Czakó B., Kovács Gy., Petneházy Ö., Kasza R., Szendrő Zs., Garamvölgyi R., Matics Zs. 2016. Total body fat content determination by means of computed tomography (CT) in rabbits. In: Proceedings of the 11th World Rabbit Congress, 16-18 June 2016, Qingdao, China, pp. 753-756.
Figure 2: Genetic responses of fat indices in the fat and lean lines. Fat: -- --; Lean: — —
Fortun-Lamothe L. 2006. Energy balance and reproductive performance in rabbit does. Anim. Reprod. Sci., 93: 1-15.
https://doi.org/10.1016/j.anireprosci.2005.06.009 Garreau H., Eady S.J., Hurtaud J., Legarra A. 2008. Genetic
parameters of production traits and resistance to digestive disorders in a commercial rabbit population. In: Xiccato G., Trocino A., Lukefahr S. (eds.) In Proc.: 9th World Rabbit Congress. Fondazione Iniziative Zooprofilattiche e Zootechniche, Verona, Italy, pp. 103-108.
Falconer D.S., Mackay T.F.C. 1996. Introduction to Quantitative Genetics. 4th Ed. Longman, London, UK. 1-464.
Garreau H., Larzul C., Tudela F., Ruesche J., Ducqrocq V., Fortun- Lamothe L. 2017. Energy balance and body reserves in rabbit females selected for longevity. World Rabbit Sci., 25:
205-213. https://doi.org/10.4995/wrs.2017.5216 Groeneveld E. 1990. PEST Users’ Manual. Institute of Animal
Husbandry and Animal Behaviour Federal Research Centre, Neustadt, Germany 1-61.
Groeneveld E., Kovac M., Mielenz N. 2008. VCE User’s Guide and Reference manual. Version 6.0. Institute of Farm Animal Genetics, Neustadt, Germany, 1-125.
Larzul C., de Rochambeau H. 2005. Selection for residual feed consumption in the rabbit. Livest. Prod. Sci., 95: 67-72.
https://doi.org/10.1016/j.livprodsci.2004.12.007
Larzul C., Gondret F., Combes S., de Rochambeau H. 2005.
Divergent selection on 63-day body weight in the rabbit:
response on growth, carcass and muscle traits. Genet. Sel.
Evol., 37: 105-122. https://doi.org/10.1051/gse:2004038 Martínez-Álvaro M., Hernández P., Blasco A. 2016. Divergent
selection on intramuscular fat in rabbits: Responses to selection and genetic parameters. J. Anim. Sci., 94:
4993-5003. https://doi.org/10.2527/jas.2016-0590 Matics Zs., Nagy I., Gerencsér Zs., Radnai I., Gyovai P., Donkó T.,
Dalle Zotte A., Curik I., Szendrő Zs. 2014. Pannon breeding program in rabbit at Kaposvár University. World Rabbit Sci., 22: 287-300. https://doi.org/10.4995/wrs.2014.1511
Milisits G., Romvári R., Dalle Zotte A., Szendrő Zs.
1999. Non-invasive study of changes in body composition in rabbits during pregnancy using X-ray computerized tomography. Ann. Zootech., 48: 25-34.
https://doi.org/10.1051/animres:19990103
Nagy I., Ibáñez N., Mekkawy W., Metzger Sz., Horn P., Szendrő Zs. 2006. Genetic parameters of growth and in vivo computerized tomography based carcass traits in Pannon White rabbits. Livest. Sci., 104: 46-52.
https://doi.org/10.1016/j.livsci.2006.03.009
Romvári R., Milisits G., Szendrő Zs., Sørensen P. 1996. Non invasive method to study the body composition of rabbits by X-ray computerized tomography. World Rabbit Sci., 4:
219-224. https://doi.org/10.4995/wrs.1996.298
Rouvier R. 1970. Variabilité génétique du rendement a l’abattage et de la composition anatomique de lapins de trois races. Ann Genet. Sel. Anim., 2: 325-346.
https://doi.org/10.1186/1297-9686-2-3-325
Shemeis A., Abdallah O.Y. 2000. Possibilities of developing favourable body fat partition via selection indexes – application on rabbits. Arch. Anim. Breed., 43: 193-202.
https://doi.org/10.5194/aab-43-193-2000
Szendrő Zs., Romvári R., Horn P., Radnai I., Bíró-Németh E., Milisits G. 1996. Two-way selection for carcass traits by computerised tomography. In: Proc. 6th World Rabbit Congress, Toulouse, 2, 371-375.
Szendrő Zs., Metzger Sz., Nagy I., Szabó A., Petrási Zs., Donkó T., Horn P. 2012. Effect of divergent selection for the computer tomography measured thigh muscle volume on productive and carcass traits of growing rabbits. Livest. Sci., 149: 167-172.
https://doi.org/10.1016/j.livsci.2012.07.011
Zomeño C., Hernández P., Blasco A. 2013. Divergent selection for intramuscular fat content in rabbits. 1. Direct response to selection. J. Anim. Sci., 91: 4526-4531.
https://doi.org/10.2527/jas.2013-6361