DOCTORAL (PhD) DISSERTATION
NGUYEN THAO NGUYEN
KAPOSVAR
DOI: 10.17166/KE2017.002
DOCTORAL (PhD) DISSERTATION
KAPOSVÁR UNIVERSITY
FACULTY OF AGRICULTURAL AND ENVIRONMENTAL SCIENCES Department of Animal Genetics and Biotechnology
Head of Doctoral School Prof. Dr. MELINDA KOVÁCS
Correspondent Member of the Hungarian Academy of Sciences
Supervisors
Dr. habil. ISTVÁN NAGY Senior researcher Prof. Dr. INO CURIK
Full professor
ESTIMATION AND UTILISATION OF DOMINANCE EFFECTS IN RABBIT POPULATIONS
Written by
NGUYEN THAO NGUYEN
Kaposvár 2017
1. Content
1. Content ... 1
2. Introduction ... 8
3. Literature review ……….13
3.1 A brief history ... 14
3.2 Definition ... 15
3.3 Genetic parameters ... 15
3.3.1 Cattle ... 15
3.3.2 Pigs and rabbits ... 21
3.3.3 Poultry and fish ... 26
3.4 Conclusion from the literature... 30
4. Aims of study ... 31
5. Material and methods ... 33
5.1. Data information ... 34
5.2. Molecular analyses ... 35
5.2.1. Sampling for molecular analysis ... 35
5.2.2 Molecular analysis ... 35
5.2.3. Maternal pedigree verification ... 36
5.3 Models ... 36
5.3.1 Additive models with cytoplasmic and mtDNA haplotype effects and the fit of the models ... 36
5.3.2 Additive models without cytoplasmic and mtDNA haplotype effects and the fit of the models ... 38
5.3.3 Non-additive models... 39
5.4. Genetic trends ... 39
5.5. Stability of breeding values ... 40
6. Results and discussion ... 41
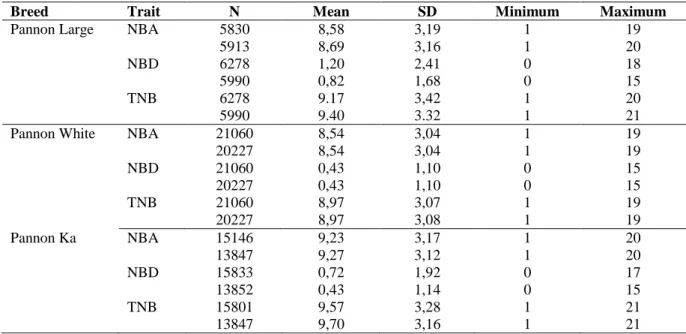
6.1 Descriptive statistics ... 42
6.2 D-loop mtDNA diversity ... 45
6.3 Models ... 47
6.3.1 Additive models with cytoplasmic and mtDNA haplotype effects and the fit of the models ... 47
6.3.2 Additive models without cytoplasmic and mtDNA haplotype effects and the fit of the models ... 52
6.3.2.1 Pannon Large breed ... 52
6.3.2.2 Pannon White breed ... 55
6.3.2.3 Pannon Ka breed ... 58
6.3.3 Non-additive models... 60
6.3.3.1 Pannon Large breed ... 60
6.3.3.2 Pannon White breed ... 63
6.3.3.3 Pannon Ka breed ... 65
6.4 Genetic trends ... 67
6.4.1 Pannon Large breed ... 67
6.4.1.1 Genetic trends of additive effects models ... 67
6.4.1.2 Genetic trends of non-additive effects models... 68
6.4.2 Pannon White breed ... 68
6.4.2.1 Genetic trends of additive effects models ... 68
6.4.2.2 Genetic trends of non-additive effects models... 69
6.4.3 Pannon Ka breed ... 69
6.4.3.1 Genetic trends of additive effects models ... 69
6.4.3.2 Genetic trends of non-additive effects models... 70
6.5 Stability of breeding values ... 70
6.5.1 Pannon Large breed ... 70
6.5.2 Pannon White breed ... 71
6.5.3 Pannon Ka breed ... 71
7. Conclusions and suggestions ... 72
9. Summary ... 77
10. Összefoglalás ... 80
11. Acknowledgement ... 83
12. References ... 85
13. Publications on the subject of the dissertation ... 96
14. Publications not related to the dissertation ... 98
15. Curriculum vitae ... 100
16. Abbreviations ... 102
17. Annex ... 104
Content of the figure
Figure 1. The phenotypic mean of NBA in the subsequent months in Pannon rabbits…… 42
Figure 2. The phenotypic mean of NBD in the subsequent months in Pannon rabbits…… 42
Figure 3. The phenotypic mean of TNB in the subsequent months in Pannon rabbits…… 43
Figure 4. The phenotypic mean of NBA in the subsequent years in Pannon rabbits……… 43
Figure 5. The phenotypic mean of NBD in the subsequent years in Pannon rabbits……… 43
Figure 6. The phenotypic mean of TNB in the subsequent years in Pannon rabbits……… 44
Figure 7. The phenotypic mean of NBA in the subsequent parities in Pannon rabbits…… 44
Figure 8. The phenotypic mean of NBD in the subsequent parities in Pannon rabbits…… 44
Figure 9. The phenotypic mean of TNB in the subsequent parities in Pannon rabbits…… 45
Figure 10. Median-joining network diagram showing phylogenetic positions of haplotypes found in Pannon Ka, Pannon Large and Pannon White rabbits with respect to haplotypes found in other wild and domestic rabbit populations ………46
Content of the tables Table 1. Additive and dominance components of productive traits in cattle ... 16
Table 2. Additive and dominance components of reproductive trait in cattle ... 17
Table 3. Additive and dominance components of confirmative traits in cattle ... 20
Table 4. Additive and dominance components of reproductive traits in pig and rabbit ... 22
Table 5. Additive and dominance components of growth traits in pig ... 24
Table 6. Additive and dominance components of growth traits in poultry and fish ... 26
Table 7. Additive and dominance components of reproductive traits in poultry... 28
Table 8. Descriptive statistics on litter size traits analyses in Pannon rabbit breeds ... 34
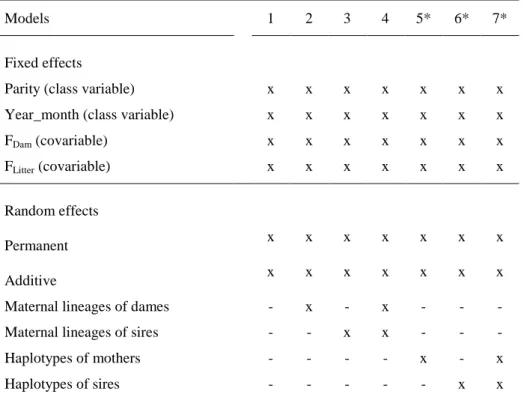
Table 9. The pedigree of Pannon rabbit breeds ... 34 Table 10. Description of models used in estimating cytoplasmic and D-loop mtDNA effects
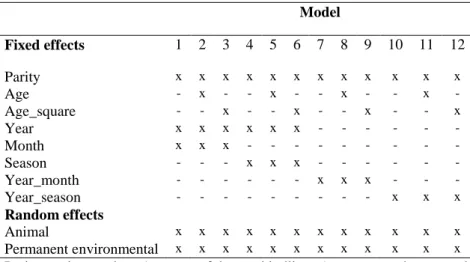
Table 11. Fixed factors of applied models of Pannon rabbits... 38
Table 12. Estimated variance components and genetic parameters for additive genetic, cytoplasmic (maternal and paternal) and environmental effects for litter size traits in Pannon Large breeds ... 48
Table 13. Estimated variance components and genetic parameters for additive genetic, cytoplasmic (maternal and paternal) and environmental effects for litter size traits in Pannon White breeds ... 48
Table 14. Estimated variance components and genetic parameters for additive genetic, cytoplasmic (maternal and paternal) and environmental effects for litter size traits in Pannon Ka breeds ... 49
Table 15. Estimated variance components for additive genetic, D-loop mtDNA (maternal and paternal) and environmental effects for litter size traits in Pannon White rabbit ... 51
Table 16. Estimated variance components for the number of kits born alive (NBA) of PL ... 54
Table 17. Estimated variance components for the number of kits born dead (NBD) of PL .... 54
Table 18. Estimated variance components, total number of born kits (TNB) of PL ... 55
Table 19. Estimated variance components, for number of kits born alive (NBA) of PW ... 56
Table 20. Estimated variance components, for number of kits born dead (NBD) of PW ... 57
Table 21. Estimated variance components, total number of born kits (TNB) of PW ... 57
Table 22. Estimated variance components, for number of kits born alive (NBA) of PK ... 59
Table 23. Estimated variance components, for number of kits born dead (NBD) of PK ... 59
Table 24. Estimated variance components, total number of born kits (TNB) of PK ... 60
Table 25. Estimated variance components and variance ratios based on extended models for the number of kits born alive (NBA), number of kits born dead (NBD) and total number of kits born (TNB) of PL ... 62
Table 26. Estimated variance components and variance ratios based on the extended models for number of kits born alive (NBA), number of kits born dead (NBD) and total number of kits born (TNB) of PW ... 64
Table 27. Estimated variance components and variance ratios based on the extended models for number of kits born alive (NBA), number of kits born dead (NBD) and total number of kits born (TNB) of PK ... 66
Table 28. Estimated genetic trends and parameters evaluating the goodness of fit for models for the number of kits born alive (NBA), kits born dead (NBD) and total number of born kits (TNB) of PL ... 68
Table 29. Estimated genetic trends and parameters evaluating the goodness of fit for models for the number of kits born alive (NBA), kits born dead (NBD) and total number of born kits (TNB) of PW... 69 Table 30. Estimated genetic trends and parameters evaluating the goodness of fit for models for the number of kits born alive (NBA), kits born dead (NBD) and total number of born kits (TNB) of PK ... 70
2. Introduction
For several decades the basic goal in animal breeding has been to improve traits of economic interest. This goal is being accomplished by identifying the individuals having superior genetic merit then selecting these animals to create the next generation. This process is accomplished by means of the breeding program where prediction of breeding values (genetic evaluation) is one of the most important elements of the selection process.
Although the theoretical basics were developed 40 years ago (Henderson, 1975) breeding value prediction could not become widespread until the development of softwares from the 1990s (Boldman et al., 1993; Groeneveld, 1990; Meyer, 1989) that could be applied estimating the breeding values (based on pedigree and performance data). Since the early 1990s the breeding value prediction became wide spread worldwide in every domesticated species and selection has been based on the BLUP (best linear unbiased prediction) breeding values in cattle (Dempfle, 1977), pigs (Hudson et al., 1985), sheep (Olesen et al., 1995) and rabbit (Estany et al., 1989). In Hungary the method also became widespread. In cattle the breeding value estimation of the bulls was based on the BLUP sire models as early as 1985 then on the animal models from 1999 (Nagy et al., 2004). Compared to cattle the BLUP method was introduced a bit later in pigs (Groeneveld et al., 1996), sheep (Nagy et al. 1999) and in rabbits (Nagy et al., 2006).
The common feature of the above mentioned studies was that the genetic evaluation focused only on the additive genetic effects while ignoring non-additive genetic effects (dominance and epistasis). As noted by Norris et al. (2010) genetic evaluation in any livestock species has been for the prediction of transmitting ability which is due to additive genetic effects.
Although non-additive genetic effects are not directly transmitted from parents to offspring, they are important for traits closely related to fitness or having low heritability (Falconer, 1989). In fact the significant contributions to phenotypic variation - especially fitness and reproductive traits - of the dominance genetic effects has also been observed in a number of studies (Norris et al., 2006). Estimating dominance variance has been a subject of interest for decades (Maki-Tanila 2007) as there are several reasons for estimating dominance variation:
an unbiased estimation of variance components (Misztal 1997), more precise prediction of additive effects with the effects of gene interactions included in the genetic evaluations (Henderson, 1989; Misztal et al., 1996), and usage of dominance effects through a crossbreeding or planning of mating schedule.
Dominance influences all genetic parameters related to cross- breeding (Wei et al., 1991a;
Wei et al., 1991b). Pigs and rabbits, as prolific multiparous species, within populations usually have a large number of non-additive relationships (i.e., full-sibs) (DeStefano and Hoeschele, 1992). Van Tassell et al. (2000) suggested that a minimum of 20% full sibs should be in the population for successful estimation of non-additive genetic variation.
Information on non-additive genetic effects is limited. Culbertson et al. (1998) showed estimates of dominance to be 25 % and 78% of additive genetic variance for number born alive and 21 day litter weight, respectively in Yorkshire pigs. In a study related to pigs Norris et al. (2010) showed that estimates of additive genetic variance were 0.554, 16.84 and 4.535 for number born alive (NBA), interval between parities (FI) and 21-day litter weight (LWT21), respectively. Corresponding estimates of dominance variance were 0.246, 9.572 and 0.661, respectively. As also noted by Toro and Varona (2010), we need to remember that ignoring non-additive genetic effects will produce less accurate estimates of breeding values and will have an effect on rankings. Technically it is now also possible to consider dominance effects; however, mainly due to the technical and computational difficulties dominance effects are still usually ignored from animal models (Toro and Varona, 2010).
Scientific research connected to rabbit breeding has a long tradition at the Kaposvár University. Since 1988 scientific staff of Kaposvár University has developed 3 different rabbit breeds (Pannon White, Pannon Ka and Pannon Large) where two of these breeds have been selected for thigh muscle volume based on in vivo Computer Tomography measurements. This type of selection is unique worldwide and its efficiency was proved from different perspectives (Nagy et al., 2006; Szendrő et al., 2010; Szendrő et al., 2012). Besides, Pannon White rabbit breed also has an extremely long and complete pedigree which makes it highly suitable for analysing population structure and inbreeding depression (Nagy et al., 2010; Nagy et al., 2013a). In the classical approach based on the pedigree, confounding is a serious problem as it is not possible to separate dominance effects from the full-sib common environment. Utilisation of the abundant multi-generation data allows separation of dominance from non-genetic effects (Lee et al. 2010). In recent years the estimation of the dominance variance component has been analysed for reproductive traits in Pannon White (Nagy et al., 2013b) and Pannon Ka (Nagy et al., 2014) rabbit breeds based on family effects (extended animal model).
It should be concerned to face with the difficulties when introducing the dominance effect into the models that we should choose the appropriate structure of these models before
applied dominance effect into the models. Since the first evaluation genetic variances of rabbits’ reproductive performance based on the Best Linear Unbiased Prediction (BLUP) (Estany, 1989), several similar studies have been published (Rastogi, 2000; García and Baselga, 2002a, Piles et al., 2006; Nagy, 2011a; Nagy, 2011b; Ragab, 2011) covering the most important breeds and hybrid breeds. Nevertheless, when analysing model structures applied by these authors, besides the obvious random effects (animal and permanent environmental effects) it can be seen that the considered factors of these studies are highly heterogeneous (mating buck, physiological status, kindling month, kindling season, inbreeding coefficient of the dam, etc.). Only few studies presented model comparisons (Piles et al., 2006; Nagy et al., 2011b), where repeatability and multi-trait models were compared.
In most studies no extensive information was given to specify how the authors developed the structure of the model evaluating reproductive performance. Another important issue of genetic evaluation is to determine which genetic effects should be considered. In animal breeding mostly simplified models are applied, taking into account only the additive genetic effects. On the other side, other genetic factors can also influence inheritance of quantitative traits and consequently they have impact on the estimation of basic genetic parameters. The mitochondrial genome (mitogenome) is a closed circular DNA molecule, in rabbits the length of the molecule is approximately 17,245 nt varying by repeated motifs placed in the control region, that encodes for the synthesis of 13 proteins that are essential for the oxidative phosphorylation (OXPHOS) system and are responsible for the regulation of cellular energy metabolism (Wallace, 1999). Mitogenome is inherited only through the maternal lineage (Giles et al., 1980), thus, providing genetic mechanism for cytoplasmic inheritance with potential impact on the quantitative traits and the estimation of genetic parameters important in animal breeding (VanVleck, 2000 -chapter 19). Thus, in a simulation study, Boettcher et al (1996c) noted that ignoring cytoplasmic effects will lead to biased estimates of heritability.
Starting with the study of Bell et al. (1985) cytoplasmic effects, analysed as effects of maternal lineages, were most comprehensively analysed in cattle populations on milk production (Kennedy 1986; Boettcher et al., 1996b; Boettcher et al., 1997) as well as on the growth traits (Pun et al., 2012). The similar models were also performed in poultry (Szwaczkowski et al., 1999), sheep (Hanford et al., 2003; Snowder et al., 2004). The estimated effects in all those studies varied from negligible to the impact of up to 5% of phenotypic variation (Gibson et al., 1997). However, in all those studies cytoplasmic effects were analysed under assumption that maternal lineages derived from the pedigree reflect
accurate estimates cytoplasmic quantitative genetic models have to be further extended to the association analyses of the mitogenome polymorphism, from D-loop mtDNA to complete mitogenome, with production traits. Good examples are provided in studies related to cattle (Boettcher et al., 1996a), poultry (Li et al., 1998; Zhao et al., 2015), pig (Yen et al., 2007;
Fernandez et al., 2008; Yu et al., 2015, Tsai et al., 2016), sheep (Chen et al., 2017) populations as well as to humans (Ruiz-Pesini et al., 2000; Liu et al., 2012) where association of certain mitogenome polymorphisms with quantitative traits have been analysed.
Unfortunately, as far as we are aware, no single analysis has evaluated the impact of cytoplasmic effects, neither of maternal lineages nor of mitogenome sequence variation, on any of traits that are important in rabbit production. Thus, estimate the genetic parameters, predict the breeding values and effects of cytoplasmic and mitochondrial inheritance for litter size components of Pannon rabbits using several animal models (based on the available environmental factors) are applied in order to detect the structures of the “best” models.
3. Literature review
Dominance variance is one of the main features whose properties determine genetic variance.
Genetic evaluation in commercial programs nowadays is widely based on BLUP, ensuring unbiased estimates if the full relationship matrix and all data used in selection are included in the evaluation (Blasco and Toro, 2014). Selection efficiency also depends on the magnitude of the non-additive variances. An intensive research is now being developed in this area.
However, including non-additive effects like dominance effect in the applied models produces further complications. Thus, understanding the basis of dominance effect plays a vital role in the genetic improvement of farm animals.
3.1 A brief history
The concept of dominance, originally formulated by Gregor Mendel (Bennett, 1965) is fundamental to genetics. Though Mendel, "The Father of Genetics", first used the term in the 1860s, it was not widely known until the early twentieth century. Firstly, Fisher (1928) explained the overwhelming majority of deleterious mutations in the observed partial or complete dominance of wild-type alleles. However, based on physiological caused dominance effect was mentioned by Wright (1929, 1934). The theoretical models and empirical experiments suggest that substantial selection for dominance modifiers exists during the spread of adaptive alleles (Bourguet, 1999). According to Schlager (1974), genetic analysis yielded significant additive and dominance components in the inheritance of systolic blood pressure in mice. The estimates of non-additive components were highly variable but generally small compared to the additive genetic estimates in chicken populations (Silva et al., 1976). Genetic variance estimated from twin data into additive and dominance variances was presented using Falconer's variance component model, which seems to be the least affected by fluctuations in the magnitudes of dominance and environmental variances (Kang et al., 1977). Dominance components were two to four times the magnitude of additive components for dairy characters (Thomas et al., 1985). Mixed models including additive and non-additive genetic effects have been developed (Henderson, 1989; Meyer, 1989; Hoeschele and Van Raden, 1991). Egg production is also influenced by dominance (Fairfull and Gowe, 1990). Dominance influences all genetic parameters related to cross-breeding (Wei et al., 1991a; Wei et al., 1991b). Van Raden (1989), Hoeschele (1991), and Tempelman and Burnside (1991) have reported such estimation of dominance variance for dairy cattle traits.
The results on dominance were in good agreement with heterosis and inbreeding depression for these egg production traits and it was described by Ming et al. (1993). Varona et al.
(1999) found that the largest changes after adding the dominance effect to the model were for
animals with no own records and having many progenies by a single mate, e.g. dams of a single embryo-transfer batch in cattle. Non-additive genetic effects appear to be of sizeable magnitude for fertility traits and should be included in models intended for estimating additive genetic merit (Palucci et al., 2007). The use of the complete dominance relationship matrix may improve the estimation of additive genetic variances and breeding values in pigs (Dufrasne et al., 2014). Ignoring the dominance resulted in a slight overestimation of permanent environmental effects and these two effects showed partial confounding (Nagy et al., 2014).
3.2 Definition
Non-additive genetic variation results from interactions between genes and the most important non-additive genetic effects are those of dominance (Gengler et al., 1998).
Dominance effects are caused by interactions of alleles at the same locus and are not directly transmitted from an animal to its progeny (Hoeschele and Van Raden, 1991). The prediction of additive and dominance genetic effects concurrently should allow for a more precise prediction of total genetic merit and breeding value and knowledge of the dominance effect may be beneficial for mate selection programs so that the genetic merit of the progeny can be maximized (Henderson, 1989). However, large populations are required to obtain acceptable accuracies for breeding values (Goddard and Hayes, 2009).
3.3 Genetic parameters
3.3.1 Cattle
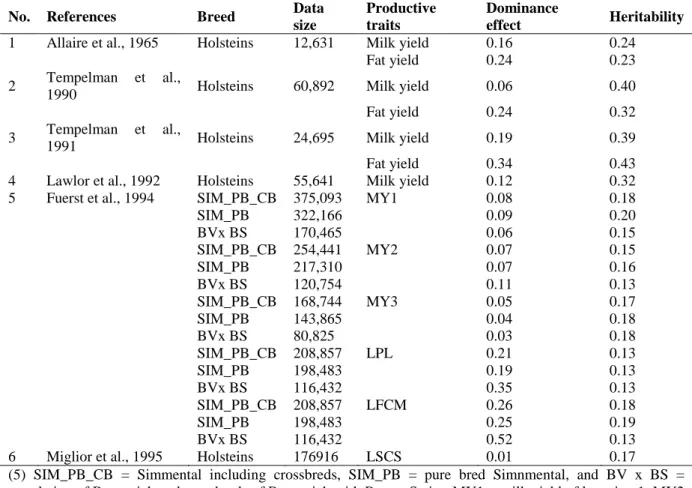
The estimates of dominance effect and heritability for productive traits of cattle were generally different in magnitude and ranged from very low to moderate (Table 1). Allaire and Henderson (1965) presented the computed estimates of the dominance effects and heritabilities for first lactation records of milk and fat yields. With advances in the development of effective algorithms for large data sets, Tempelman and Burnside (1990, 1991) and Lawlor (1992) reported considerable dominance effects for the same traits in Holstein Friesian population.
Table 1. Additive and dominance components of productive traits in cattle
No. References Breed Data
size
Productive traits
Dominance
effect Heritability 1 Allaire et al., 1965 Holsteins 12,631 Milk yield 0.16 0.24
Fat yield 0.24 0.23
2 Tempelman et al.,
1990 Holsteins 60,892 Milk yield 0.06 0.40
Fat yield 0.24 0.32
3 Tempelman et al.,
1991 Holsteins 24,695 Milk yield 0.19 0.39
Fat yield 0.34 0.43
4 Lawlor et al., 1992 Holsteins 55,641 Milk yield 0.12 0.32
5 Fuerst et al., 1994 SIM_PB_CB 375,093 MY1 0.08 0.18
SIM_PB 322,166 0.09 0.20
BVx BS 170,465 0.06 0.15
SIM_PB_CB 254,441 MY2 0.07 0.15
SIM_PB 217,310 0.07 0.16
BVx BS 120,754 0.11 0.13
SIM_PB_CB 168,744 MY3 0.05 0.17
SIM_PB 143,865 0.04 0.18
BVx BS 80,825 0.03 0.18
SIM_PB_CB 208,857 LPL 0.21 0.13
SIM_PB 198,483 0.19 0.13
BVx BS 116,432 0.35 0.13
SIM_PB_CB 208,857 LFCM 0.26 0.18
SIM_PB 198,483 0.25 0.19
BVx BS 116,432 0.52 0.13
6 Miglior et al., 1995 Holsteins 176916 LSCS 0.01 0.17
(5) SIM_PB_CB = Simmental including crossbreds, SIM_PB = pure bred Simnmental, and BV x BS = population of Braunvieh and crossbreds of Braunvieh with Brown Swiss; MY1 = milk yield of lactation 1, MY2
= milk yield of lactation 2, MY3 = milk yield of lactation 3; LPL= length of productive life, and LFCM = lifetime production of fat corrected milk; (6) LSCS = lactation mean of somatic cell score for first lactation.
The lowest dominance and highest heritability values were found in the study which was based on the biggest dataset (Tempelman and Burnside, 1990). Thus, these significant differences can mainly due to substantial improvement in the available hardware and software allowing the estimation of non-additive genetic variances from large files of field data (Fuerst and Sölkner, 1994).
For lactation traits, levels of dominance were quite constant through the tested breeds, except for the BV x BS data for second lactation, in which dominance was very high. Dominance and heritability estimates were highest (Table 1) in the first lactation among three lactations;
estimating the second lactation were equal to or lower than that for third lactation and heritability decreased from first to third lactations (Strandberg, 1991).
Fuerst and Sölkner (1994) reported that dominance variance was important for most lifetime performance traits dominance was definitely higher than additive variance. Particularly, dominance variance was high for both traits and for all breeds especially for the population of Braunvieh and crossbreds of Braunvieh with Brown Swiss (BV x BS) data. Heritability
estimates for LPL was unchanged over all breeds (Table 1). Estimates for LFCM for BV x BS were outside of parameter limits because of high standard errors (0.06-0.1) and possible correlations between the genetic variances (Van Raden et al., 1992). McAllister et al., 1990 found significant heterosis for most lifetime performance traits in a crossbred population of Holsteins. Heritability estimated by Miglior et al., (1995) for lactational measures of somatic cell score for first lactation was almost twice as large as the dominance component, but, overall, non-additive genetic variance was low.
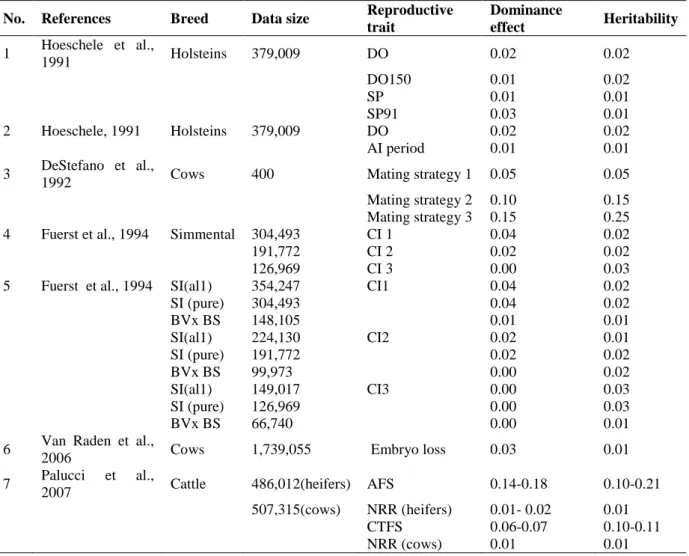
Table 2. Additive and dominance components of reproductive trait in cattle
No. References Breed Data size Reproductive trait
Dominance
effect Heritability 1 Hoeschele et al.,
1991 Holsteins 379,009 DO 0.02 0.02
DO150 0.01 0.02
SP 0.01 0.01
SP91 0.03 0.01
2 Hoeschele, 1991 Holsteins 379,009 DO 0.02 0.02
AI period 0.01 0.01
3 DeStefano et al.,
1992 Cows 400 Mating strategy 1 0.05 0.05
Mating strategy 2 0.10 0.15 Mating strategy 3 0.15 0.25
4 Fuerst et al., 1994 Simmental 304,493 CI 1 0.04 0.02
191,772 CI 2 0.02 0.02
126,969 CI 3 0.00 0.03
5 Fuerst et al., 1994 SI(al1) 354,247 CI1 0.04 0.02
SI (pure) 304,493 0.04 0.02
BVx BS 148,105 0.01 0.01
SI(al1) 224,130 CI2 0.02 0.01
SI (pure) 191,772 0.02 0.02
BVx BS 99,973 0.00 0.02
SI(al1) 149,017 CI3 0.00 0.03
SI (pure) 126,969 0.00 0.03
BVx BS 66,740 0.00 0.01
6 Van Raden et al.,
2006 Cows 1,739,055 Embryo loss 0.03 0.01
7 Palucci et al.,
2007 Cattle 486,012(heifers) AFS 0.14-0.18 0.10-0.21
507,315(cows) NRR (heifers) 0.01- 0.02 0.01
CTFS 0.06-0.07 0.10-0.11
NRR (cows) 0.01 0.01
DO = Days open, DO150 = days open with an upper bound of 150 d, SP = service period (days between first and last insemination), SP91 = service period with an upper bound of 91day, AI = artificial insemination, CI 1 = Calving interval for lactations 1, CI 2= Calving interval for lactations 2, CI 3 = Calving interval for lactations 3;
SI (all) =Simmental including crossbreds, SI (pure) =pure bred Simmental, and BV x BS = population of Braunvieh and crossbreds of Braunvieh with Brown Swiss; AFS = age at first service; NRR = non-return-rate;
CTFS = interval from calving to first service
Accurate estimation of dominance variances is difficult because proportions of variance shared by relatives maybe small and confounded with other genetic or environmental effects
(Fuerst and Sölkner, 1994). Inclusion of dominance effects in genetic evaluation models can improve estimation of additive effects and should be considered in breeding programs.
The results of several studies examining fertility traits are presented in Table 2. Dominance variance was equal or larger than heritability for artificial insemination, days open (DO), service period (days between first and last insemination-SP) and service period with an upper bound of 91 days traits (SP91), excepting days open with an upper bound of 150 days trait (DO150) but dominance variance relied clearly on upper bounds. Dominance effect was negligible for DO and DO150, SP and SP91 although its value increased to double with upper bound days (Table 2). Heritability was equal levels for days open, service period and artificial insemination traits (Table 2). Alteration in female reproduction is owing to variations among cow in ability to conceive and that of the embryo to survive. Genetic variation in ability to conceive and in embryonic survival may have been reduced because all cows were fertile as heifers and were successful conceptions themselves (Hoeschele, 1991).
Turning to examine three mating strategies were shown by DeStefano and Hoeschele (1992) such as mating strategy 1 allocated sires to cows based on predicted specific combining ability (PSCA) among service sires and sires of the cows such that average PSCA was maximized by linear programming, mating strategy 2 were ranked by sire x maternal grandsires (MGS) combination effect and chosen sequentially sequential allocation by specific combining ability (SEQ) and mating strategy 3 were the average PSCA calculated for each MGS over all 10 service sires, to simulate the increase in progeny performance, heritability and the ratio of dominance to phenotypic variance, both showed increasing trend from the first mating strategy to the third one relied on predicted specific combining abilities among sires and maternal grandsires through random mating to avoid inbreeding that do not use specific combining ability. Fuerst and Sölkner (1994) reported about six inbred breeds of Holsteins and their reciprocal crosses, the results for calving interval about estimates of heritability computed in the present studies were in agreement with others at three lactation periods. Except for the population of Braunvieh and crossbreds of Braunvieh with Brown Swiss (BV x BS), dominance effect was equal or larger than do heritability and interestingly, equals to zero in term of calving interval 3. Comparison of the three period of lactation, heritability estimates did not decrease except for BV x BS in the third period. However, it has to be noted that, the magnitude of heritability and dominance estimates were all close to zero.
Beckett et al. (1979) concluded that specific gene combinations and the way in which they were assembled can have an important influence on reproductive performance. Non-return
rate (NR) at day 70 after first insemination was evaluated as a trait of the embryo loss, which is caused by lethal recessive genes. Heritability estimates for this trait is substantially smaller compared to dominance variance. Dominance genetic variances were greater than heritability for age to first service, heifer non return rate, and interval from calving to first service and found the agreement with the findings of Miglior et al., (1995). Table 2 showed the results of several models estimating several non-additive genetic variances including dominance (D), additive-by dominance (AD) and dominance-by-dominance (DD), together with the additive genetic variance (A) and the model including only additive genetic effect. Comparing genetic variance estimates between heifer and cow in non-return rate, non-additive genetic variance estimates were similar in value. On the contrary the additive component was much greater for cows than for heifers. The possible reason may be that non-return rate in cows is influenced by other factors that regulate ovarian activity and may have a heritability value greater than that of non-return rate (Palucci et al., 2007). Heritability in the narrow sense (i.e. additive genetic variance to phenotypic variance) was lower when accounting for dominance genetic variances than using an additive animal model. This phenomenon was reported by Palucci (2007) in Table 2. Whenever gene interactions are omitted from the model their variance gets split between the additive and the residual effect therefore determining the additive effect to be overestimated. The consequences of this study on genetic evaluations for fertility traits, and maybe other traits, are that the ratio of the variance explained by non-additive genetic effects to phenotypic variance appears larger than heritability in the narrow sense for age at first service, heifer non-return rate and calving to first service (Palucci et al., 2007). Ignoring dominance genetic variances may result in additive genetic effects to be overestimated and possibly biased, as seen by comparison of the results in Table 2 with numerous studies on this issue. Estimates of dominance variance and heritability together with their standard errors of the eighteen confirmative traits are given in Table 3. These results suggest that significant differences existed in the estimates of dominance genetic variance and heritability between Rhodes and McNay lines (Table 3). The range of estimates was from low to moderately high.
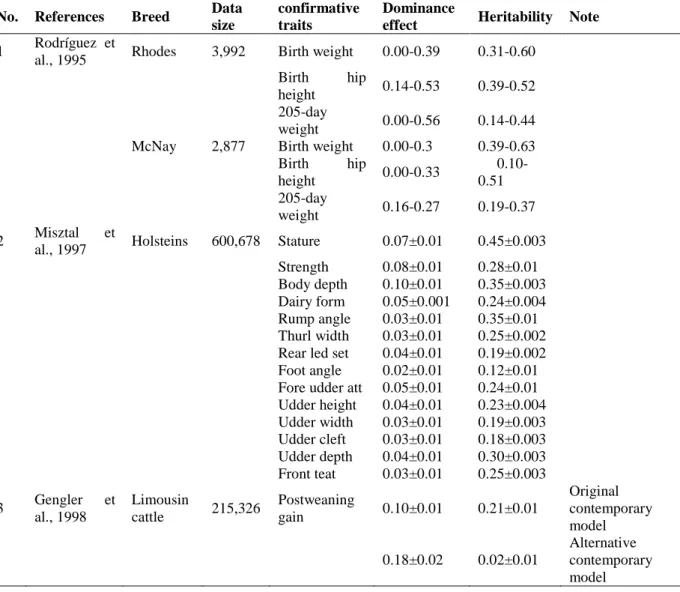
Particularly, the highest estimates of dominance variance were for WW; therefore, this trait is expected to present the largest degree of heterosis (Willham, 1970). The lowest estimates of dominance variance were observed for BWT, BH, and WH for both lines. Estimates of dominance variance and heritability were generally higher at the Rhodes herd than at the McNay herd for BWT, BH, and WW (Tables 3).
Table 3. Additive and dominance components of confirmative traits in cattle
No. References Breed Data size
confirmative traits
Dominance
effect Heritability Note 1 Rodríguez et
al., 1995 Rhodes 3,992 Birth weight 0.00-0.39 0.31-0.60 Birth hip
height 0.14-0.53 0.39-0.52 205-day
weight 0.00-0.56 0.14-0.44 McNay 2,877 Birth weight 0.00-0.3 0.39-0.63
Birth hip
height 0.00-0.33 0.10- 0.51 205-day
weight 0.16-0.27 0.19-0.37 2 Misztal et
al., 1997 Holsteins 600,678 Stature 0.07±0.01 0.45±0.003 Strength 0.08±0.01 0.28±0.01 Body depth 0.10±0.01 0.35±0.003 Dairy form 0.05±0.001 0.24±0.004 Rump angle 0.03±0.01 0.35±0.01 Thurl width 0.03±0.01 0.25±0.002 Rear led set 0.04±0.01 0.19±0.002 Foot angle 0.02±0.01 0.12±0.01 Fore udder att 0.05±0.01 0.24±0.01 Udder height 0.04±0.01 0.23±0.004 Udder width 0.03±0.01 0.19±0.003 Udder cleft 0.03±0.01 0.18±0.003 Udder depth 0.04±0.01 0.30±0.003 Front teat 0.03±0.01 0.25±0.003 3 Gengler et
al., 1998
Limousin
cattle 215,326 Postweaning
gain 0.10±0.01 0.21±0.01
Original contemporary model 0.18±0.02 0.02±0.01
Alternative contemporary model
These differences could be due to sampling variance only; more records were available at Rhodes and the inverses of the dominance relationship matrices were denser for the data subsets from this herd, which could have resulted in better estimates of the parameter (Rodríguez et al., 1995).
Estimates of dominance and additive variances were obtained for next 14 linear confirmative traits in Holsteins. These traits are scored on a unified scale of one to 50, and have a similar phenotypic standard deviation of about 6.0, thus simplifying comparisons among them (Thompson et al., 1983). No clear relationship was found between the estimates of dominance and heritability and, particularly, larger estimates of dominance variances were generally associated with higher additive variances, but that association was weak. (Misztal et al., 1997); Table 3 presents estimates of dominance and heritability variances for the 14 traits are expressed as ratio of the phenotypic variance with the standard deviations. All traits with
larger estimates of dominance were strength, body depth and dairy form traits. Estimate of dominance variance was highest level for body depth and lowest for foot angle (Table 3). For all traits, the dominance variance was, on average 10 times lower than the heritability. The estimates of the dominance variance are low for some traits but there is a substantial variability for their magnitude.
Another study based on Limousin cattle, estimates of dominance variances were higher than heritability expressed as percentage of the phenotypic variance (Table 3) based on alternative contemporary model. The high values may indicate that dominance effect is important for post-weaning gain trait. Results showed the advantage of an individual dominance approach based on sire-dam combinations; therefore, expected gains through the use of specific combination ability as a part of the mating selection criteria for growth might be high (Gengler et al., 1998). A potential candidate for such variation in PWG could be the performance differences between males and females. Some changes may happen in estimated breeding values obtained with or without dominance genetic effects in the models. This approach should be superior to using expected heterosis on a breed level in commercial selection because allele interaction is directly modelled on a sire-dam base independently from breed origin (Gengler et al., 1998). Use of specific combining ability as described by Henderson (1988) might permit the exploitation of the observed dominance variance in commercial situations, upgrading, or purebred populations.
3.3.2 Pigs and rabbits
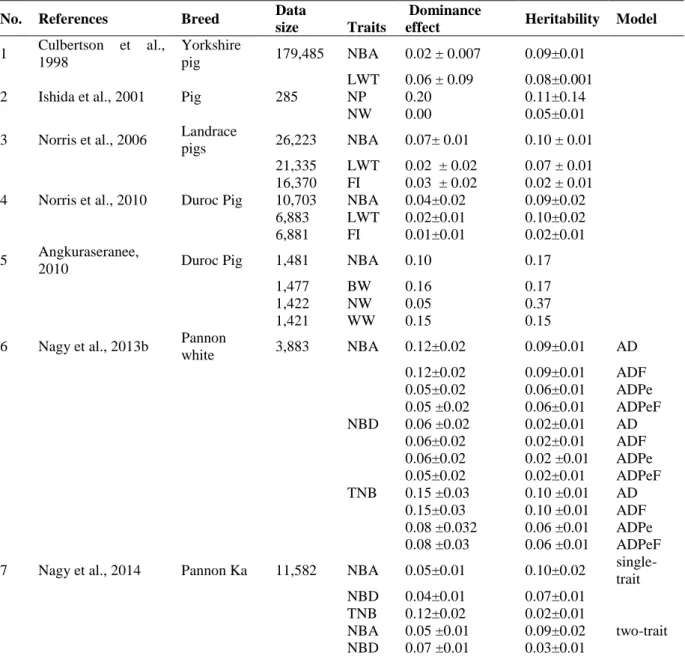
Dominance and heritability measurements for reproductive traits of pig and rabbit are presented in Table 4. All variances are expressed as a ratio of the phenotypic variance.
Estimates of dominance variance were moderate and lower than additive variance for NBA and LWT on pig. According to Norris et al. (2006), the proportion of phenotypic variance accounted for by dominance effects for farrowing interval was larger than the heritability of additive effects for this trait, indicating the importance of dominance effects on this trait, although according to the study of Norris et al. (2010), dominance variance were lower than additive variance. This could be due to the small data size and the standard errors were large for the observed estimates especially the dominance.
Table 4. Additive and dominance components of reproductive traits in pig and rabbit
No. References Breed Data
size Traits
Dominance
effect Heritability Model 1 Culbertson et al.,
1998
Yorkshire
pig 179,485 NBA 0.02 ± 0.007 0.09±0.01 LWT 0.06 ± 0.09 0.08±0.001
2 Ishida et al., 2001 Pig 285 NP 0.20 0.11±0.14
NW 0.00 0.05±0.01
3 Norris et al., 2006 Landrace
pigs 26,223 NBA 0.07± 0.01 0.10 ± 0.01 21,335 LWT 0.02 ± 0.02 0.07 ± 0.01 16,370 FI 0.03 ± 0.02 0.02 ± 0.01 4 Norris et al., 2010 Duroc Pig 10,703 NBA 0.04±0.02 0.09±0.02
6,883 LWT 0.02±0.01 0.10±0.02
6,881 FI 0.01±0.01 0.02±0.01
5 Angkuraseranee,
2010 Duroc Pig 1,481 NBA 0.10 0.17
1,477 BW 0.16 0.17
1,422 NW 0.05 0.37
1,421 WW 0.15 0.15
6 Nagy et al., 2013b Pannon
white 3,883 NBA 0.12±0.02 0.09±0.01 AD
0.12±0.02 0.09±0.01 ADF 0.05±0.02 0.06±0.01 ADPe 0.05 ±0.02 0.06±0.01 ADPeF NBD 0.06 ±0.02 0.02±0.01 AD
0.06±0.02 0.02±0.01 ADF 0.06±0.02 0.02 ±0.01 ADPe 0.05±0.02 0.02±0.01 ADPeF TNB 0.15 ±0.03 0.10 ±0.01 AD
0.15±0.03 0.10 ±0.01 ADF 0.08 ±0.032 0.06 ±0.01 ADPe 0.08 ±0.03 0.06 ±0.01 ADPeF 7 Nagy et al., 2014 Pannon Ka 11,582 NBA 0.05±0.01 0.10±0.02 single-
trait NBD 0.04±0.01 0.07±0.01
TNB 0.12±0.02 0.02±0.01
NBA 0.05 ±0.01 0.09±0.02 two-trait NBD 0.07 ±0.01 0.03±0.01
NBA = number born alive, LWT = 21-d litter weight, NP= the number of piglet born in total, NW = number weaned, FI = interval between parities, BW = birth weight; WW = weaning weight, NBD = number of kits born dead; TNB = total number of kits born, AD = model with additive and dominance effects; ADPe = model with permanent environmental, additive, and dominance effects; ADF= model with additive, dominance, and inbreeding (doe and litter) effects; ADPeF = model with permanent environmental, additive, dominance, and inbreeding (doe and litter)
However, a simulation study by Norris et al. (2002) revealed that even when the data set is small, as long as the magnitude of the dominance genetic variance is large, dominance genetic variances can be estimated with relatively good accuracies. Estimating the additive and dominance genetic variances for birth weight (BW), number weaned (NW), and weaning weight (WW) substantial magnitudes were found. For the number of piglet born in total trait, the narrow-sense heritability was smaller than dominance in the minor level. These ratios of the variance because of dominance effects were also not statistically significant largely due to
the large standard errors. The results suggest that dominance genetic effects affect expression of the traits studied. Several authors (Hoeschele, 1991; Fuerst and Sölkner, 1994) indicated that non-additive genetic variance could be relatively important in fertility traits since these traits show low additive genetic variance.
The estimated variance components based on rabbit data is presented in Table 4. Additive, dominance, and permanent environmental variance components were estimated for the number of kits born alive, number of kits born death, and total number of kits born of a synthetic rabbit line (called Pannon Ka). Using the models without and with dominance components such as AD, model with additive and dominance effects; ADPe, model with permanent environmental, additive, and dominance effects; ADF, model with additive, dominance, and inbreeding (doe and litter) effects; ADPeF, model with permanent environmental, additive, dominance, and inbreeding (doe and litter) effects, heritability estimates were low for all traits (NBA, NBD and TNB). The examined traits were evaluated using single-trait and two-trait (number of kits born alive-dead) animal models containing all or part of the following effects: additive genetic effects, permanent environmental effects, dominance effects (Nagy et al., 2014). Results showed that the dominance components for number born alive (NBA), number of kits born dead (NBD) and total number of kits born (TNB) were smaller or larger than heritability and various levels among the different models with the dominance effects (Table 4). Ignoring the dominance resulted in a slight overestimation of permanent environmental effects and these two effects showed partial confounding (Nagy et al., 2013b). Accuracy of genetic evaluations could be increased when dominance genetic effects are considered in the model of evaluation (Misztal, 1997; Van Raden et al., 1992; Johansson et al., 1993). These findings justify including dominance effects in models of litter size traits in populations that reveal significant dominance relationships.
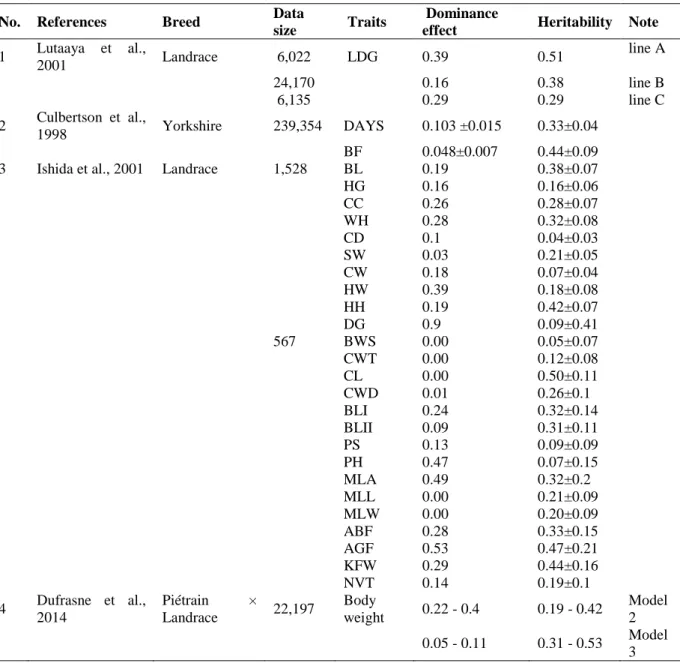
Studies analysing growth traits of pig presented in Table 5. Data on lifetime daily gain from two purebred lines A, B, and their reciprocal crosses C were used to estimate dominance variance and heritability. The ratio of parental dominance to phenotypic variance was moderate for lines A, B, and C. These ratios are very large, suggesting that the parental dominance variance may be inflated and may also contain other variances, including full-sib environmental variances and non-additive variances other than dominance (Lutaaya et al., 2001).
Table 5. Additive and dominance components of growth traits in pig
No. References Breed Data
size Traits Dominance
effect Heritability Note 1 Lutaaya et al.,
2001 Landrace 6,022 LDG 0.39 0.51 line A
24,170 0.16 0.38 line B
6,135 0.29 0.29 line C
2 Culbertson et al.,
1998 Yorkshire 239,354 DAYS 0.103 ±0.015 0.33±0.04
BF 0.048±0.007 0.44±0.09
3 Ishida et al., 2001 Landrace 1,528 BL 0.19 0.38±0.07
HG 0.16 0.16±0.06
CC 0.26 0.28±0.07
WH 0.28 0.32±0.08
CD 0.1 0.04±0.03
SW 0.03 0.21±0.05
CW 0.18 0.07±0.04
HW 0.39 0.18±0.08
HH 0.19 0.42±0.07
DG 0.9 0.09±0.41
567 BWS 0.00 0.05±0.07
CWT 0.00 0.12±0.08
CL 0.00 0.50±0.11
CWD 0.01 0.26±0.1
BLI 0.24 0.32±0.14
BLII 0.09 0.31±0.11
PS 0.13 0.09±0.09
PH 0.47 0.07±0.15
MLA 0.49 0.32±0.2
MLL 0.00 0.21±0.09
MLW 0.00 0.20±0.09
ABF 0.28 0.33±0.15
AGF 0.53 0.47±0.21
KFW 0.29 0.44±0.16
NVT 0.14 0.19±0.1
4 Dufrasne et al., 2014
Piétrain ×
Landrace 22,197 Body
weight 0.22 - 0.4 0.19 - 0.42 Model 2 0.05 - 0.11 0.31 - 0.53 Model
3 LDG = lifetime daily gain; Days = days to 104.5 kg; BF = back fat at 104.5 kg; BL = body length; HG = Heart girth; CC = cannon circumference; WH = withers height; CD = chest depth; SW = shoulder width; CW = chest width; HW = hip width; HH = hip height; DG = average daily gain; BWS = body weight before slaughter; CWT
= cold carcass weight; CL = carcass length; CWD = carcass width; BLI = black loin I; BLII = back loin II; PS = percentage of shoulder weight; PH = percentage of ham weight; MLA = M. longissimusthoracis area; MLL = M. longissimusthoracis length; MLW = M. longissimusthoracis weight; ABF = average back fat thickness; AGF
= average M. gluteus medius back fat thickness; KFW = kidney fat weight; NVT = the number of Vertebrae thoracicae.
However, the dominance variation should be accounted for lifetime daily gain. Heritability estimates for purebred lines were different to those for the crossbred line. Estimates of heritability for purebred lines obtained were generally higher than dominance effect, whereas both genetic parameters have the same ratio in the crossbred line. Animals ranked best as purebred are not necessarily breeding the best crossbreds (Lutaaya et al., 2001). Estimates dominance variance and heritability were obtained for days to 104.5 kg (DAYS), and back fat
at 104.5 kg (BF). All variances are expressed as a ratio of the phenotypic variance. Estimates of dominance variance were small magnitude for DAYS and BF. Dominance variance for DAYS and BF were estimated to be less than the additive variance in the narrow sense.
Although the dominance variance for DAYS would seem large, similar results were found for growth traits in beef cattle (Gengler et al., 1998). The results indicate that dominance effects may be important for reproductive and growth traits in swine. The amount of dominance variance varied among traits. It is not surprising because the variance depends largely on gene frequencies at loci concerned and changes during selection (Ishida et al., 2001).
However, the degree of dominance variances for chest depth (CD), chest width (CW), hip width (HW), average daily gain (DG), percentage of shoulder weight (PS), percentage of ham weight (PH); M. longissimus thoracis area (MLA); average M. gluteus medius back fat thickness (AGF) are greatly higher than that of heritability. Dominance effects could not be detected body weight before slaughter (BWS), cold carcass weight (CWT), carcass length (CL), M. longissimusthoracis length (MLL), M. longissimusthoracis weight (MLW), although the number of the piglet born in total (NP) and body length (BL) were affected. It appears necessary to consider the dominance effects in genetic evaluation of the selected lines. Dufrasne et al., (2014), estimated the dominance variance for repeated live BW records in a crossbred population of pigs from 50 to 210 d of age. Three single-trait random regression animal models were used: Model 1 without parental subclass effect, Model 2 with parental subclasses considered unrelated, and Model 3 with the complete parental dominance relationship matrix. Dominance variance was computed as 4 times the estimated parental subclass variance. Results presented that dominance effects exist for growth traits are reasonably smaller than heritability. Therefore, genetic variability in the studied population remains quite large and could explain the large heritability estimates for this population (Dufrasne et al., 2014). Estimated heritability and dominance effect in model 2 appeared to be lower compared with Model 3. Results of this study also showed that dominance variance exists for pig growth traits and that inclusion of dominance effects in genetic evaluation models is possible and will improve estimation of additive breeding values.
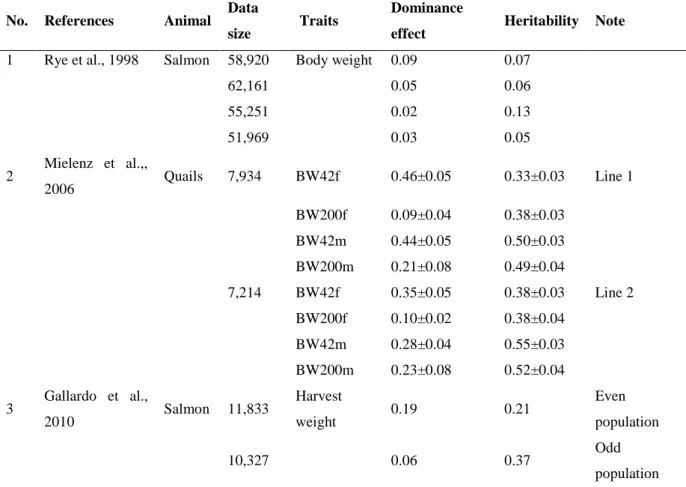
3.3.3 Poultry and fish
Table 6. Additive and dominance components of growth traits in poultry and fish
No. References Animal Data
size Traits Dominance
effect Heritability Note 1 Rye et al., 1998 Salmon 58,920 Body weight 0.09 0.07
62,161 0.05 0.06
55,251 0.02 0.13
51,969 0.03 0.05
2 Mielenz et al.,,
2006 Quails 7,934 BW42f 0.46±0.05 0.33±0.03 Line 1
BW200f 0.09±0.04 0.38±0.03
BW42m 0.44±0.05 0.50±0.03
BW200m 0.21±0.08 0.49±0.04
7,214 BW42f 0.35±0.05 0.38±0.03 Line 2 BW200f 0.10±0.02 0.38±0.04
BW42m 0.28±0.04 0.55±0.03
BW200m 0.23±0.08 0.52±0.04 3 Gallardo et al.,
2010 Salmon 11,833 Harvest
weight 0.19 0.21 Even
population
10,327 0.06 0.37 Odd
population BW42f = the body weight of 42-day-old females; BW200f = body weight at an age of 200 days females;
BW42m = the body weight of 42-day-old males; BW200m = body weight at an age of 200 days males
Dominance genetic variance and heritability estimates for growth traits of poultry and fish are summarized in Table 6. These traits were examined in numerous studies. Dominance genetic variance was smaller than additive genetic variance, except one population of 58,920 records where dominance variance was larger than additive genetic variance. The magnitude of dominance genetic variance and their effected the estimates of heritability found in this study encouraged significantly that dominance genetic variance should be considered in genetic evaluations for growth traits in salmon. Furthermore, estimates of heritability from models ignoring non-additive genetic effects were strongly biased upwards, illustrating a significant confounding between additive and non-additive genetic effects (Rye et al., 1998). Substantial reduction in the heritability estimates by including dominance effects in the model was previously reported for egg production traits in poultry (Wei et al.,, 1993). Ignoring non- additive genetic effects will likely have greater undesirable consequences in salmon than in cattle, as salmon populations have a higher level of average non-additive genetic relationships (Rye et al., 1998).
The estimated heritability and dominance genetic variance values of the body weight of 42- day-old females (BW42f), body weight at an age of 200 days females (BW200f), the body weight of 42-day-old males (BW42m), body weight at an age of 200 days males (BW200m), a total of 7,934 records for line 1 and 7,214 records for line 2 from 21 generations are shown in Table 6. The estimates are similar in both lines. The calculated values are high BW42m and BW200m, medium for BW42f and slight for BW200f. The magnitude of heritability was higher than for a larger parental dominance variance (Table 6). Surprisingly, high estimates of dominance values were reported for the body weight at an age of 42 days for both lines.
This may be because of the fact that unknown environmental effects influenced on the early growth rate of the quails; a second explanation for the overestimation mentioned above may be the fact that the parental dominance variance includes maternal, common environmental and epistatic variances; and last but not least, a third reason might be the insufficient amount of data (Mielenz et al., 2006). Any estimation of the dominance variance requires much larger datasets than an estimation of the additive variance (Misztal et. al., 1997).
Additionally, the high dominance variance estimates for BW may be due to the change of the allele frequencies caused by the selection of the egg weight over more than 20 generations (Mielenz et al., 2006). Using the dominance model to get a more precise estimation of heritability in a narrow sense should be applied.
Heritability and dominance genetic variance on harvest weight in two populations of Oncorhynchus kisutch, forming two classes such as odd and even-year spawners were also estimated. A high heritability for harvest weight was estimated in both populations but heritabilities decreased to even and odd populations moderately. Interestingly, the magnitude of the dominance variance was significantly decreased in both populations. In fact, the magnitude of these effects may be very different in different populations. However, ranking of the 30 best males and the 100 best females per generation changed when a high dominance variance was estimated, as was the case in one of the two populations (even) and dominance and common environmental variance may be important components of variance in harvest weight in O. kisutch, thus not including them may produce an overestimation of the predicted response; moreover, genetic evaluation was seen to be partially affected, since the ranking of selected animals changed with the inclusion of non-additive effects in the animal model (Gallardo et al., 2010).
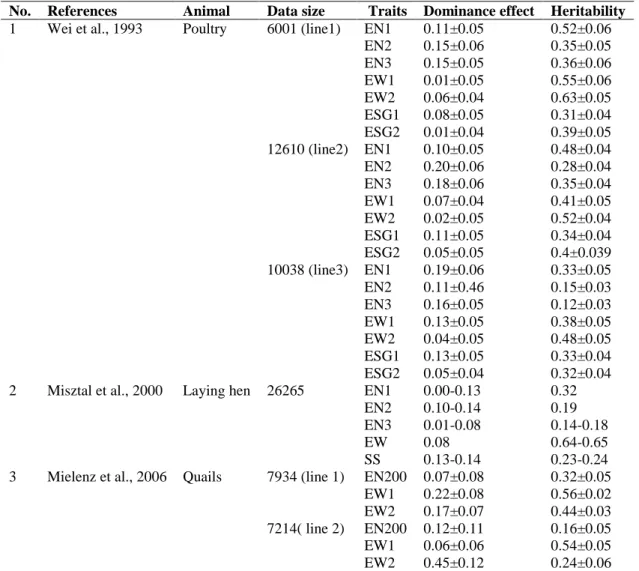
Table 7. Additive and dominance components of reproductive traits in poultry
No. References Animal Data size Traits Dominance effect Heritability 1 Wei et al., 1993 Poultry 6001 (line1) EN1 0.11±0.05 0.52±0.06
EN2 0.15±0.06 0.35±0.05 EN3 0.15±0.05 0.36±0.06 EW1 0.01±0.05 0.55±0.06 EW2 0.06±0.04 0.63±0.05 ESG1 0.08±0.05 0.31±0.04 ESG2 0.01±0.04 0.39±0.05 12610 (line2) EN1 0.10±0.05 0.48±0.04 EN2 0.20±0.06 0.28±0.04 EN3 0.18±0.06 0.35±0.04 EW1 0.07±0.04 0.41±0.05 EW2 0.02±0.05 0.52±0.04 ESG1 0.11±0.05 0.34±0.04 ESG2 0.05±0.05 0.4±0.039 10038 (line3) EN1 0.19±0.06 0.33±0.05 EN2 0.11±0.46 0.15±0.03 EN3 0.16±0.05 0.12±0.03 EW1 0.13±0.05 0.38±0.05 EW2 0.04±0.05 0.48±0.05 ESG1 0.13±0.05 0.33±0.04 ESG2 0.05±0.04 0.32±0.04 2 Misztal et al., 2000 Laying hen 26265 EN1 0.00-0.13 0.32
EN2 0.10-0.14 0.19
EN3 0.01-0.08 0.14-0.18
EW 0.08 0.64-0.65
SS 0.13-0.14 0.23-0.24
3 Mielenz et al., 2006 Quails 7934 (line 1) EN200 0.07±0.08 0.32±0.05 EW1 0.22±0.08 0.56±0.02 EW2 0.17±0.07 0.44±0.03 7214( line 2) EN200 0.12±0.11 0.16±0.05 EW1 0.06±0.06 0.54±0.05 EW2 0.45±0.12 0.24±0.06
EN1, EN2, and EN3 = transformed egg numbers produced between 18 and 25, 26 and 65, and 18 and 65 week of age; EW1 and EW2 = egg weights measured at 30 to 35 and 40 to 45 week; ESGl and ESGB = egg specific gravities measured at 30 to 35 and 40 to 45 week; (2)EN1 = eggs laid between 19 and 25 weeks; EN2 = 26 and 38 weeks; EN3 = 26 and 54 weeks; EW = egg weigh; SS = shell strength; (3) EN200 = egg production at an age of 42 to 200 days; EW1 = average egg weight for the first 11 weeks of their laying season; EW2 = the average egg weight from weeks 12 to 23.
The estimates of dominance variance and heritability for egg production traits are presented in Table 7. These traits were examined egg number (EN) produced at 18 to 25 (ENl), 26 to 65 (EN2), and 18 to 65 week of age (EN3); egg weight (EW) measured at 30 to 35 (EW1) and 40 to 45 week (EW2); and egg specific gravity (ESG) measured at 30 to 35 (ESG1) and 40 to 45 week (ESG2); egg production at an age of 42 to 200 days (EN200); average egg weight for the first 11 weeks of their laying season (EW1); the average egg weight from weeks 12 to 23 (EW2). Within three White Leghorn lines, estimates for dominance variance and heritability were similar. The heritability estimates were moderately high and mostly higher than the proportion of dominance variance compared to the total phenotypic variance.
However, the proportion of dominance variance was larger than the heritability for EN3 (line