Assessment of Marker-trait Associations for Drought and Heat Tolerance in Bread Wheat
N. SiNha, V. PriyaNka, k.T. ramya, T. LeeNa, J.a. BhaT, harikriShNa, N. JaiN*, P.k. SiNgh, g.P. SiNgh and k.V. PraBhu
Division of Genetics, Indian Agricultural Research Institute, New Delhi, India (Received 16 January 2018; 25 June 2018;
Communicated by A. Goyal)
Abiotic stresses are major constraints to wheat productivity in many parts of the world.
Tolerance to abiotic stresses can be achieved indirectly by selection for morpho-physiologi- cal traits. Physiological trait based breeding has been associated with improved performance under stress; and hence can combat and adapt wheat to drought and heat stress. Therefore, in the present study, phenotyping was carried out for agro-physiological traits in 52 diverse wheat germplasm lines under timely sown, rainfed and late sown environments for two years. Mean yield of the genotypes over the six environments were positively correlated with NDVI, days to maturity and negatively correlated with canopy temperature. The phenotypic data validated marker-trait associations of a number of meta-QTLs identified earlier for dif- ferent physiological and agronomic traits. Six and seven meta-QTL genomic regions were found to be consistent in their expression for two years under rainfed/restricted irrigation and late sown environments, respectively. Expression analysis of the underlying candidate gene AK248593.1 in meta-QTL26 region revealed two folds higher expression in the NILs carry- ing the co-localized SSR markers. The linked markers of the thirteen meta-QTL regions associated with different traits can be used for effective transfer of the QTLs through marker assisted selection in wheat breeding programmes.
Keywords: wheat, abiotic stress, QTLs, molecular marker
Introduction
Wheat is one of the most widely grown cereal crops and is a major source of energy and nutrition in human diet. Wheat cultivation has been characterized into twelve mega envi- ronments defined by their biotic, abiotic stresses and cropping system requirements; the megaenvironments pertain to spring wheat, winter wheat and facultative wheats (Rajaram et al. 1995). Worldwide, 70% of the cultivated wheat area experience water stress and wheat is the second-most crop grown under rainfed cropping areas after maize (Portmann et al. 2010). Though significant achievements have been made by breeders for raising yield potential of spring wheats under such stressful environments, greater emphasis now lie on the innovative breeding methods and tools to develop genotypes that can perform better.
*Corresponding author; E-mail: neelu_jain25@yahoo.com
Drought and heat are known to be complex phenomenon governed by many genes pertaining to physiological, morphological and agronomic characters. Trait based breed- ing for the discrete stress environments using physiological approaches may comprehend the conventional breeding technologies (Reynolds and Tuberosa 2008). A number of morpho-physiological traits have been efficiently linked to wheat improvement under stress and genetic gains associated with these have been measured in a range of environ- ments (Reynolds et al. 2012; Shearman et al. 2005). The physiological traits for water limited environments include those improving canopy temperature, photosynthetic ca- pacity, stay-green, stomatal conductance water uptake (Reynolds et al. 2012) while traits for improving heat tolerance are light intercepting traits, photo-protection systems, radia- tion use efficiency and, partitioning of total assimilates to yield (Cossani and Reynolds 2012). Physiological traits integrate many responses such as source-sink balance, vascu- lar movement of water, root biomass (Jain et al. 2014) and has been useful for pheno- typic selection as secondary traits (Lopes and Reynolds 2010).
During past two decades, several studies have identified quantitative trait loci (QTL) linked to stress adaptive physiological traits in wheat (Pinto et al. 2010; Gupta et al.
2012). There are recent reports that document more than 854 QTLs published by a num- ber of researchers in last twenty years for drought and heat stress adaptive traits in wheat (Acuna-Galindo et al. 2015). Meta-analysis of these reported QTLs could pin-point the genomic regions pertaining to the chromosomal loci by reducing the QTL confidence interval and may provide better understanding of the associated traits assumed to be linked at those loci. Acuna-Galindo et al. (2015) conducted meta-analysis of public QTLs and identified 66m-QTL genomic regions for 81 different traits associated with drought and heat stress adaptation. These QTLs can be utilized in marker assisted breeding pro- grammes for enhancing abiotic stress tolerance provided they express consistently irre- spective of genetic backgrounds. Thus, their effective use lies in the validation of the QTLs in different genetic background and environments and designing an appropriate marker assisted breeding strategy for their implementation. Therefore, the objective of the present study was to validate these marker-trait associations in an independent wheat germplasm set for their effective implementation in marker assisted selection programmes for improving drought and heat stress tolerance.
Materials and Methods Plant materials and experimental conditions
The plant material for this study comprised of 52 bread wheat genotypes, including thirty lines from international core set for abiotic stress, received from CIMMYT under Gen- eration challenge Program and twenty-two elite Indian lines developed for different agro- ecological conditions (Table S1*). The experiments were conducted at experimental farm, Indian Agricultural Research Institute (IARI), New Delhi, India for two years dur- ing 2012–2013 and 2013–2014 crop season. The latitude of the research farm is 280
*Further details about the Electronic Supplementary Material (ESM) can be found at the end of the article.
38’23”N, longitude 770 09’27”E and altitude is 228.61 m above mean sea level. The ex- periment was laid out in randomized complete block design with two replications in three rows of one-meter length each and with three different environments.The first environ- ment is timely sown during second week of November with recommended irrigation;
hereby referred to as TSI, the second environment is rainfed, sown during second week of November with only pre-sowing irrigation; hereby referred to as RF and the third envi- ronment is late sown, planted on a delayed date during first week of January; hereby re- ferred to as LSI. The standard cultivation practices prescribed for wheat crop in Indo- Gangetic plains were followed precisely.
A variety GW322 (Table S1) and its improved NILs were utilized for validation of expression of m-QTL26 region. GW322 is high yielding bread wheat cultivar (41–45 qtls/ha) with very high breeder seed indent. The variety is widely adapted for timely sown, irrigated conditions of Peninsular and Central zone of India, however, this variety is susceptible to drought stress. To improve its tolerance to drought, GW322 NILs were developed by introgressing favorable allele of QTL linked SSR marker Xbarc68- Xbarc101 from a suitable donor (HI1500) through a backcross breeding program in an earlier work in our laboratory (Todkar 2016). In a previous study, QTLs linked to Xbarc68-Xbarc101 markers were identified in C306/HUW206 population (Kumar et al.
2012) and GW322/HI1500 population (Manu 2017). Hence, both C306 and HI1500 are used as donors for transfer of QTL linked to Xbarc68-Xbarc101 in breeding programmes.
The SSR marker region Xbarc68-Xbarc101, co-localize with m-QTL26 region on 3B chromosome (Acuña-Galindo et al. 2015) and therefore was used to validate the expres- sion of m-QTL in the present study.
Environmental variables
Rainfed environment characterized the effect of moisture stress and delayed planting characterized the effect of heat stress on the genotypes. Average daily maximum and minimum temperature and relative humidity of the experimental site during crop growth season is available in supplementary Figure S1. The average maximum temperature dur- ing the late sown season was more than 25 °C during the grain-filling stage in both years which caused thermal stress. Data on temperatures were obtained from agro meteoro- logical observatory at IARI experimental farm. The experimental farm has calcic xe-rosol type of soil and soil moisture was recorded at regular intervals using TDR probe.
Phenotypic measurements
Phenotypic measurements were carried out for a number of physiological and agronomic traits under the three environments. Days to heading (DH) was recorded as number of days in which heads emerged in 50% of the plants, days to anthesis (DA) was recorded when anthesis began to set in 50% of the heads and days to maturity (DM) was recorded when 50% of the plants exhibit physiological maturity. The duration from DH until DM was calculated as grain filling duration (GFD). Hand held infrared thermometer (Kane
May Model Infratrace 8000, USA) was used for measurement of canopy temperature (CT). Data was recorded on the clear sunshine days with gentle wind speed between 11.00 AM to 2.00 PM. The chlorophyll contents were measured with the help of SPAD- meter (Minolta SPAD-502) three times during the study at reproductive stage. Chloro- phyll contents were measured on flag leaves between heading and early grain filling stages by placing the instrument in the middle of the leaf avoiding midrib etc. on five leaves and average reading was recorded. Three replications were taken each with an average measurement of fifteen leaves and were expressed in terms of SPAD units.
NDVI at six different growth stages starting from flag leaf emergence was recorded using GreenSeeker® (Trimble, Inc.). NDVI measurements were recorded on dates when all wheat genotypes were near or at growth stages (GS) Z-57 (near complete heading), Z-60 (beginning of anthesis), Z-65 (anthesis half-past), Z-75 (medium milk), Z-77 (late milk) and Z-83 (early dough) (Zadoks et al. 1974). At maturity, plants in one square meter were harvested from the experimental plots individually to record the grain yield and bio- logical yield.
DNA extraction and marker analysis
Total genomic DNA was extracted from bulked leaf samples (~20 mg each) from five plants at Z15–Z16 stage, using the protocol of Prabhu et al. (1998) with minor modifica- tions. DNA was precipitated, dissolved in TE buffer, and checked for its quality and quantity by 0.8% agarose gel electrophoresis using a standard containing 100 ng/μL genomic λ DNA. A set of 67 SSR markers previously reported as linked to important QTLs for moisture stress and thermal tolerance were chosen in the present study. All the microsatellite markers have previously been developed and their map position, chromo- somal location, chromosomal distance and repeat motifs can be found on graingenes web- site (http://www.graingenes.org).
PCR amplification was performed with initial denaturation at 94 °C for 3 min followed by 35 cycles of 94 °C for 1 min, 50–60 °C (depending upon the primer) for 1 min, 72 °C for 2 min, and a final extension at 72 °C for 10 min before cooling at 4 °C. Amplification products were resolved on 3% metaphor agarose gel electrophoresis and DNA bands were visualised by staining with ethidium bromide.
Data analysis
Association analysis was conducted using General Linear Model (GLM) with 1000 per- mutations with the help of software TASSEL (http://www.maizegenetics.net). Signifi- cance of the association was determined by p-value (< 0.05).
Expression analysis of mQTL region
Total RNA was extracted using TRI reagent (Sigma-Aldrich, St. Louis, MO, USA) from flag leaves of genotypes GW322, C306 (Xbarc68-Xbarc101), HI1500 (Xbarc68-
Xbarc101) and three improved GW322 NILs (two carrying Xbarc68-Xbarc101 and one without Xbarc68-Xbarc101). The first strand cDNA synthesis was performed using Verso cDNA synthesis kit (Thermo Scientific Inc., USA) following the manufacturer’s instruc- tion. Expression of m-QTL region was analysed by using real-time PCR with SYBR Premix (ABI, USA) and real-Time PCR primers were designed using Primer Quest pro- gram from IDT Technologies (www.idtdna.com/primerquest/). The primer sequence for AK248593.1 gene, that co-localized with mQTL26 region (Acuña-Galindo et al. 2015), was forward primer-5’CGTGCTCATCGGGATCAAG 3’ and reverse primer-5’
CGCTCGGTGAGGAGGTAT3’. The thermal profile for qRT-PCR set up was 95 °C for 15 min (initial denaturation), followed by 40 cycles with 95 °C for 10 s and 60 °C for 30 s. Transcript abundance was calculated using 2−ΔΔCT method (Livak and Schmittgen 2001) with 18S RNA (forward primer: 5’GTCCAGACATAGCAAGGATTGA3’, Re- verse primer: 5’ATCGCTCCACCAACTAAGAAC3’) as reference gene for normaliza- tion and GW322 (with low expression) was used as internal control.
Results Phenotypic trait evaluation
The mean values of the thirteen traits under study revealed significant differences across the three environments (Table S2). LSD values were significantly different for most of the traits in very late sown and rainfed environments compared to timely sown irrigated en- vironments in both the years. In the combined analysis of variance under the three envi- ronments, significant genotypic variability for the physiological and agronomic traits was observed (Table S3). The environment had strong impact on mean performance of geno- types for all the traits. There was a significant variation due to both genotype and environ- ment for the traits.
The combined mean yield of the genotypes over all the six environments were posi- tively correlated with NDVI at lateboot (Z57) (r = 0.331, p < 0.05), after anthesis (Z65) (r = 0.493, p < 0.001), late milk (Z77) (r = 0.287, p < 0.05), early dough (Z87) (r = 0.316, p < 0.05) stage, days to maturity (r = 0.321, p < 0.05) and negatively correlated with CT (r = –0.65, p < 0.001) (Table S4). DM, NDVI and CT showed significant association with yield in both RF and LSI.
Response of genotypes under rainfed environments over irrigated environments
The fifty-two genotypes showed trait variations in rainfed over irrigated environments for both the years. Trait means were significantly higher for days to anthesis (DA), days to maturity (DM) and NDVI at different growth stages under irrigated conditions (Table S2). In both crop seasons, NDVI at different growth stages and SPAD chlorophyll content had positive correlations with yield under rainfed conditions while canopy temperature and days to anthesis were negatively correlated (Table S4). Under rainfed conditions, 15% of the traits had ≥ 0.5 correlation coefficients with grain yield.
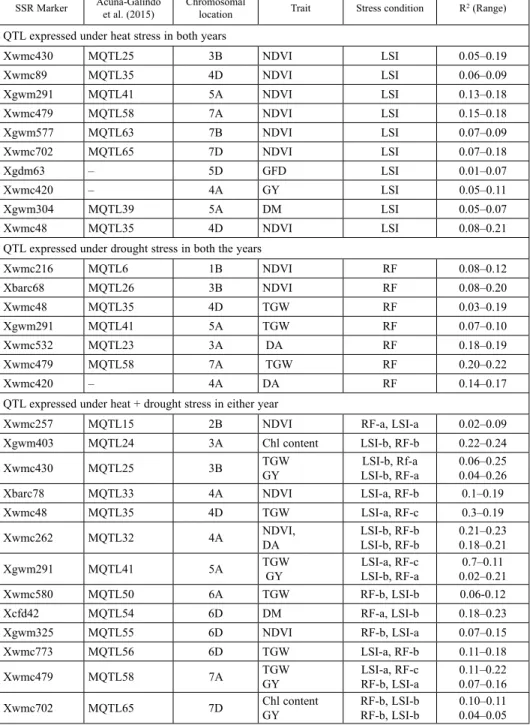
Table 1. SSR-linked genomic regions associated with drought and heat stress in wheat SSR Marker Acuña-Galindo
et al. (2015) Chromosomal
location Trait Stress condition R2 (Range)
QTL expressed under heat stress in both years
Xwmc430 MQTL25 3B NDVI LSI 0.05–0.19
Xwmc89 MQTL35 4D NDVI LSI 0.06–0.09
Xgwm291 MQTL41 5A NDVI LSI 0.13–0.18
Xwmc479 MQTL58 7A NDVI LSI 0.15–0.18
Xgwm577 MQTL63 7B NDVI LSI 0.07–0.09
Xwmc702 MQTL65 7D NDVI LSI 0.07–0.18
Xgdm63 – 5D GFD LSI 0.01–0.07
Xwmc420 – 4A GY LSI 0.05–0.11
Xgwm304 MQTL39 5A DM LSI 0.05–0.07
Xwmc48 MQTL35 4D NDVI LSI 0.08–0.21
QTL expressed under drought stress in both the years
Xwmc216 MQTL6 1B NDVI RF 0.08–0.12
Xbarc68 MQTL26 3B NDVI RF 0.08–0.20
Xwmc48 MQTL35 4D TGW RF 0.03–0.19
Xgwm291 MQTL41 5A TGW RF 0.07–0.10
Xwmc532 MQTL23 3A DA RF 0.18–0.19
Xwmc479 MQTL58 7A TGW RF 0.20–0.22
Xwmc420 – 4A DA RF 0.14–0.17
QTL expressed under heat + drought stress in either year
Xwmc257 MQTL15 2B NDVI RF-a, LSI-a 0.02–0.09
Xgwm403 MQTL24 3A Chl content LSI-b, RF-b 0.22–0.24
Xwmc430 MQTL25 3B TGW
GY LSI-b, Rf-a
LSI-b, RF-a 0.06–0.25 0.04–0.26
Xbarc78 MQTL33 4A NDVI LSI-a, RF-b 0.1–0.19
Xwmc48 MQTL35 4D TGW LSI-a, RF-c 0.3–0.19
Xwmc262 MQTL32 4A NDVI,
DA LSI-b, RF-b
LSI-b, RF-b 0.21–0.23 0.18–0.21
Xgwm291 MQTL41 5A TGW
GY LSI-a, RF-c
LSI-b, RF-a 0.7–0.11 0.02–0.21
Xwmc580 MQTL50 6A TGW RF-b, LSI-b 0.06-0.12
Xcfd42 MQTL54 6D DM RF-a, LSI-b 0.18–0.23
Xgwm325 MQTL55 6D NDVI RF-b, LSI-a 0.07–0.15
Xwmc773 MQTL56 6D TGW LSI-a, RF-b 0.11–0.18
Xwmc479 MQTL58 7A TGW
GY LSI-a, RF-c
RF-b, LSI-a 0.11–0.22 0.07–0.16
Xwmc702 MQTL65 7D Chl content
GY RF-b, LSI-b
RF-b, LSI-b 0.10–0.11 0.04–0.05 a: 2012–2013; b: 2013–2014; c: both 2012–2013 & 2013–2014.
Response of genotypes under late sown environments over timely sown environments Trait means decreased under late sown environments over timely sown environments except SPAD chlorophyll content and CT. NDVI at all the observed growth stages includ- ing late boot, early milk, late milk, and early dough stage were positively correlated with grain yield under late sown environments. NDVIZ60, NDVIZ65 and NDVIZ83 did not show reduction over timely sown environments in 2012–2013. Overall, 35% of the traits had
≥ 0.5 correlations with grain yield under late sown environments.
Validation of marker trait associations
Trait means obtained under temperature and moisture stress were associated with previ- ously identified QTLand meta-QTL (physiological and yield traits) linked SSRs. SSRs representing diverse genomic regions on 18 chromosomes revealed significant associa- tions for drought and heat stress. There were a number of traits that co-localized to the same genomic region (Table S5). Forty-three SSR markers were associated with physio- logical and yield traits under high temperature stress in 2012–2013 while twenty-two SSRs got associated in 2013–14. However, seven meta-QTL genomic regions associated with NDVI and DM were found to be consistent in their performance in LSI during both the years (Table 1). The phenotypic variance ranged from 5 to 21% for NDVI and 5 to 7%
for DM in the two years.
Thirty-two QTLs were associated with different phenotypic traits during 2012–2013 crop season compared to twenty-one loci during 2013–2014 for moisture stress (Table S5). Six genomic regions performed consistently in RF during both crop seasons (Table 1). The phenotypic variance ranged from 8 to 20% for NDVI, 3 to 22% for TGW and 14 to 19% for DA. In total, thirteen m-QTL regions expressed constantly under high temperature and moisture stress for phenotypic traits as grain yield, TGW, NDVI, DA and DM.
Expression of m-QTL region
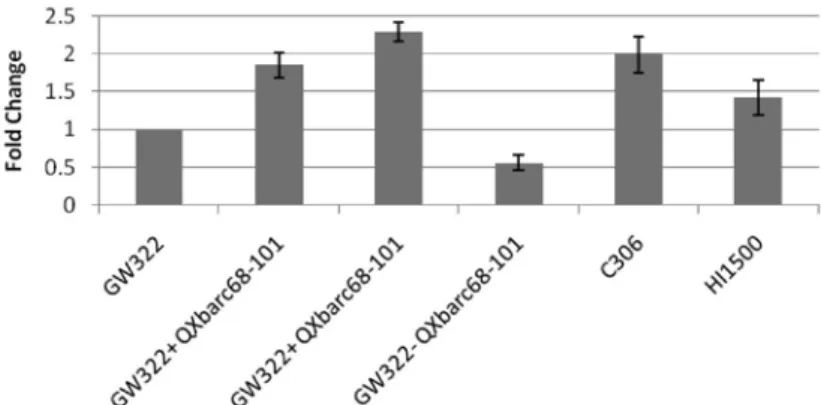
Among the thirteen m-QTL regions (Table 1), seven meta-QTL regions harbor putative candidate genes predicted earlier [m-QTL24(AK252047.1), m-QTL26 (AK248593.1), m-QTL32 (Bradi3g42820.1), m-QTL33 (AK248154.1), m-QTL35 (Bradi4g20980), m-QTL39 (AK250194.1), m-QTL63 (AK248641.1)]. In the present study, expression of m-QTL26 region, underlying a candidate gene AK248593.1 (Ta.28316.2), was analyzed in GW322 and its improved NILs carrying m-QTL26. QTL linked SSR markers Xgwm644 and Xbarc68-Xbarc101 co-localize with mQTL26 region and are linked to important physiological traits. The latter marker has been used to develop improved GW322 lines by transferring the favorable allele of this QTL from a suitable donor as described above.
The available GW322 NILs were used and it was observed that the improved NILs dis- played two fold higher expression compared to parent GW322 (Fig. 1) as well as superior yield performance (55.9 q/ha) than its parent (50.5 q/ha) under limited irrigation.
Discussion
Abiotic stresses particularly drought and heat are one of the major cause of losses in wheat productivity. Most of the traits associated with improved performance under stress are quantitative in nature and identification of linked QTLs will be useful to deploy mark- er-assisted selection for development of improved lines. A number of recent studies have reported >800 QTLs for stress adaptive, agronomic, and yield traits under stress (re- viewed in Pinto et al. 2010; Gupta et al. 2012; 2017). Many of these QTLs express in specific genetic background and environments leading to inconsistency in their pheno- typic expressions. Hence, precise and consistent QTLs across environments are needed for their successful use in various genetic improvement programs. Therefore, in the pre- sent study, QTLs reported in earlier studies were analyzed in germplasm lines and breed- ing populations that allowed the identification of QTLs with the consistent phenotypic expression over environments and genetic backgrounds.
Physiological trait based adaptations to combat drought and heat stress have been stud- ied at different growth phases of the wheat crop cycle (Reynolds et al. 2012; Cossani and Reynolds 2012). NDVI and chlorophyll content both provide an indirect estimation of leaf health for photosynthesis coupled with leaf nitrogen content and early senescence and can be used as proxy traits in drought screening (Araus et al. 2008). During the pre- sent study, NDVI at various growth stages was positively correlated with yield and was more strongly associated under stress environments. Association of NDVI with yield un- der stress have been known in earlier studies (Pinto et al. 2010; Olivares-Villegas et al.
2007; Ramya et al. 2015). Canopy temperature measured at grain filling stage was also observed to be a significant trait under dry environments. The present study found that the genomic regions linked with NDVI, TGW and GY were highly consistent in their pheno- typic expression under stress.
Genetic dissection of stress adaptive traits revealed that 1B, 3B and 4A harbors QTLs for NDVI, CT, chl content and other physiological traits (Pinto et al. 2010). According to Langridge and Reynolds (2015), genomic regions for physiological traits on the above
Figure 1. Relative expression of mQTL26 homologous to barley gene, AK248593.1 in wheat
chromosomes co-localize with QTLs on yield under heat and drought stress. In the pre- sent study, consistent expression of QTLs at regions 3B, 4D, 5A, 7A, 7B and 7D under heat stress and regions 1B, 3A, 3B, 4D, 5A and 7A under rainfed was observed during the two years. These regions harbor desirable alleles for physiological traits NDVI, DM, DA, GFD as well as for TGW and yield per plot. Taken together the data of two years, the phenotypic variance explained by the QTL varies from 1 to 26 percent for different traits.
This suggests the variable expression of traits in the same meta-QTL genomic region, at each growth stage and year. The variation in the expression of QTL is perhaps due to uneven moisture and heat stress experienced by the crop in each year under the study.
Response of plants to abiotic stress induces gene expression at certain loci that helps in adaptation to multiple stress environments. It is apparent from previous reports that genomic regions for drought and heat tolerance are strongly associated and are induced upon imposition of either of the stress. However, the mere presence of overlapping set of genes is unable to explain the variable adaptation response without taking into account specific drought and heat responsive regions. In addition to the expression of individual cluster of loci under drought and heat stress, QTL hot-spots had been found in durum wheat suggesting common marker-trait associations for stress indices (Sukumaran et al.
2018). The results of the present study are in agreement to the previous studies (Pinto et al. 2010; Acuña-Galindo et al. 2015; Sukumaran et al. 2018) that show synergistic re- sponse of plants to heat and drought stress suggesting common and specific genomic lo- cations for adaptation.
Meta-analysis of previously identified QTLs deciphered 66 meta-QTL (m-QTL) re- gions from individual QTL clusters that were distributed throughout the genome (Acuna- Galindo et al. 2015). There were 13 m-QTL regions found in this study indicating that such QTL regions discovered across genetic background and environments could be used for targeted improvement under abiotic stress. Only a few of the identified meta-QTLs harbored candidate genes for drought and heat tolerance traits (Acuna-Galindo et al.
2015). A candidate gene AK248593.1 (Ta.28316.2), underlies the m-QTL26 region on chromosome 3B. Individual QTL studies has reported major and stable QTLs linked to Xbarc68-Xbarc101 markers lying on this particular chromosome 3B (m-QTL26) region (Kumar et al. 2012). The stable QTL region (Xbarc68-barc101) was introgressed through backcross breeding program in an elite variety, GW322 for improved adaptation under stress and the expression of the candidate gene corresponding to the m-QTL region impli- cated its successful integration. The putative gene revealed higher expression in lines positive for the m-QTL26 region confirming the phenotypic expression of meta-QTL re- gion under drought stress. The present study successfully validated some of the linked markers that were identified in diverse genetic backgrounds and thus could be imple- mented in future breeding programmes for improvement of wheat under abiotic stress.
Acknowledgements
The financial support provided by the ICAR project, National Initiatives on Climate Re- silience Agriculture (NICRA), is gratefully acknowledged.
References
Acuña-Galindo, M.A., Mason, R.E., Subramanian, N.K., Hays, D.B. 2015. Meta-analysis of wheat QTL regions associated with adaptation to drought and heat stress. Crop Sci. 55:477–492.
Araus, J.L., Slafer, G.A., Royo, C., Serret, M.D. 2008. Breeding for yield potential and stress adaptation in cereals. Critical Reviews in Plant Sci. 27:377–412.
Cossani, C.M., Reynolds, M.P. 2012. Physiological traits for improving heat tolerance in wheat. Plant Physiol.
160:1710–1718.
Gupta, P.K., Balyan, H.S., Gahlaut, V., Kulwal, P.L. 2012. Phenotyping, genetic dissection, and breeding for drought and heat tolerance in common wheat: status and prospects. Plant Breed. Rev. 36:85–168.
Gupta, P.K., Balyan, H.S., Gahlaut, V. 2017. QTL analysis for drought tolerance in wheat: Present status and future possibilities. Agronomy 7:5.
Jain, N., Singh, G.P., Yadav, R., Pandey, R., Ramya, P., Shine, M.B., Pandey,V.C., Rai, N., Jha, J., Prabhu, K.V.
2014. Root trait characteristics and genotypic response in wheat under different water regimes. Cereal Res.
Comm. 42:426–438.
Kumar, S., Sehgal, S.K., Kumar, U., Prasad, P.V., Joshi, A.K., Gill, B.S. 2012. Genomic characterization of drought tolerance-related traits in spring wheat. Euphytica 186:265–276.
Langridge, P., Reynolds, M.P. 2015. Genomic tools to assist breeding for drought tolerance. Curr. Opin.
Biotech. 32:130–135.
Livak, K.J., Schmittgen, T.D. 2001. Analysis of relative gene expression data using real-time quantitative PCR and the 2−ΔΔCT Method. Methods 25:402–408.
Lopes, M.S., Reynolds, M.P. 2010. Partitioning of assimilates to deeper roots is associated with cooler canopies and increased yield under drought in wheat. Func. Plant Biol. 37:147–156.
Manu, B. 2017. QTL mapping for drought tolerance traits using backcross inbred lines (BILs) in wheat (Triticum aestivum L.). Ph. D Thesis. Indian Agricultural Research Institute. New Delhi.
Olivares-Villegas, J.J., Reynolds, M.P., McDonald, G.K. 2007. Drought-adaptive attributes in the Seri/
Babaxhexaploid wheat population. Func. Plant Biol. 34:189–203.
Pinto, R.S., Reynolds, M.P., Mathews, K.L., McIntyre, C.L., Olivares-Villegas, J.J., Chapman, S.C. 2010. Heat and drought adaptive QTL in a wheat population designed to minimize confounding agronomic effects.
Theor. Appl. Genet. 121:1001–1021.
Portmann, F.T., Siebert, S., Doll, P. 2010. MIRCA2000-Global monthly irrigated and rainfed crop areas around the year 2000: A new high-resolution data set for agricultural and hydrological modeling. Glob.
Biogeochem. Cycles 24:GB1011 1–24.
Prabhu, K.V., Somers, D.J., Rakow, G., Gugel, R.K. 1998. Molecular markers linked to white rust resistance in mustard Brassica juncea. Theor. Appl. Genet. 97:865–870.
Rajaram, S., Ginkel, M.V., Fischer, R.A. 1995. CIMMYT’s wheat breeding mega-environments (ME).
In: Proceedings of the 8th International Wheat Genetics Symposium 8, Beijing, China. pp. 20–25 Jul. 1993.
Ramya, K.T., Jain, N., Ramya, P., Singh, P.K., Arora, A., Singh, G.P., Prabhu, K.V. 2015. Genotypic variation for normalized difference vegetation index and its relationship with grain yield in wheat under terminal heat stress. Indian J. Genet. 75:174–182.
Reynolds, M., Tuberosa, R. 2008. Translational research impacting on crop productivity in drought-prone environments. Curr. Opinion Plant Biol. 11:171–179.
Reynolds, M.P., Pask, A.J.D., Mullan, D.M. 2012. Physiological Breeding In: Interdisciplinary Approaches to Improve Crop Adaptation. Mexico, D.F. CIMMYT.
Shearman, V.J., Sylvester-Bradley, R., Scott, R.K., Foulkes, M.J. 2005. Physiological processes associated with wheat yield progress in the UK. Crop Sci. 45:175–185.
Sukumaran, S., Reynolds, M.P., Sansaloni, C. 2018. Genome-wide association analyses identify QTL hotspots for yield and component traits in durum wheat grown under yield potential, drought, and heat stress envi- ronments. Front. Plant Sci. 9:81.
Todkar, L.P. 2016. Introgression of drought tolerance traits using marker assisted backcross breeding (MABB) in bread wheat. Ph.D Thesis. Indian Agricultural Research Institute. New Delhi.
Zadoks, J.C., Chang, T.T., Konzak, C.F. 1974. A decimal code for the growth stages of cereals. Weed Res.
14:415–421.
Electronic Supplementary Material (ESM)
Electronic Supplementary Material (ESM) associated with this article can be found at the website of CRC at https://akademiai.com/loi/0806
Electronic Supplementary Table S1. List of the genotypes used in the present study
Electronic Supplementary Table S2. Trait means measured under timely-sown irrigated, rainfed and late-sown environments among 52 genotypes
Electronic Supplementary Table S3. Genotype by environment interaction analysis for the traits under study Electronic Supplementary Table S4. Pearson correlation coefficients of traits with yield under different environ-
ments
Electronic Supplementary Table S5. List of QTL-linked SSRs associated with different traits under timely sown irrigated, rainfed and late-sown environments during 2012–2013 and 2013–2014 crop seasons