Research article
Metabolic indicators of drought stress tolerance in wheat:
Glutamine synthetase isoenzymes and Rubisco
Zoltán Nagy
a, Edit Németh
a, Adrienn Guóth
a, Lajos Bona
b, Barnabás Wodala
a, Attila Pécsváradi
a,*aDepartment of Plant Biology, University of Szeged, H-6701 Szeged, Közép Fasor 52, Hungary
bCereal Research Non-Profit Company, P.O. Box 391, H-6701 Szeged, Hungary
a r t i c l e i n f o
Article history:
Received 22 January 2013 Accepted 4 March 2013 Available online 14 March 2013
Keywords:
Drought stress Glutamine synthetase Rubisco
Senescence Wheat
a b s t r a c t
Drought stress has a considerable impact on the ecosystem and agriculture. Continuous water deficit induces early leaf senescence in plants. During this process, chloroplasts are degraded and photosyn- thesis drastically drops. The objective of this investigation was to look into the regulation of nitrogen and carbon metabolism during water deficit. Rubisco (ribulose-1,5-bisphosphate carboxylase/oxygenase;
EC 4.1.1.39) and the total protein contents inform us of the sink-source relation in plants. Glutamine synthetase (GS, EC 6.3.1.2) isoenzymes are good markers of plastid status (GS2) and the nitrogen metabolism (GS1).
Tolerant and sensitive wheat (Triticum aestivumL.) genotypes were tested, which are widely used in agriculture. The amount of protein, Rubisco and GS isoforms in leaves were measured during the grain filling period, as indicative traits that ultimately determine the onset and stage of senescence. The symptoms of senescencefirst appeared on the oldest andfinally on the youngest leaves. Drought stress disrupted the sequentiality of senescence in the sensitive varieties. An untimely senescence appeared in flag leaves, earlier than in the older leaves. Total protein and Rubisco contents decreased and the GS2 isoenzyme declined considerably in the youngest leaves. In the tolerant varieties, however, these physiological parameters did not change under drought, only the sequential senescence of leaf levels accelerated in some cases compared to the control, well-watered plants. Our results revealed that GS is a good indicator of drought stress, which can be applied for the characterization of wheat cultivars in terms of drought stress tolerance.
Ó2013 Elsevier Masson SAS. All rights reserved.
1. Introduction
Drought stress can have a considerable impact on the ecosystem and agriculture. Improving yield under drought is a major goal of plant breeding. In many studies the identification of tolerant and susceptible cultivars is based on a few physiological measures related to drought response. Drought induced leaf senescence can inhibit photosynthesis and the supply of assimilates to grains[1].
Yield is the most important economic trait of wheat plants, and grain production is the main selection criteria for drought resis- tance. There are several physiological traits related to water stress, and scientists make considerable effort tofind direct correlations
between these parameters and grain yield in order to facilitate the screening and selection of cultivars for drought tolerance. But besides the sensitivity of the physiological parameters of vegetative organs, the sensitivity of generative organs should also be taken into consideration, because it is the responses of the whole plant that finally determines crop production. Despite its importance, very few studies observed the changes in different physiological parameters in different organs with the aim to provide a more complete and accurate explanation of the responses of the plants[2].
Water stress during the grainfilling period reduces photosyn- thesis, induces early senescence and shortens the grain filling period[3]. Some plants show a sequential type of leaf senescence.
During growth of the whole plant, new young leaves are succes- sively formed at the top, while lower and older leaves develop gradually toward the phase of senescence. In the course of this process, leaves from the base to the top pass different develop- mental stages, from maturation up to the last phase of senescence including cell death[4]. In monocarpic plants/cereals, developing grains represent the most important sink for carbon and nitrogen and other nutrients after anthesis [5], and the onset of grain Abbreviations:DPA, day post anthesis; FW, fresh weight; GMH, g-glutamyl
monohydroxamate; GS, glutamine synthetase; PVDF, polyvinylidene difluoride;
RWC, relative water content; Rubisco, ribulose-1,5-bisphosphate carboxylase/
oxygenase.
*Corresponding author. Tel.:þ36 62544802; fax:þ36 62544307.
E-mail addresses: pecsvaradi@bio.u-szeged.hu, apecsvaradi@me.com (A. Pécsváradi).
Contents lists available atSciVerse ScienceDirect
Plant Physiology and Biochemistry
j o u r n a l h o m e p a g e : w w w . e l s e v i e r . c o m/ l o ca t e / p l a p h y
0981-9428/$esee front matterÓ2013 Elsevier Masson SAS. All rights reserved.
http://dx.doi.org/10.1016/j.plaphy.2013.03.001
development is the most important factor initiating the process of senescence[6]. The role of N in agricultural production is intimately connected with photosynthesis. N determines the synthesis of amino acids thus proteins (for example Rubisco) and, ultimately, of all cellular components[7].
Leaf senescence is the final stage of leaf development.
Biochemical, physiological, morphological and ultrastructural an- alyzes indicate that enhanced degradation of chloroplast compo- nents leading to a reduction in photosynthetic capacity is an integral part of the senescence process in green tissue. The amount and activity of Rubisco (ribulose-1,5-bisphosphate carboxylase/
oxygenase) decreases during senescence[8]. Chloroplasts are one of the earliest sites of catabolism in leaf senescence and mito- chondria appear to remain intact until a very late stage of senes- cence [9]. Senescence is regarded as a nitrogen mobilization process, since glutamine contents increase in leaves by late senescence, while total amino acid content is slightly reduced.
Ammonium content was also reduced by leaf senescence, similarly to cotyledon senescence[10].
Early studies have showed that glutamine synthetase (GS, EC 6.3.1.2) is widely distributed in the plant and occurs in two major forms, one in the chloroplast (GS2) and one in the cytosol (GS1). GS plays a central role in nitrogen metabolism[11,12]and there are multiple regulatory controls at the gene and protein level to modify its activity. The expression of GS1 is enhanced in later stages offlag leaf development, which may facilitate the recovery of N during senescence and also signal to the plant that the conditions are right for successful seedfilling and maturation[13]. During the vegetative stage, GS2 is the pre-dominant isoenzyme in the leaf mesophyll cells, where it assimilates ammonia originating from nitrate reduc- tion and photorespiration. GS1 is responsible for the generation of glutamine in the remobilization of nitrogen via the phloem. Because of the severe reduction in biomass production during the vegetative stage, there is a shortage of nitrogen and carbon assimilates in senescing source organs, which causes a limitation of remobilization into sink organs. Thus, severe reduction in grainfilling could occur in the knockout mutants. Immunolocalisation studies in rice have shown that cytosolic GS has multiple metabolic functions such as assimilating ammonia into glutamine for transport and distribution throughout the plant [14]. Anthesis triggers the start of global changes in wheat leaf metabolism characterized by the co-ordinated and gradual decline of RNA, soluble proteins, chlorophyll, Rubisco subunits and GS2. There is a correlation between the amount of leaf chloroplastic GS and Rubisco protein during senescence, which confirms their co-ordinated regulation during grain development andfilling in wheat. Studies on natural and induced senescence in leaves have identified a co-ordinated sequence of biochemical and structural events in chloroplast degradation as well[15].
Wheat (Triticum aestivumL.) is one of the main crops consumed by humans and it is cultivated in different environments. In this study we observed four tolerant (MV Emese, Plainsman V, Kharchia, Kobomugi) and two sensitive (GK Élet, Cappelle Desprez) genotypes, which are widely used in agriculture. We examined protein, Rubisco and GS amounts and activities in leaves during the grainfilling period in search for the traits that ultimately determine the sequential senescence and the stay-green stage.
2. Results
2.1. Changes in total protein content under drought stress
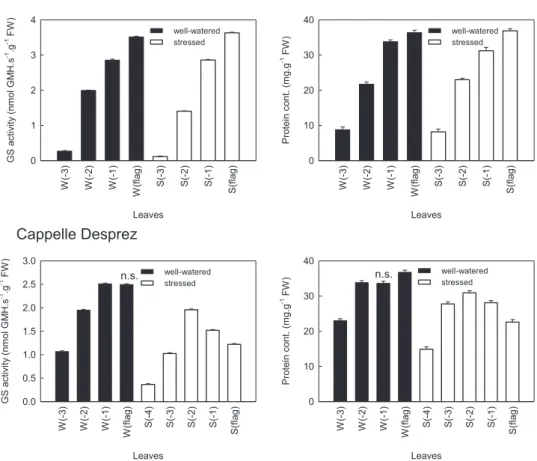
The results of the determination of total protein contents are presented in Figs. 1 and 2. The senescence process results in a decrease in total protein content in the aging leaves.
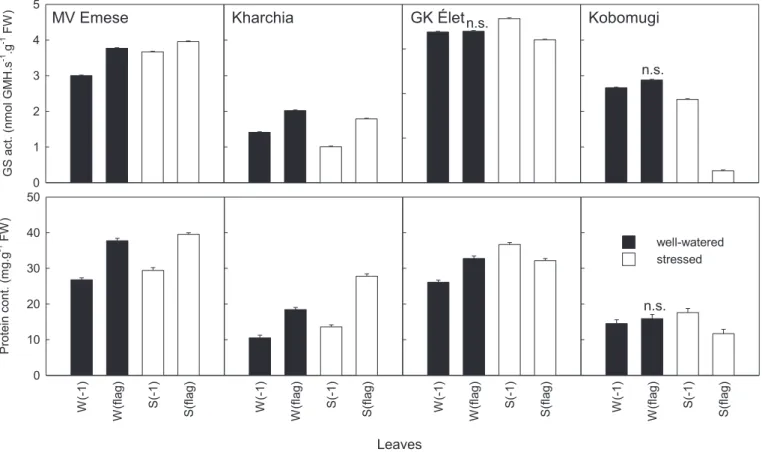
The total protein content of the leaves, measured at the 9th DPA, decreased with the age of leaves in well-watered plants. The lower leaves of the sensitive genotype contained more protein than the leaves in the same position of the tolerant one. The same tendency was observed in the protein content of the two upper (younger) leaves, (W(1) and W(flag)) (Fig. 2) of the other genotypes. In these samples the protein content of the older leaf (W(1)) was also less than the youngerflag leaf.
Drought stress changed the protein content gradient in the sensitive or less tolerant cultivars: protein content was lower in the flag leaf than in the older (S(1)) leaf. However, the protein con- tents measured in leaves of the tolerant genotype (Plainsman V) followed the same tendency as well-watered plants, only the slope of the curve was slightly steeper. Other wheat cultivars showed similar results (Fig. 2): in tolerant ones the protein contents were lower in the older leaves, while in the sensitive breeds theflag leaf had less protein than the older leaf tissues.
The values of total protein contents were lower in the two landrace breeds (Kharchia and Kobomugi) relative to the fresh weight than in the other genotypes.
2.2. Rubisco content
The proteins of leaf samples were separated with non- denaturing polyacrylamide gel electrophoresis. After Coomassie staining Rubisco appeared as the largest, dominant band as visible inFigs. 3and 4. The changes in Rubisco content were in accordance with the changes in total protein content. In the older leaves of well-watered plants the Rubisco content decreased with age in all genotypes (Fig. 4). Under drought stress the Rubisco content of the flag leaves of sensitive breeds was lower than that of the older leaves. In the tolerant genotypes high amounts of Rubisco were found in the flag leaf and less in the older leaves.
2.3. GS activity
Total glutamine synthetase (GS) activity was determined from the leaf samples of well-watered and drought stressed wheat cultivars. The results of these colorimetric assays are presented in Figs. 1 and 2. The enzyme activities were calculated on fresh weight basis. Calculation based on protein content would be misleading in stressed samples because of the dramatic changes in the amount of the major protein, Rubisco, which may give the 50% of the total protein content of leaf cells. The senescence process resulted in decreased enzyme activity in the leaves.
The activity of GS isoenzymes is an appropriate parameter to reveal the degradation andfinally the collapse of the assimilation processes in the leaves during senescence. The changes in total GS activity were similar to the changes in total protein content. In well- watered plants the enzyme activities in the older leaves of plants was lower than in the youngerflag leaf in the sensitive and tolerant breeds as well (Fig. 1).
Fig. 1also shows the responses of GS to the drought stress. In the sensitive genotype, the GS activity declined considerably, in fact it was even lower than the values of thefirst (1) and second (2) older leaf. However, in the tolerant genotype, the GS activity in the flag leaf (S(flag)) remained the highest under the drought stress too. In different wheat cultivars the results showed the same tendency (Fig. 2): in tolerant genotypes the GS activities were lower in the older leaves, but in theflag leaf (S(flag)) of the sensitive breeds the GS activity was less than the leaf below it (S(1)). The values of enzymes activities were extremely low in Kobomugi.
2.4. Identification of GS proteins
Two GS isoforms can be detected from the crude protein extract of leaf tissue. GS1 is cytoplasmic, GS2 is located in the chloroplasts.
In wheat leaves, as well as in other C3 plants, GS2 is the dominant form because of its task in photorespiration. Under normal physi- ological conditions, the level/activity of GS1 is low; however, during senescence its ratio increases. Fig. 3 shows the positions of GS isoforms from leaves, isolated chloroplasts and roots. In the latter the cytoplasmic form (GS1) is dominant. Following the non- denaturing discontinuous polyacrylamide gel electrophoresis, the position of GS proteins, the cytoplasmic GS1 and the plastidical GS2 isoforms, was detected in two ways: the activity in the gel (Fig. 3B) and protein blot (Fig. 3C). The migration distances of wheat GS isoforms were sufficiently large: in the leaf and chloroplast sam- ples, GS1 remained closer to the start, just below the Rubisco band (the largest blue band onFig. 3A in leaf and chloroplast samples), while GS2 was located around the middle of the gel with a reten- tion factor (Rf) of 0.5.
2.5. Alteration in the ratio of GS isoforms
The amount of GS isoenzyme proteins changes with the age of the leaf as shown inFig. 4. In the control plants the GS1 and GS2 were the highest in the youngest, fully developedflag leaf. The GS2 decreased with the age of leaves in all genotypes. During
senescence GS2 disappears, while the cytoplasmic GS1 levels remain steady and decrease only at thefinal stage of the process.
In the tolerant plants drought stress did not cause crucial changes in the ratio of GS isoforms. In the sensitive genotype the GS2 decreased inflag leaves. GS1 levels did not change or decreased only slightly. In older leaves the amount of the GS1 and GS2 proteins were similar to the amounts in well-watered plants.
3. Discussion
The quantity and quality of crop yield depends on the stress resistance. Thefinding that drastic physiological changes may occur during natural or stress-induced leaf senescence has prompted research groups to investigate in more detail the regulatory mechanisms controlling the shift between N assimilation and N recycling in senescing leaves in different plant species[16]. Chlo- roplasts are one of the earliest sites of catabolism during leaf senescence: chloroplasts are degraded, and photosynthetic and assimilating processes drastically decreases[17]. The chloroplast may be considered to be an important storage organelle, as 70e80%
of the nitrogen in mature leaves is located in the chloroplasts. The apoproteins of pigments in photosystems and light harvesting complexes represent about 30% of total chloroplast nitrogen, while Rubisco comprises up to 50%. Under the electron microscope, mitochondria appear to remain intact until a very late stage of senescence [9]. Senescence-dependent chlorophyll degradation Leaves
W(-3) W(-2) W(-1) W(flag) S(-3) S(-2) S(-1) S(flag)
GS activity (nmol GMH.s-1.g-1 FW) 0 1 2 3 4
well-watered stressed
Leaves
W(-3) W(-2) W(-1) W(flag) S(-3) S(-2) S(-1) S(flag)
Protein cont. (mg.g-1 FW) 0 10 20 30 40
well-watered stressed
Leaves
W(-3) W(-2) W(-1) W(flag) S(-4) S(-3) S(-2) S(-1) S(flag)
GS activity (nmol GMH.s-1.g-1 FW) 0.0 0.5 1.0 1.5 2.0 2.5 3.0
well-watered stressed
Leaves
W(-3) W(-2) W(-1) W(flag) S(-4) S(-3) S(-2) S(-1) S(flag)
Protein cont. (mg.g-1 FW) 0 10 20 30 40
well-watered stressed
Plainsman V
Cappelle Desprez
n.s. n.s.
Fig. 1.Glutamine synthetase activities and protein contents of the tolerant (Plainsman V) and sensitive (Cappelle Desprez) wheat cultivars. GS extracted from the leaves of well- watered (W, black columns) and drought stressed (S, white columns) plants. The different enzyme activities measured by the GMH formation from different leaf levels: theflag leaves are the youngest leaves, the (3) leaves are the oldest leaves (the fourth leaf from the top of each plant). Samples of the individual leaves were measured on 9th day post anthesis (DPA). Each value represents the mean of three replicates. FW, fresh weight. Most values differ significantly at the levelp0.01; only the not significant samples are labeled (n.s.).
startsfirst in the primary leaf and subsequently in the following leaves untilfinally theflag leaf enters senescence[4]. The protein components are degraded and chlorophyll molecules are broken down [18]. Therefore, the decrease in total protein content is an excellent senescence parameter. In contrast to many other investigations, we followed the course of leaf senescence by measuring protein content not only in one leaf, but monitored the entire complex pattern of sequential leaf senescence during whole plant ontogeny of wheat with the goal to dissect senescence- related physiological and molecular reactions. Wiedemuth et al.
[4]made a similar study in 2005. The other drought stress related parameters like water potential and relative water content (RWC) of leaves, abscisic acid and malondialdehyde levels have been determined in the same experimental system, and described in our previous publication[2,24].
As shown inFig. 1, in the series of four leaves (flag), (1), (2), and (3) protein content is high in mature leaves, and then decreases to almost zero during the phase of senescence in each Leaves
W(-1) W(flag) S(-1) S(flag) W(-1) W(flag) S(-1) S(flag) W(-1) W(flag) S(-1) S(flag)
well-watered stressed
W(-1) W(flag) S(-1) S(flag)
Protein cont. (mg.g-1 FW) 0 10 20 30 40 50
Kharchia
MV Emese GK Élet Kobomugi
GS act. (nmol GMH.s-1 .g-1 FW) 0 1 2 3 4 5
n.s.
n.s.
n.s.
Fig. 2.Glutamine synthetase activities and protein contents of different wheat cultivars. GS extracted from the leaves of well-watered (W, black columns) and drought stressed (S, white columns) plants. The different enzyme activities measured by the GMH formation from different leaf levels: theflag leaves are the youngest leaves, the (1) leaves are the second leaves from the top of plants. Each value represents the mean of three replicates. Samples of the individual leaves were measured on 9th day post anthesis (DPA). FW, fresh weight. Most values differ significantly at the levelp0.01; only the not significant values are labeled (n.s.).
Fig. 3.Electrophoretic separation and detection, localization of cytoplasmic GS1 and chloroplastic GS2. Protein extract was prepared from leaves, isolated chloroplasts and roots of 7-day-old wheat seedlings, and separated with discontinuous non-denaturing polyacrylamide gel electrophoresis. (A) Coomassie G-250 stained gel. (B) Detection of GS activity in the gel (ferric GMH complex). (C) Protein blot, using anti-GS primary antibody (alkaline phosphatase visualization).
Fig. 4.Electrophoretic separation and detection of cytoplasmic GS1, chloroplastic GS2 and Rubisco. Protein extract was prepared from a tolerant (Plainsman V) and a sensitive (Cappelle Desprez) wheat genotypes. The samples were isolated from well- watered (Control) and water stressed plants. The columns correspond to different leaves: the youngest leaf is theflag leaf, and the oldest are the3 and4 leaves. GS1 and GS2 were identified by protein blot, using anti-GS primary antibody (alkaline phosphatase visualization). The Rubisco was visualized by Coomassie G-250 staining.
The samples of the individual leaves were examined on 9th day post anthesis (DPA).
single leaf in well-watered conditions. This process does not occur simultaneously in all leaves, but rather follows a sequential pattern.
Senescence-dependent protein degradation startsfirst in the pri- mary leaf and subsequently in the following leaves untilfinally the flag leaf enters senescence. This is the standard process of mono- carpic senescence. In parallel to the degradation of proteins, assimilating function also decreases (GS activities). A sequential pattern of the onset of senescence in the individual leaves was observed. Our data show that the time point of the onset of senescence clearly underlies a strict temporal and spatial control during ontogeny of the whole plant. Each single leaf enters thefinal developmental phase of senescence at a different time point, starting with the primary leaf and ending with the uppermost leaf, theflag leaf. Under our standardized conditions, the time of the onset of senescence of the single leaves during whole plant ontogeny depends almost in a linear manner from leaf number, indicating that after initiation during growth of the plant, each single leaf follows a given developmental program that after a certain time ends in the processes of senescence. There is a clear difference between the wheat genotypes under moderate drought stress. The well-watered and drought stressed individuals of stress resistant breeds (Plainsman V, MV Emese, Kharchia) showed the same senescence pattern (Figs. 1 and 2), while in the sensitive genotypes (Cappelle Desprez, GK Élet), the protein contents of the flag leaf decreased earlier than in the older leaves during drought stress.
In our work, we also focused on regulation of N and C meta- bolism. Rubisco plays a central role in Cfixation and N storage. GS isoenzymes represent the regulatory endpoint of assimilation of reduced nitrogen. Levels of these enzymes are clearly decreased during senescence (Figs. 1and4). The amount and activity of GS2 is a good marker of plastid status. Our results indicate that chloro- plastic GS (GS2) is regulated in a different way than its cytosolic isoform (GS1), which is induced in rosette leaves of Arabidopsis thalianaduring senescence[19]. Senescence in wheat is a sequen- tial process, where the older leaves are degraded; assimilating, synthetic processes cease and dissimilating routes start. Nutrients (N, sugars, amino acids) are transported to the younger leaves and seeds. Decreasing levels of Rubisco and plastidical GS2, together with an increasing (or steady) level of cytosolic GS1 is a good indicator of the senescence process. Rubisco is an important storage of N and a key enzyme in the synthetic processes (carbonfixation).
GS is the key enzyme of nitrogen metabolism, the link between inorganic and organic nitrogen compounds. Ammonium is incor- porated into carbon skeletons through the glutamine synthetase (GS)-glutamate-oxoglutarate amino transferase (GOGAT) pathway [13]. The induction of proteolysis in the leaf has been associated with the development of senescence. This is the ultimate fate of plant organs, which leads to cell death and degradation. It is a complex and ordered process, where gene expression is induced and enzymes are activated, but where regulation is not well understood[20].
The regulatory mechanisms underlying such senescence- specific changes in fluxes of C- and N-containing biomolecules are not yet clearly understood. It is known that regulation of leaf senescence does not follow a simple signal transduction chain, but rather involves a regulatory network, which can be triggered by different internal and external signals [21]. Stressors, such as drought may induce or modulate the senescence process [22].
Among the internal signals phytohormones, changes in metabolism or sink-source effects have been suggested to play roles in senes- cence induction [17]. However, the regulatory mechanisms and functions of the corresponding proteins in the senescence process are often not yet fully understood. In order to allow efficient nutrient recycling, the degradation processes have to be highly
regulated. Several publications indicate that in addition to changes in the levels of hormones, changes in photosynthetic performance, carbohydrate content or specific signals, e.g. reactive oxygen species might also be involved in regulation of leaf senescence[4].
In this study we monitored the changes in the activities of the GS isoenzymes and the changes in the protein amounts, and our results indicate that a repetitive sequence of events occurs when each single wheat leaf enters the senescence program. The decrease in the levels of these enzymes involved in anabolic N and C path- ways in each individual leaf precedes the decrease in total protein amount, indicating that at the end of the maturation phasefirst the levels of such enzymes involved in anabolic processes are down- regulated. This leads to a decrease in the accumulation of C and N containing biomolecules (e.g. Rubisco). Our results resolve the temporal and spatial regulation of the shift from N anabolism to N catabolism during senescence of each individual leaf at the levels of key enzymes. Water stress also decreased the relative water con- tent (RWC) in the sensitive and tolerant genotypes by about 10e15%
[24]. The molecular identity of the signals responsible for this temporal and spatial down-regulation of key enzymes in C and N metabolism in the leaves during ontogeny of the whole plant is not yet clear, and will be subject to further investigations.
Our results are in agreement with previous experiments of Kichey et al. [16]. Rubisco starts to be degraded 8e10 d after anthesis to release amino acids that are further translocated to the seeds. During this period the total GS activity of the flag leaf decreased. It is likely that the decrease in GS2 protein is partly responsible for the decrease in total leaf enzyme activity. The total protein and Rubisco contents of leaves decrease in senescing tis- sues. The wheat senescence is sequential. In the old leaves the assimilating processes shut down earlier than in the younger leaves. The gradient of the protein content and GS activity is steeper in the tolerant breeds than the sensitive ones (Fig. 1).
Under water deficit stress we noticed two different modes of senescence. We observed the enzyme activities and protein con- tents in drought stressed plants in different genotypes. Under drought the order of leaf senescence collapsed in sensitive breeds, and the gradient of the decrease of protein content was steeper. An irregular senescencing process started in the sensitive cultivars under drought stress. The normal order of senescence ceased.
In the tolerant genotypes, drought stress did not lead to a significant deviation in the total protein content and GS enzyme activities. Drought stress simply accelerated the senescence, but the sequentiality was preserved. The extent of this acceleration may refer to the degree of tolerance. In summary, the tolerant breeds were able to adapt to drought circumstances (water potential, photosynthesis, etc.).
The sensitive breeds could not adapt to the drought and their strategy was to escape drought stress with faster crop develop- ment, therefore the nutrients were transported from theflag leaf to the seeds. So from theflag leaves the nutrients were saved to the seeds. The normal gradient of senescence collapsed and the youngest leaves were degraded. The flag leaf converted to a catabolic source, and this preceded the conversion of the older leaves. This untimely senescence of theflag leaf is the indicator of drought stress sensitivity. They could only develop crop under drought.
The Kobomugi genotype originates from a semi-arid region from inner Asia. Parameters of the senescence process were similar to the sensitive genotypes. This breed could not develop much crop, only a few seeds per plant. The whole plant shriveled, and its life- cycle was very fast. We found a drastic decrease of the GS activity in theflag leaf under drought stress. This is in agreement with pre- vious experiments [23] showing that Kobomugi tends to be a drought stress escaper.
The background of the difference between the tolerant and sensitive genotypes could be the different levels of hormones and different gene expression[2,4,23,24]. Abscisic acid (ABA) levels in theflag leaves and in the grains increased under soil water deficit.
In response to drought stress, endogenous ABA levels in theflag leaves increased significantly in the booting stage and in the time of anthesis in all genotypes, and after this increase the hormone levels decreased markedly. In the tolerant varieties (MV Emese and Plainsman V) the differences were significant between the well- watered and the water stressed plants in all measuring days despite the decline, while in the sensitive varieties (GK Élet and Cappelle Desprez) hormone levels in the stressed plants were close to the control ones. At the end of the experiment, in MV Emese, GK Élet and Plainsman V ABA levels increased significantly, while in Cappelle Desprez they remained as low as in its control. The ten- dencies were similar in three varieties (MV Emese, Plainsman V, GK Élet), but in MV Emese and Plainsman V higher ABA values were measured compared to the control and also to GK Élet. In Cappelle Desprez from 9 DPA low ABA levels were measured[2]. Therefore, so the ABA transport, storage and distribution might play an important role in stress tolerance. Remobilization of stored carbon reserves in wheat is promoted by water stress and that water deficit imposed during grainfilling enhance plant senescence and accel- erate grainfilling. ABA is considered a senescence promoter. ABA has also been reported to be an important regulator in transporting assimilates to the developing seeds or fruits. However, the proposal that ABA is involved in regulating both senescence and assimilate mobilization has remained disputable[3].
According to the type of strategy adopted, plants are said to escape or tolerate drought stress, although these are not mutually exclusive[25].
Overall, the total protein content, GS enzyme activities and the presence of GS isoforms together are good indicators of drought stress tolerance of wheat cultivars. The increasing ratio of cyto- plasmic and chloroplastic GS, the decomposition of protein content, mainly Rubisco, are the signs of accelerated senescence induced by water deficit. A moderate drought can accelerate grainfilling too.
This acceleration of senescence is found in drought tolerant wheat cultivars. In drought-sensitive ones, however, the function of the last assimilatory source, theflag leaf, ceases and it is converted to a catabolic source, which supplies the developing grain for a shorter time. With these parameters the distinct survival strategies of different wheat cultivars can be clearly revealed. The physiological differences are well reflected in the different senescence processes.
4. Materials and methods
4.1. Plant material and water stress treatment
Our experiments were carried out on two Hungarian and four internationally known wheat genotypes:T. aestivumL. cv. MV Emese, a drought-resistant Hungarian cultivar,T. aestivumL. cv. GK Élet a drought-sensitive Hungarian cultivar,T. aestivumL. cv. Plainsman V a drought-resistant North American cultivar, the drought-sensitive FrenchT. aestivumL. cv. Cappelle Desprez and two special landrace breeds. Kobomugi is a facultative spring landrace derived from inner Asia (China, Central Deserts); Kharchia is an Indian tall landrace wheat cultivar[26]. The breeding pedigree analysis showed a closer genetic relationship between the two Hungarian cultivars: similar ancestors were found, and the difference in drought susceptibility was clearly established. No data were found regarding the common origin of Plainsman V and Cappelle Desprez[23,24].
The experiments were carried out in the grainfilling period. The plants were grown in plastic pots (3 plants per pot) containing a
mixture of soil (type Terra, Hungary) and sand (1:1, v/v) at 300mmol m2s1light intensity, 12/12 h day/night illumination, at 26/20C day/night temperature and 55e60% air humidity. From 4 days before the booting stage two watering treatments were applied. The control group of plants received sufficient irrigation, while the treatment group was subjected to water stress by with- holding irrigation. Irrigation occurred every 2nd day to reach 60% of the total soil water capacity for control plants, and the 25% for stressed plants. There was one sampling and one measuring day from the booting stage until maturity. This day was on the 9th day post anthesis (DPA)[2]. In thefigures the treatments of plants are indicated by letters (W ewell-watered or Se stressed) and the leaves are numbered (e.g. (2)) to indicate the position under the youngest leaves (flag leaves). Whole leaves were used in the tests.
4.2. Total protein assay
The extraction buffer contained the following: 200 mM TriseHCl, 2 mM EDTA-Na2, 3 mM dithiotreitol, 1 mM reduced
L-glutathione, 10% glycerol, 10mL mL1protease inhibitor cocktail (Sigma, St Louis, MI) (pH 7.5). The tissue was homogenized in a mortar, centrifuged (5 min, 13,000g), and kept on ice until use.
Total protein in wheat leaf extracts was measured spectropho- tometrically with Bio-Rad Protein Assay Dye Reagent Concentrate (Bio-Rad, Hercules, CA) [27]. Test mixture: 900mL water, 100 mL Bio-Rad reagent, 5 mL diluted (5) protein sample, measured at 595 nm against a protein-free reference.
4.3. Enzyme assay
The enzyme activity of GS was determined in vitro with a modified version of‘synthetase reaction’[28,29], measuring theg- glutamyl monohydroxamate (GMH) formation. The GS containing protein extract was prepared from leaves with extraction buffer in a 1:3 or 1:4 ratio. One hundred microliters of extract was mixed with 250mL of reaction buffer, and incubated for 20 min in a 30C water bath. The reaction buffer contained: 50 mM imidazole, 18 mM ATP-Na2, 28 mM MgCl2, 25 mM hydroxylamine, 92 mM
L-glutamate-Na, (pH 7.2). The enzyme reaction was terminated with 500 mL of stopping solution containing 370 mM FeCl3, 200 mM TCA, 700 mM HCl. After centrifugation (5 min, 13,000g) 600mL of supernatant was mixed with 300mL of water in a semi-micro cuvette, and photometered at 540 nm, against an immediately stopped parallel sample (UVIKON XL double beam spectrophotometer, Ales, France). Protein concentration was determined according to Bradford[27].
4.4. Electrophoretic separation and identification of GS proteins
Discontinuous non-denaturing polyacrylamide gel electropho- resis[30]was applied for the separation of protein components of the extract (as above), in a vertical Bio-Rad Mini-Protean II appa- ratus (Hercules, CA). Stacking: 3.13% T, 20% C, separating gel: 6.5% T, 5% C. Semi-dry blotting of proteins onto PVDF membrane was performed with the blotter unit of Multiphore II (Pharmacia, Uppsala, Sweden), wetted with 50 mM borate buffer (pH 9.0). GS proteins were identified immunologically, with polyclonal anti-GS antibodies (kind gift from J.V. Cullimore) on protein blot[31,32].
Protein-A alkaline phosphatase conjugate was used as the sec- ondary antibody.
4.5. Statistical analysis
Each result shown in figures was the mean of at least three replicated measurements. The significance of differences between
treatments was statistically evaluated by standard deviation and Student’s t-test methods. Data of individual experiments are presented.
Acknowledgments
The research was supported by the National Office for Research and Technology of Hungary (Grant“Búzakalász”, Grant No. NKFP 4/
064/2004 and Grant OTKA, Grant No. T46692). Z. Nagy was sup- ported by the European Union and co-funded by the European Social Fund. Project title: “Broadening the knowledge base and supporting the long term professional sustainability of the Research University Centre of Excellence at the University of Szeged by ensuring the rising generation of excellent scientists.”Project number: TÁMOP-4.2.2/B-10/1-2010-0012. The authors are grateful to J.V. Cullimore (Toulouse, France) for the GS antibody.
References
[1] H. Dong, W. Li, W. Tang, Z. Li, D. Zhang, Y. Niu, Yield, quality and leaf senes- cence of cotton grown at varying planting dates and plant densities in the Yellow River Valley of China, Field Crops Res. 98 (2006) 106e115.
[2] A. Guóth, I. Tari, Á. Gallé, J. Csiszár, A. Pécsváradi, L. Cseuz, L. Erdei, Comparison of the drought stress responses of tolerant and sensitive wheat cultivars during grainfilling: changes inflag leaf photosynthetic activity, ABA levels, and grain yield, J. Plant Growth Regul. 28 (2009) 167e176.
[3] J. Yang, J. Zhang, Grainfilling of cereals under soil drying, New Phytol. 169 (2005) 223e236.
[4] K. Wiedemuth, J. Muller, A. Kahlau, S. Amme, H.P. Mock, A. Grzam, R. Hell, K. Egle, H. Beschow, K. Humbeck, Successive maturation and senescence of individual leaves during barley whole plant ontogeny reveals temporal and spatial regulation of photosynthetic function in conjunction with C and N metabolism, J. Plant Physiol. 162 (2005) 1226e1236.
[5] R. Kuma, A.K. Sarawgi, C. Ramos, S.T. Amarante, A.M. Ismail, L.J. Wade, Parti- tioning of dry matter during drought stress in rainfed lowland rice, Field Crops Res. 96 (2005) 455e465.
[6] A. Fangmeier, B. Chrost, P. Högy, K. Krupinska, CO2enrichment enhancesflag leaf senescence in barley due to greater grain nitrogen sink capacity, Environ.
Exp. Bot. 44 (2000) 151e164.
[7] D.W. Lawlor, Carbon and nitrogen assimilation in relation to yield: mecha- nisms are the key to understanding production systems, J. Exp. Bot. 53 (2002) 773e787.
[8] S. Ghosh, S.R. Mahoney, J.N. Penterman, D. Peirson, E.B. Dumbroff, Ultra- structural and biochemical changes in chloroplasts during Brassica napus senescence, Plant Physiol. Biochem. 39 (2001) 777e784.
[9] C.M. Smart, Gene expression during leaf senescence, New Phytol. 126 (1994) 419e448.
[10] M.B. Herrera-Rodriguez, J.M. Maldonado, R. Perez-Vicente, Role of asparagine and asparagine synthetase genes in sunflower (Helianthus annuus) germina- tion and natural senescence, J. Plant Physiol. 163 (2006) 1061e1070.
[11] B. Hirel, P.J. Lea, Ammonia assimilation, in: P.J. Lea, J.-F. Morot-Gaudry (Eds.), Plant Nutrition, INRA Springer Verlag, Heidelberg, 2001, pp. 79e99.
[12] B.J. Miflin, P.J. Lea, Ammonium assimilation, in: B.J. Miflin (Ed.), The Biochemistry of Plants, vol. 5, Academic Press, New York, 1980, pp.
169e202.
[13] B.J. Miflin, D.Z. Habash, The role of glutamine synthetase and glutamate de- hydrogenase in nitrogen assimilation and possibilities for improvement in the nitrogen utilization of crops, J. Exp. Bot. 53 (2002) 979e987.
[14] M. Tabuchi, K. Sugiyama, K. Ishiyama, E. Inoue, T. Sato, H. Takahashi, T. Yamaya, Severe reduction in growth rate and grainfilling of rice mutants lacking OsGS1;1, a cytosolic glutamine synthetase1;1, Plant J. 42 (2005) 641e 651.
[15] S.M. Bernard, A.L.B. Møller, G. Dionisio, T. Kichey, T.P. Jahn, F. Dubois, M. Baudo, M.S. Lopes, T. Terce-Laforgue, C.H. Foyer, M.A.J. Parry, B.G. Forde, J.L. Araus, B. Hirel, J.K. Schjoerring, D.Z. Habash, Gene expression, cellular localisation and function of glutamine synthetase isozymes in wheat (Triti- cum aestivum L.), Plant Mol. Biol. 67 (2008) 89e105.
[16] T. Kichey, J. Le Gouis, B. Sangwan, B. Hirel, F. Dubois, Changes in the cellular and subcellular localization of glutamine synthetase and glutamate dehy- drogenase duringflag leaf senescence in wheat (Triticum aestivumL.), Plant Cell. Physiol. 46 (2005) 964e974.
[17] L.D. Nooden, J.J. Guiamet, I. John, Senescence mechanisms, Physiol. Plant. 101 (1997) 746e753.
[18] P. Matile, Biochemistry of Indian summer: physiology of autumnal leaf coloration, Exp. Gerontol. 35 (2000) 145e158.
[19] W.R. Bernhard, P. Matile, Differential expression of glutamine synthetase genes during the senescence ofArabidopsis thalianarosette leaves, Plant Sci.
98 (1994) 7e14.
[20] A.J. Barneix, Physiology and biochemistry of source-regulated protein accu- mulation in the wheat grain, J. Plant Physiol. 164 (2007) 581e590.
[21] Y. He, W. Tang, J.D. Swain, A.L. Green, T.P. Jack, S. Gan, Networking senescence-regulating pathways by usingArabidopsisenhanced trap lines, Plant Physiol. 126 (2001) 707e716.
[22] E. Pic, B.T. de la Serve, F. Tardieu, O. Turc, Leaf senescence induced by mild water deficit follows the same sequence of macroscopic, biochemical and molecular events as monocarpic senescence in pea, Plant Physiol. 128 (2002) 236e246.
[23] M. Secenji, Á. Lendvai, P. Miskolczi, G. Kocsy, Á. Gallé, A. Sz}ucs, B. Hoffmann, É. Sárvári, P. Schweizer, N. Stein, D. Dudits, J. Györgyey, Differences in root functions during long-term drought adaptation: comparison of active gene sets of two wheat genotypes, Plant Biol. 12 (2010) 871e882.
[24] Á. Gallé, J. Csiszár, M. Secenji, A. Guóth, L. Cseuz, I. Tari, J. Györgyey, L. Erdei, Glutathione transferase activity and expression patterns during grainfilling in flag leaves of wheat genotypes differing in drought tolerance: response to water deficit, J. Plant Physiol. 166 (2009) 1878e1891.
[25] M.H. Cruz de Carvalho, Drought stress and reactive oxygen species: produc- tion, scavenging and signalling, Plant Signal. Behav. 3 (2008) 156e165.
[26] L. Erdei, S. Trivedi, K. Takeda, H. Matsumoto, Effects of osmotic and salt stresses on the accumulation of polyamines in leaf segments from wheat varieties differing in salt and drought tolerance, J. Plant Physiol. 137 (1990) 165e168.
[27] M.M. Bradford, Rapid and sensitive method for the quantitation of microgram quantities of protein utilizing the principle of protein-dye binding, Anal.
Biochem. 72 (1976) 248e254.
[28] D. Rhodes, G.A. Rendon, G.R. Stewart, The control of glutamine synthetase level inLemna minorL, Planta 125 (1975) 201e211.
[29] A. Pécsváradi, Z. Nagy, A. Varga, Á. Vashegyi, I. Labádi, G. Galbács, F. Zsoldos, Chloroplastic glutamine synthetase is activated by direct binding of aluminium, Physiol. Plant. 135 (2009) 43e50.
[30] U.K. Laemmli, Cleavage of structural proteins during the assembly of the head of bacteriophage T4, Nature 227 (1970) 680e685.
[31] M.J. Bennett, J.V. Cullimore, Glutamine synthetase isoenzymes ofPhaseolus vulgarisL: subunit composition in developing root nodules and plumules, Planta 179 (1989) 433e440.
[32] J.V. Cullimore, B.J. Miflin, Immunological studies on glutamine synthetase using antisera raised to the two plant forms of enzyme fromPhaseolus vulgaris root nodules, J. Exp. Bot. 35 (1984) 581e587.