0133-3720/$20.00 © 2019 Akadémiai Kiadó, Budapest
Determining the Best Drought Tolerance Indices using Artificial Neural Network (ANN): Insight into Application of Intelligent Agriculture in Agronomy and Plant breeding
A. EtminAn1*, A. Pour-AboughAdArEh2, r. mohAmmAdi3, L. ShooShtAri1, m. YouSEfiAzArkhAniAn4 and h. morAdkhAni1
1Department of Biotechnology and Plant Breeding, Kermanshah Branch, Islamic Azad University, Kermanshah, Iran
2Department of Agronomy and Plant Breeding, Faculty of Agriculture, University of Tehran, Karaj, Iran
3Dryland Agricultural Research Institute, Sararood branch, Agricultural Research, Education and Extension Organization (AREEO), Kermanshah, Iran
4Agricultural Jihad Organization, Qazvin, Iran (Received 27 November 2017; Accepted 25 June 2018;
Communicated by S. Gottwald)
In the present study, efficiency of the artificial neural network (ANN) method to identify the best drought tolerance indices was investigated. For this purpose, 25 durum genotypes were evaluated under rainfed and supplemental irrigation environments during two consecu- tive cropping seasons (2011–2013). The results of combined analysis of variance (ANOVA) revealed that year, environment, genotype and their interaction effects were significant for grain yield. Mean grain yield of the genotypes ranged from 184.93 g plot–1 under rainfed environment to 659.32 g plot–1 under irrigated environment. Based on the ANN results, yield stability index (YSI), harmonic mean (HM) and stress susceptible index (SSI) were identi- fied as the best indices to predict drought-tolerant genotypes. However, mean productivity (MP) followed by geometric mean productivity (GMP) and HM were found to be accurate indices for screening drought tolerant genotypes. In general, our results indicated that geno- types G9, G12, G21, G23 and G24 were identified as more desirable genotypes for cultiva- tion in drought-prone environments. Importantly, these results could provide an evidence that ANN method can play an important role in the selection of drought tolerant genotypes and also could be useful in other biological contexts.
Keywords: drought stress, selection indices, ANN analysis, durum wheat
Introduction
Durum wheat (Triticum turgidum L. var. durum Desf.) is an important cereal crop, which accounts for approximately 10% of the total wheat production, inhabiting around 20 mil- lion hectares worldwide. This crop is the only tetraploid (2n = 4x = 28) species of com- mercial wheat that is widely cultivated in Mediterranean climates with more than 50% of global wheat production (FAOSTAT 2013). In these regions, yield performance is signifi- cantly constrained by drought and heat stress because of unpredictable seasonal events at
*Corresponding author; E-mail: alietminan55@yahoo.com
the end of growth cycle (Loss and Siddique 1994). Relative yield performance in the both non-stressed and drought-stressed environments can be used as an important indicator of drought tolerance in breeding programs. Based on the theory suggested by Fernandez (1993), genotypes can be categorized into four groups; (1) group A with high perfor- mance under both non-stress and stress environments; (2) group B with high yield in non-stress environments; (3) group C with high yield in stress environments and (4) group D with low yield in both environments. Accordingly, several yield-based drought tolerance criteria, such as stress susceptibility index (SSI), stress tolerance index (STI), yield stability index (YSI), relative drought index (RDI), geometric mean produc- tivity (GMP), mean productivity (MP), tolerance (TOL), harmonic mean (HM), yield index (YI), stress susceptibility percentage index (SSPI), abiotic stress tolerance index (ATI), modified stress tolerance index (MSTI) and integrated selection index have been suggested to characterize the drought tolerance of genotypes (Fischer and Maurer 1978;
Rosielle and Hamblin 1981; Bouslama and Schapaugh 1984; Fernandez 1993; Gavuzzi et al. 1997; Farshadfar and Sutka 2002; Moosavi et al. 2008).
The efficiency of suggested indicators depends on the objective of selection and tar- geted environment. For increasing the yield performance of each genotype, it is necessary to define discriminating criteria with different methods like cluster analysis, factor analy- sis, principal components analysis, biplot and regression models (Tahmasbi et al. 2013;
Khalili et al. 2014; Bahrami et al. 2014; Ravari et al. 2015). Recently, artificial neural network (ANN) analysis suggested as one of the suitable methods, which may prove to be useful in the classifying of drought tolerance indices. The most common ANN model is the multilayer-perceptron (MLP), which has three parts as input, hidden and output layers (Gholipoor et al. 2012). Also, the mean square error (MSE) and the coefficient of deter- mination (R2) between the predicted and actual values are widely used as other indices for determining the validity of the model (Ravari et al. 2015). Despite ANN was used to predict grain yield in the different crops (Shekoofa et al. 2014; Safa et al. 2015), but this model has not been used for assessment of crop drought tolerance earlier. Hence, the ob- jective of the present study was to determine efficiency of the ANN method to selection of the best drought tolerance criteria.
Materials and Methods Plant materials and experimental set up
In this study, 25 durum wheat genotypes – selected from the breeding program at the Dryland Agricultural Research Institute – were evaluated under two distinct environ- ments (rainfed and supplemental irrigation conditions) during two consecutive years (2011–2012 and 2012–2013). Detailed information about these materials are shown in Table S1*. The trials were conducted at Sararood Research Station in Kermanshah (34º19´N, 47º17´E; 1351 m above sea level), which is representative of rainfed environ- ments with moderate winters and annual mean precipitation of 425 mm, mean tempera-
*Further details about the Electronic Supplementary Material (ESM) can be found at the end of the article.
Cereal Research Communications 47, 2019
ture of 11.5 °C per year. Detailed agro-climate information for each year are in Table S2.
For supplemental irrigation two irrigations, each of 25 mm were applied at flowering and grain filling stages to cope with terminal drought stress, a common feature in western Iran. For each environment, experimental layout was a randomized complete block de- sign with three replications. Plot size was 7.2 m2 (six rows, 6 m long and 20 cm row spac- ing). Fertilizer rate was applied at planting at 50 kg N ha–1 1 and 50 kg P2O5 ha–1. At harvest, grain yield data was collected for each plot (g plot–1).
Statistical analysis
A combined analysis of variance (ANOVA) was performed for grain yield using SAS PROC GLM (SAS Inc, Cary, USA). The thirteen selection indices including TOL, MP, STI, GMP, SSI, YSI, YI, HM, RDI, K1STI, K2STI, ATI and SSPI were calculated based on grain yields under rainfed (Ys) and supplemental irrigation (Yp) environments (Table S3). Regarding the ANN analysis, the multilayer-perceptron (MLP) model was used. To prevent over fitting in the training phase, the dataset was randomly divided into three sets because of high neurons existing in the hidden layer. So, training the neural network, validation set and testing set were based on 70%, 15% and also 15%, of data, respec- tively (Bagheri et al. 2012). During training, ANN is trying to converge the global mini- mum or the maximum neural network performance via the shortest path for yielding the size of the network. With this method, back propagation is performed with the training set. The update rule in the method used here seeks to minimize mean square error over the training set. After an epoch of training, the mean square error of network running of the validation set is computed. In this model, evaluated indices and grain yields (Ys, Yp and average of both grain yields (Y)) were considered as input and output data, respectively.
Afterwards, validity of the model was determined by MSE and R2. Also, a sensitivity analysis was performed for importance evaluating of each forecaster and independent variables during neural network (NN) processes (Ravari et al. 2015). The relative impor- tance parameter for each index is calculated by dividing the value of its importance by the highest importance value. Consequently, the model with the largest R2 and the smallest MSE was considered the best. The accuracy of repeatability and similarity for yields and yield-based indices were evaluated by the ratio of the standard error and the mean value of the correlations estimates from 1000 bootstrap samples similar to coefficient of varia- tion (CV). A selection index is more accurate when its CV is low (Robert 2002). All im- plementations were performed using neural network toolbox of MATLAB (Neural Net- work Toolbox, Natick, USA) and SPSS (SPSS, New York, USA) packages.
Results Combined analysis of variance (ANOVA)
The results of combined ANOVA on grain yield showed that all the main and their inter- action effects were statistically significant (Table 1). The relative magnitudes of different source of variation indicated that 30, 28.64 and 9.26% of the total variation in grain yield
was justified by differences among years, environments and their interaction, respective- ly. Interactions between years and genotypes explained 6.10%, whereas genotype × envi- ronment interaction accounted for 7.50% of the total variation. Furthermore, year × envi- ronment × genotype effect accounted for 5.29% of the total variation about grain yield.
Also, the moderate coefficient of variance was observed for grain yield (19%).
Response of genotypes to drought stress
Mean yields of the 25 durum wheat genotypes under irrigated and rainfed environments along with their relative drought effect (RDF) are shown in Tables S3–5. The results showed significant differences among genotypes in each environment and a decreasing trend was occurred due to drought stress. The grain yield declined by 27.12, 49.29 and 41.90% in the first, second and average two years, respectively. Under irrigated environ- ment, in the first year, the average yield across all the genotypes ranged from 205.97 g plot–1 (corresponding to G24) to 516.68 g plot–1 (corresponding to G7), with an average of 262.10 g plot–1, while under drought environment, it varied between 178.07 g plot–1 (cor- responding to G24) and 315.47 g plot–1 (corresponding to G8), with an average of 217.27 g plot–1. The lowest reduction in grain yield was recorded for genotype G20 followed by G22, G3, G12 and G24. However, grain yield increased by 25.86, 6.92 and 2.82% in G2, G17 and G8, respectively (Table S4). In the second year, response of genotypes to drought stress was different and the grain yield under irrigated environments ranged from 500.65 g plot–1 (corresponding to G25) to 838.80 g plot–1 (corresponding to G17), with an average of 677.47 g plot–1. In the second year, grain yield ranged from 145.97 g plot–1 to 612.50 g plot–1 (G7 and G22, respectively) under rainfed environment. The order of least grain yield reduction was as G14 < G25 < G20 < G22 < G16 < other genotypes (Table S5). Across two years the mean grain yield varied between 295.14 g plot–1 and 508.01 g plot–1 for irrigated
Table 1. Combined analysis of variance (ANOVA) for grain yield (g plot–1) in 25 studied durum wheat genotypes
Source of variation df SS MS TSS (%)
Year (Y) 1 3559897.76 3559897.76*** 30.01
Environment (E) 1 3398480.19 3398480.19*** 28.65
Y × E 1 1099370.08 1099370.08*** 9.27
R/(Y × E) 6 18028.86 3004.81 0.15
Genotype (G) 24 424496.40 17687.35*** 3.58
Y × G 24 723019.44 30125.81*** 6.09
E × G 24 890013.84 37083.91*** 7.50
Y × E × G 24 627652.32 26152.18*** 5.29
Error 192 1123132.80 5849.65 9.47
Coefficient of variance (%) 19.04
***Significant at P < 0.0001. TSS – percentage relative to total sum of square.
Cereal Research Communications 47, 2019
and rainfed environments, respectively. Also, the last genotypes except G16 indicated the lowest reduction than other genotypes. The highest grain yield under irrigated/rainfed en- vironments were recorded by genotypes G11/G22, while the lowest values were recorded for G25 and G24, respectively. Furthermore, the lowest RDE was observed for genotype G20 followed by G25, G22, G14 and G2 (Table S6). The ranks of drought tolerance indi- ces for 25 durum genotypes are shown in Tables S7–9. Also, due to the difficulty in iden- tifying drought tolerant genotypes based on a single criteria, the average of sum ranks (ASR) of all indices was calculated to select the superior tolerant genotypes with low ASR values. Based on these results, genotype G11, G8, G15, G7 and G9 in the first year; G22, G23, G20, G8 and G2 in the second year; and G23, G24, G9, G21 and G12 in the average two years were identified as the best tolerant genotypes.
Similarity patterns among drought tolerance indices and their accuracy
Principal component analysis (PCA)–based biplot was applied to discover the interrela- tionships among drought tolerance indices. These relationships were assessed by acute and obtuse angles among indices vectors on the biplot. For instance, an acute angle shows a strong positive association and an obtuse angle shows a negative correlation; further- more a 180 angle would result if there was negative correlation, whereas a 90 angle indi- cates if there was no correlation among indices. As shown in Fig. S1, most of correlations among indices were significantly positive. Moreover, the correlations among MP, GMP, STI and two modified STI (K1STI and K2STI) indices were positively significant (Fig.
S1A–C), suggesting a high similarity among these tolerance indices for genotypes rank- ing. Also, Ys strongly correlated with YSI index. Four tolerance indices, TOL, SSI, SSPI and ATI, had the significant positive correlation with each other. In addition, a repeatable relationship among aforesaid indices with grain yield under irrigated (Yp) environment expressed that increased Yp is related to drought susceptibility. Additionally, accuracy and repeatability of measured grain yields and indices were investigated using CV values resulted from repeated bootstrap samples which are presented in Table 2. In the first year, the lowest CV values were estimated for Ys, Y, MP, GMP, HM and YI. In the second year, Y, MP, Yp, GMP and HM indicated the lowest CV values. Regarding the averages of two years, Y, MP, GMP and HM were selected as the most accurate indices.
Identification of the best indices using artificial neural network (ANN) analysis
The ANN analysis was performed for each year and also average two years. In all of the ANN analyzes, the input and output layers had 13 neurons (representing drought indices) and one layers (corresponding to the yield performance of genotypes), respectively. The number of neurons in the hidden layer was defined using a trial-and-error approach that was started with one and then consecutively increased. Then, the number of learning cy- cles (epoch), learning rate and momentum were constants 10,000, 0.8 and 0.6, respec- tively. The results of ANN showed different networks across two years (Table S10). In the first year, a network with eight hidden layers selected in the 10th training step and estab-
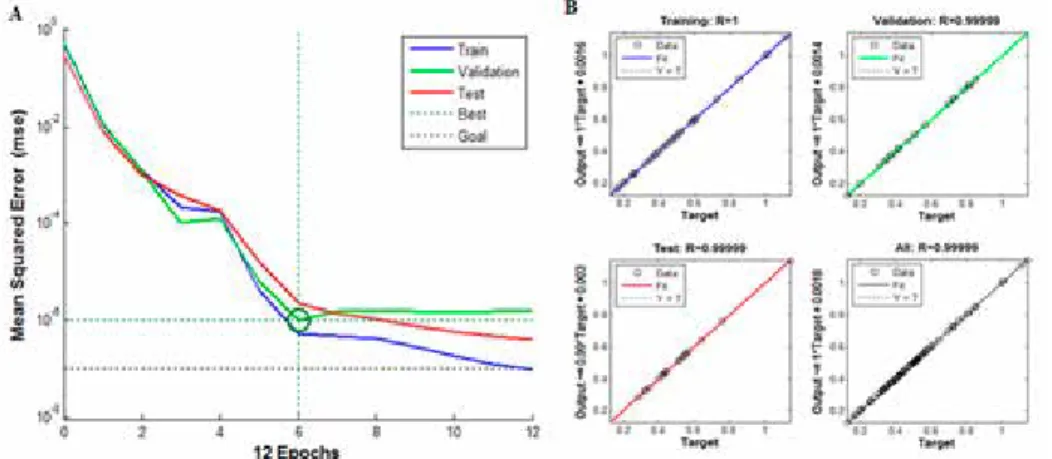
Figure 1. Change in the MSE during the training steps (A) and predicted values of tolerance by a multilayer perceptron neural network versus observed values intesting, training and validation phases (B) based on the first
year dataset (2011–2012)
Table 2. Coefficients of variation estimated over 1000 bootstrap runs for yield-based drought tolerance indices between different growing seasons
Index First year Second year Average of two years
YP 4.14 2.07 2.01
YS 2.53 1.87 1.37
Y 1.51 4.77 2.70
STI 4.48 4.96 2.96
SSI 44.17 6.46 5.99
MP 2.53 1.87 1.37
GMP 2.37 2.49 1.46
TOL 15.50 7.12 6.88
HM 2.27 3.25 1.69
YI 6.62 5.64 2.70
YSI 1.51 4.77 3.90
K1STI 11.43 7.01 5.97
K2STI 6.52 13.59 8.19
SPPI 15.49 7.12 6.87
ATI 14.51 6.57 7.03
RDI 6.62 5.64 3.89
YP, grain yield in supplemental irrigated environment; YS, grain yield in rainfed environment; Y, average of both grain yields; STI, stress tolerance index; SSI, stress susceptibility index; MP, mean product; GMP, geometric men production; YI, yield index; YSI, yield stability index; TOL, tolerance index; HM, harmonic mean; K1STI and K2STI, modified stress tolerance index; SSPI, stress susceptibility percentage index; ATI, abiotic stress tolerance index and RDI, relative drought index.
lished minimum error, whereas in the second year the network established with eight hidden layers in the 7th training step. In average two years, minimum error occurred when the network was selected with eight hidden layers in 6th training step (Figs 1–3). In all of analyzes, the values of R2 in the training and testing phases indicated that the neural net- work had been trained and revealed good performance in predicting the responses of genotypes to drought stress based on measured indices. As shown in Table S7, when Yp and Ys selected as the dependent variables, the effective indices in each environment were different to each other. Hence, the average of grain yield in the both irrigated and rainfed environments, was considered as dependent variable. Accordingly based on the relative importance parameter, SSI, HM, ATI, YSI and GMP in the first year; HM, YSI, MP, SSI and RDI in the second year; TOL, YI, YSI, SSI and HM in the average two years were selected as the best indices (Table 3).
Figure 2. Change in the MSE during the training steps (A) and predicted values of tolerance by a multilayer perceptron neural network versus observed values intesting, training and validation phases (B) based on the
second year dataset (2012–2013)
Figure 3. Change in the MSE during the training steps (A) and predicted values of tolerance by a multilayer perceptron neural network versus observed values intesting, training and validation phases (B) based on aver-
age two years
Table 3. The relative importance of the effective parameters in determining drought-tolerant genotypes IndexFirst yearSecond yearAverage two years YpYsYYpYsYYpYsY STI 39.60 4.10 46.9024.7043.7046.3051.7026.0026.40 SSI 57.20 31.70100.0029.5084.9065.908.3017.4072.50 MP 14.70100.00 56.40100.00100.0066.50100.00100.0048.20 GMP 67.60 47.90 71.8022.808.4013.204.2031.3047.90 YI 84.00 24.80 25.701.8023.8034.8046.0012.2088.90 YSI 73.30 2.9082.8037.5012.1098.703.604.4074.50 TOL 14.00 31.9014.2018.2092.6051.804.5035.00100.00 HM100.00 13.4090.3033.1030.10100.0043.506.5057.10 K1STI 62.80 34.0013.6019.1016.8038.0020.502.403.80 K2STI 38.60 27.7041.8027.9041.606.3029.305.204.60 SSPI 60.00 36.5016.4017.4039.5034.9024.2072.401.00 ATI 9.40 3.5089.103.1036.7046.1034.5021.701.80 RDI 37.10 22.7017.809.4068.9060.8028.5013.9015.20 Yp, grain yield in supplemental irrigated environment; Ys, grain yield in rainfed environment; Y, average of both grain yields; STI, stress tolerance index; SSI, stress susceptibility index; MP, mean product; GMP, geometric men production; YI, yield index; YSI, yield stability index; TOL, tolerance index; HM, harmonic mean; K1STI and K2STI, modified stress tolerance index; SSPI, stress susceptibility percentage index; ATI, abiotic stress tolerance index and RDI, relative drought index.
Cereal Research Communications 47, 2019
Discussion
In this work, we evaluated the yield performance and tolerance of 25 durum wheat geno- types under two different environments (irrigated and rainfed environments). Our results indicated the wide variability in the studied genotypes in response to drought stress (Table 1). Also, a large variation explained by environments (28.65% of the total sum of square) revealed that environments were diverse with large differences among environ- mental means causing most of the variation in grain yield. Grain yield is a complex quan- titative trait, which is controlled by multiple genes and is highly influenced by various environmental factors (Shi et al. 2014). Hence, the detected different responses to drought stress in this study may be resulted from genetic variability among genotypes or environ- mental conditions and even presence of the interaction among genotypes and environ- ments. To identify the best drought tolerant genotypes, we used several yield-based drought tolerance and susceptibility indices. Regarding obtained results, selection based on each index was different, hence, we used the ASR approach to classify the best geno- types. Our results showed G23, G24, G9, G21 and G12 in the both studied years as the best tolerant genotypes. Likewise, Khalili et al. (2012), Naghavi et al. (2013) and Pour- Siahbidi and Pour-Aboughadareh (2013), in the different crops, used the ASR method to classify the best drought-tolerant genotypes based on their yield performance and toler- ance indices ranking under stress and non-stress conditions. The accuracy of different drought tolerance indices is an important issue that should be measured during estimating of similarity for tolerance indices in drought-prone environments. This parameter can be helpful for recognizing the most efficient and accurate indices across different years or different drought stress levels (Mohammadi 2016). Among different indices, MP, GMP and HM with the lowest CV values were identified as the most accurate indices (Table 2).
Furthermore, the principal component analysis (PCA) as the relevant multivariate analy- sis used to display relationships among different indices. According to PCA-based biplot, consistent pattern of correlations was observed among TOL, SSI, SSPI and ATI, indicat- ing these indices can be used interchangeably across different environments.
Recently, artificial neural network (ANN) approach as a novel analytical method has been served to predict the different biological aspects. Several advantages of ANN make it valuable and attractive for a forecasting task: (i) as opposed to the traditional model, ANN is data-driven self-adaptive technique that this somewhat provides priori assump- tions about the models for probable problems during the study, (ii) ANN can generalize after learning the data presented to them (a sample) and also it can correctly infer the unseen part of a population even if the sample data contain noisy information and (iii) ANN is universal functional approximate. It has been shown that a network can approxi- mate any continuous function to any desired accuracy, and this technique can also solve linear and nonlinear functions (Khashei and Bijari 2010). Based on our results, the values of R2 in the all analyzes indicated that the neural network had been trained and revealed good performance in predicting the responses of genotypes to drought stress based on measured indices. Furthermore, the relative important factor indicated that repeatability of the indices affected by environmental conditions. However, several indices like TOL,
YI, YSI, SSI and HM were identified as the best indices to recognizing the drought-toler- ant genotypes (Table 3). Previously, Ravari et al. (2015) used ANN to predict grain yield in wheat and also to assess salinity indices for identifying tolerant genotypes in saline lands in Iran. They used several indices as input and grain yield as the output variable in the model, and then confirmed the accuracy of the ANN model. Moreover, the results of their study revealed that yield stability index (YSI), geometric mean production (GMP), mean product (MP) and stress tolerance index (STI) were selected as the best indices to predict drought-tolerant varieties.
The ANN analysis would be expected for other researches to establish an intelligent agricultural information system to help experts and also to improve agricultural technolo- gies (Shekoofa et al. 2014). In recent year, agricultural and biological studies have used various techniques of data mining for analyzing large data collections and establishing useful classification patterns within the data sets. However, data mining methods are still expected to bring more efficient results (Hsiao et al. 2006). Intelligent data mining and knowledge discovery using ANN and feature selection algorithms have become the im- portant revolutionary issues in prediction and modeling (Ebrahimi et al. 2010). In a dif- ferent study, Shekoofa et al. (2014) used an ANN method to optimize the physiological and agronomic characters for estimation of grain yield in maize. They used the different characters such as, season duration, days to silking, sowing date-location, soil type, ferti- lizers, soil pH, hybrid type, grain filling period, plant density, plant height, defoliation, leaf dry weight, stem dry weight, kernel growth rate, kernel number and weight, grain yield, kernel water content, and cob dry weight as input variables and grain yield as the output variable in the model. Finally, their results confirmed the accuracy of the ANN method and several characters like sowing date-location, the number of kernels, kernels weight and season duration were introduced as the most important characters that had the highest effect on yield performance.
Conclusion
The ANN approach provides a practical solution for predicting drought tolerant geno- types in a fast, inexpensive, accurate and objective way. The combination of artificial in- telligence and agricultural practices will continue to be an interesting area of research in future agronomy and plant breeding programs. In conclusion, this study provides evi- dences that ANN would be able to plays an important role in selection of drought-tolerant genotypes and it could be valuable in various other biological contexts.
References
Bagheri, S., Gheysari, M., Ayoubi, S., Lavaee, N. 2012. Silage maize yield prediction using artificial neural networks. Int. J. Plant Prod. 19:77–96.
Bahrami, F., Arzani, A., Karimi, V. 2014. Evaluation of yield-based drought tolerance indices for screening safflower genotypes. Agron. J. 106:1219–1224.
Bouslama, M., Schapaugh, W.T. 1984. Stress tolerance in soybean: 1. Evaluation of three screening techniques for heat and drought tolerance. Crop Sci. 24:933–937.
Cereal Research Communications 47, 2019
Ebrahimi, M., Ebrahimie, E. 2010. Sequence-based prediction of enzyme thermostability through bioinformat- ics algorithms. Curr. Bioinform. 5:195–203.
Farshadfar, E., Sutka, J. 2002. Multivariate analysis of drought tolerance in wheat substitution lines. Cereal.
Res. Commun. 31:33–39.
Fernandez, G.C.J. 1993. Effective selection criteria for assessing plant stress tolerance. In: Kuo, C.G. (ed), Proceeding of the AFCTWS Adaptation of food crops to temperature and water stress; Shanhua, Taiwan, pp. 257–270.
Fischer, R.A., Maurer, R. 1978. Drought resistance in spring wheat cultivars: 1. Grain yield response. Aust. J.
Agric. Res. 29:897–912.
Food and Agriculture Organization, FAO. 2013. http://www.fao.org/faostat/en/
Gavuzzi, P., Rizza, F., Palumbo, M., Campaline, R.G., Ricciardi, F.L., Borghi, G. 1997. Evaluation of field and laboratory predictors of drought and heat tolerance in winter cereals. Plant Sci. 77:523–531.
Gholipoor, M., Rohani, A., Torani, S. 2012. Optimization of traits to increasing barley grain yield using an artificial neural network. Int. J. Plant. Prod. 7:1–18.
Hsiao, H.W., Tasi, M.S., Wang, S.C. 2006. Spatial data mining of colocation patterns for decision support in agriculture. Asian Journal of Health and Info. Sci. 1:61–72.
Khalili, M., Naghavi, M.R., Pour-Aboughadareh, A.R., Talebzadeh, S.J. 2012. Evaluating of drought stress tolerance based on selection indices in spring canola cultivars (Brassica napus L.). J. Agric. Sci. 4:78–85.
Khalili, M., Pour-Aboughadareh, A., Naghavi, M.R., Mohammad-Amini, E. 2014. Evaluation of drought toler- ance in safflower genotypes based on drought tolerance indices. Not. Bot. Horti. Agrobot. Cluj-Napoca.
42:214–218.
Khashei, M., Bijari, M. 2010. An artificial neural network (p, d, q) model for time series forecasting. Expert.
Syst. Appl. 37:479–489.
Loss, S.P., Siddique, K.H.M. 1994. Morphological and physiological traits associated with wheat yield increas- es in Mediterranean environments. Adv. Agron. 52:229–276.
Mohammadi, R. 2016. Efficiency of yield-based drought tolerance indices to identify tolerant genotypes in durum wheat. Euphytica 211:71–89.
Moosavi, S.S., Yazdi-Samadi, B., Naghavi, M.R., Zali, A.A., Dashti, H., Pourshahbazi, A. 2008. Introduction of new indices to identify relative drought tolerance and resistance in wheat genotypes. Desert. 12:165–178.
Naghavi, M.R., Pour-Aboughadareh, A.R., Khalili, M. 2013. Evaluation of drought tolerance indices for screening some of corn (Zea mays L.) cultivars under environmental conditions. Not. Sci. Biol. 5:388–393.
Pour-Siahbidi, M.M., Pour-Aboughadareh, A. 2013. Evaluation of grain yield and repeatability of drought tolerance indices for screening chickpea (Ciceraritinum L.) genotypes under rainfed conditions. Iranian J.
Genetics. Plant. Breed. 2:28–37.
Ravari, S.Z., Dehghani, H., Naghavi, H. 2015. Assessment of salinity indices to identify Iranian wheat varieties using an artificial neural network. Ann. Appl. Biol. 168:185–194.
Robert, N. 2002. Comparison of stability statistics for yield and quality traits in bread wheat. Euphytica.
128:333–341.
Rosielle, A.A., Hamblin, J. 1981. Theoretical aspects of selection for yield in stress and non-stress environment.
Crop. Sci. 21:943–946.
Safa, M., Samarasinghe, S., Nejat, M. 2015. Prediction of wheat production using artificial neural networks and investigating factors affecting it: case study in Canterbury province, New Zealand. J. Agr. Sci. Tech.
17:791–803.
Shekoofa, A., Emam, Y., Shekoufa, N., Ebrahimi, M., Ebrahimie, E. 2014. Determining the most important physiological and agronomic traits contributing to maize grain yield through machine learning algorithms:
A new avenue in intelligent agriculture. Plos One. 9:e97288.
Shi, C., Dong, B., Qiao, Y., Guan, X., Si, F., Zheng, X., Liu, M. 2014. Physiological and morphological basis of improved water-use-efficiency in wheat from partial root-zone drying. Crop Sci. 54:2745–2751.
Tahmasbi, G., Heydarnezhadian, J., Pour-Aboughadareh, A. 2013. Evaluation of yield and yield components in some of promising wheat lines. Intl. J. Agri. Crop Sci. 20:2379–2384.
Electronic Supplementary Material (ESM)
Electronic Supplementary Material (ESM) associated with this article can be found at the website of CRC at https://akademiai.com/loi/0806
Electronic Supplementary Table S1. Names/pedigree for 25 tested genotypes
Electronic Supplementary Table S2. Description of the durum wheat testing years under rainfed conditions Electronic Supplementary Table S3. Drought tolerance/sensitive indices measured in this study Electronic Supplementary Table S4. Drought tolerance indices for 25 durum wheat genotypes in the first year
(2011–2012)
Electronic Supplementary Table S5. Drought tolerance indices for 25 durum wheat genotypes in the second year (2012–2013)
Electronic Supplementary Table S6. Drought tolerance indices for 25 durum wheat genotypes based on average of two years
Electronic Supplementary Tables S7. Rank of drought tolerance indices for 25 durum wheat genotypes in the first year (2011–2012)
Electronic Supplementary Table S8. Rank of drought tolerance indices for 25 durum wheat genotypes in the second year (2012–2013)
Electronic Supplementary Table S9. Rank of drought tolerance indices for 25 durum wheat genotypes based on average of two years
Electronic Supplementary Table S10. Error variations with different number of neurons in the training, testing and validating phases
Electronic Supplementary Figure S1. Biplot drawn based on the two first components obtained from PCA using the drought tolerance/sensitive indices and grain yield of 25 durum wheat genotypes under supplemental irriga-
tion (Yp) and rainfed (Ys) environments in the first year (A), second year (B), and average two years (C)