1 23
Earth Systems and Environment ISSN 2509-9426
Earth Syst Environ
DOI 10.1007/s41748-019-00118-9
A Drought Adaptation Management System for Groundwater Resources
Based on Combined Drought Index and Vulnerability Analysis
Haitham Al Adaileh, Mohammed
Al Qinna, Károly Barta, Emad Al-
Karablieh, János Rakonczai & Adel
Alobeiaat
1 23
Commons Attribution license which allows
users to read, copy, distribute and make
derivative works, as long as the author of
the original work is cited. You may self-
archive this article on your own website, an
institutional repository or funder’s repository
and make it publicly available immediately.
https://doi.org/10.1007/s41748-019-00118-9 ORIGINAL ARTICLE
A Drought Adaptation Management System for Groundwater Resources Based on Combined Drought Index and Vulnerability Analysis
Haitham Al Adaileh1 · Mohammed Al Qinna2 · Károly Barta3 · Emad Al‑Karablieh4 · János Rakonczai3 · Adel Alobeiaat5
Received: 19 July 2019 / Accepted: 12 September 2019
© The Author(s) 2019
Abstract
Water scarcity is one of the largest global risks in terms of potential impact over the next decade as it affects every continent is manifested by partial or no satisfaction of expressed demand, economic competition for water quantity or quality, disputes between users, irreversible depletion of groundwater, and negative impacts on the environment. Jordanian water crises are exacerbating all of the time due to increased water demands derived from high population growth, sudden fluxes of refugees, economic development, and increased frequency of drought events. These forces stress the urgent need to develop drought adaptation planning based on vulnerability mapping correlated to prolonged weather events. The objective of this research is thus to generate a drought vulnerability map with an emphasis on the severity and probability of drought occurrence, and to propose adaption measures based on groundwater sector impact chain analysis by incorporating numerical scorings for exposure, sensitivity, and adaptive capacities at groundwater basin and Jordanian district levels. Drought impacts on groundwater basins were investigated based on measurements of severity and probability of drought occurrence, and drought exposure over the whole country computed by means of a combined drought index (CDI) that included the precipitation drought index, temperature drought index, and vegetation drought index from 1980 to 2017. Results indicated that drought in Jordan is characterised by a temporal and spatial variability regarding probability and severity. The most prolonged drought events range from mild to moderate, with long periods of exposure that may extend for up to 13 consecutive years. Due to high groundwater basin sensitivity and low adaptive capacity, the groundwater systems in Jordan are fragile and highly vulnerable to drought impacts, being subject to either reduction in quantity and/or deterioration in quality over time. The most vulnerable groundwater basins are the Azraq and Dead Sea regions, while Disi and Yarmouk are also highly vulnerable groundwater basins based on the weak enforcement of transboundary agreements. The proposed drought risk management system based on this research includes proactive and contingency plans enabled by policies and legal frameworks at the national level to ensure sustainable water resilience and governance.
Keywords Combined drought index · Vulnerability map · Drought impacts · Adaptation measures · Jordan
* Haitham Al Adaileh
hadaileh@geo.u‑szeged.hu; hadaileh@hotmail.com Mohammed Al Qinna
qinna@hu.edu.jo Károly Barta barta@geo.u‑szeged.hu Emad Al‑Karablieh karablie@ju.edu.jo János Rakonczai
J.Rakonczai@geo.u‑szeged.hu Adel Alobeiaat
Adel_Alobeiaat@mwi.gov.jo
1 Doctoral School of Environmental Science, The University of Szeged, Szeged, Hungary
2 Department of Land Management and Environment, Faculty of Natural Resources and Environment, Hashemite University, Zarqa, Jordan
3 Department of Physical Geography and Geo‑informatics, The University of Szeged, Szeged, Hungary
4 Department of Agricultural Economics and Agribusiness Management, School of Agriculture, The University of Jordan, Amman, Jordan
5 Ministry of Water and Irrigation, Amman, Jordan
1 Introduction
Jordan’s water scarcity is ranked the second worst in the world, and it is a significant well‑documented problem that has been exacerbated by increasing demand due to high population growth, several fluxes of refugees, increasing economic development needs, increasing frequency and severity of drought events, and climate change (MoEnv 2014). Jordan’s population increased from 6.1 million in 2010 to around 10.3 million in the middle of 2018 (DOS 2018), and despite a lower local growth rate of 2.2%, the huge increase in population continues, being attributable in the main to sudden influxes of refugees from other countries, mainly Iraq and Syria, a process which creates enormous pressure on already‑scarce and depleted water resources (Al‑Karablieh and Salman 2016; Al‑Shibli et al.
2017).
Despite Government efforts to manage the country’s limited water resources and a relentless search for alter‑
native supplies, the available water resources per capita fell from 500 m3 in the 1975 to less than 100 m3 in 2017 (Arsenault 2017; MWI 2016a, b, c, 2017; USAID 2018).
Among all climatic risks, drought is the most threatening in the long term, as it represents a gradual natural hazard that has significant direct and indirect socio‑economic and environmental impacts on all residents in a region (Ala‑
daileh et al. 2019; Liamas and Custodio 2003; Sivakumar 2005). Several studies have highlighted the severity and impact of water stress in Jordan as being caused by climate change impacts (MoEnv 2014; Al Qatarneh et al. 2018; El‑
Naqa and Al‑Shayeb 2009; Margane et al. 2004; Abdulla and Eshtawi 2015; Abdulla and Al Omari 2008). Among the effects noted have been a 70% loss in camel population, around a 70% reduction in cereal harvests, more than 200 springs becoming dry, and drops in groundwater level at a rate of around 2 m/year, though in some highly depleted areas, the reduction can reach 5–20 m/year, decreasing the magnitude of base flow and flood flow in the main wadis (valleys) and reducing the main dams’ storage to around half of capacity in the last 20 years. These impacts have led to increases in food imports, food insecurity, increases in desertification trends, frequent deterioration of land pro‑
ductivity, increases in health problems, increased migra‑
tion from rural areas, reduction in investments, and even increased unemployment (Water Scarcity 2017; Battikhi 2013; Mohammad et al. 2015; Abu‑Allaban et al. 2015;
Al‑Tabbal and Al‑Zboon 2012).
A series of studies has indicated that the Jordan sur‑
face and groundwater basins are likely to experience more severe drought in the period 2031–2060 than in the period 1961–1990, with the expectation of increased severity of droughts, more frequent droughts and moderate droughts
becoming severe droughts (Törnros and Menzel 2013;
Al‑Adamat et al. 2003; Al‑Mashagbah and Al‑Farajat 2013; Rahman et al. 2015). Successive droughts have occurred at least three times over the past 40 years, and the rate at which these occur is expected to increase every 20–25 years, with a regular average drought of 3 years and a severe drought every 6–7 years. These increases in droughts and further negative climate change effects in Jordan are thus expected to further decrease water avail‑
ability by 15–20% (El‑Naser 2014; Goode et al. 2013; Al‑
Qinna et al. 2011; Rajsekhar and Gorelick 2017; Hajar et al. 2019).
In addition to issues with water governance in the form of lax enforcement of rules and regulations, a lack of equity and transparency has resulted in continuous mining of renew‑
able groundwater resources, with extraction rates currently at 50% over safe yields, increasing water salinity, reducing water table levels, and increasing pumping costs (Salman and Al‑Karablieh 2004). Efficient management of scarce water resources is thus an existential necessity (World Bank 2016), critical to the livelihoods and well‑being of Jordan’s people and essential to the country’s lasting stability. With‑
out securing its water assets, Jordan risks imminent eco‑
nomic slowdowns, health hazards, social disruptions, and serious conflicts over water resources (Al‑Karablieh and Salman 2016; MWI 2016d, 2018).
In the last millennium, no special legislation dealing with drought was implemented, as it was not classified as a dis‑
aster; thus, only ad hoc interventions were implemented as actions after the occurrence of the event. Drought manage‑
ment in Jordan still lacks proactivity, apart from that directed primarily for relief, and it also lacks coordination, being managed by multiple different departments within the rel‑
evant institutions (MWI 2018). For example, the Ministry of Agriculture (MOA) established an Agriculture Risk Man‑
agement Fund (ARMF) in 2009 to provide feed subsidies for those who were impacted by drought and initiated restocking programs that focused on providing supplementary feeds to safeguard livestock (MOA 2009). Similarly, the Ministry of Water and Irrigation (MWI) established several strategies, such as the National Water Strategy (2016–2025) (MWI 2016a) change policies to encourage a resilient water sector (MWI 2016d) in which drought could be handled through not only in terms of supply augmentation and management, including rationing of water services, but also with regard to demand management measures and the adoption of a public information policies. Despite all of these measures, however, the predicted scarcity problem remains a major challenge for water managers and the country at large (MWI 2016b, d).
In 2018, the MWI release the Water Sector Policy for Drought Management Strategy (MWI 2018) to establish a drought early warning unit to provide a monitoring system (MWI 2018). This outlined the measures required to achieve
long‑term national goals for water security, driven by out‑
comes based on previously adopted strategies, policies, and plans updated on the basis of results, which are now an inte‑
gral part of the overall management efforts.
Recently, drought was included as a national crisis by the Jordanian National Center for Security and Crisis Man‑
agement (NCSCM), established in 2015. The NCSCM’s duties include coordinating and unifying all efforts made by national institutions to enable them to face national crises in various forms to help achieve more strategic adjustment processes and secure a stable and secure national environ‑
ment. The NCSCM aims to achieve its mission by harness‑
ing national potential and unifying the efforts of relevant national institutions to achieve professionalism in both prep‑
aration for and response to national crises, both natural and manmade, reducing effort, time, costs, and possible losses (NCSCM 2015). In 2017, the Government of Jordan thus delegated the responsibility for establishing and institution‑
alising the national disaster risk reduction (DRR) platform to the NCSCM.
Drought is a pervasive natural disaster that causes severe environmental, economic, health, and societal impacts.
Jordan has witnessed several droughts recently, along with recurring summer heat waves, which are likely to be conse‑
quences of climate change and global warming; as surface and groundwater resources in Jordan are thus threatened, it is vital to develop adaptation planning based on vulner‑
ability mapping that takes into account prolonged weather events such as drought, and this need justifies this research.
The aim of this study is to generate a drought vulnerability map for the Jordanian groundwater system based on assess‑
ment of the climatic exposure, groundwater basin sensitiv‑
ity and actual adaptive capacity at district level, and also to propose adaption measures based on groundwater sector impact chain analysis to improve the country’s preparedness for likely future droughts.
2 Methodology
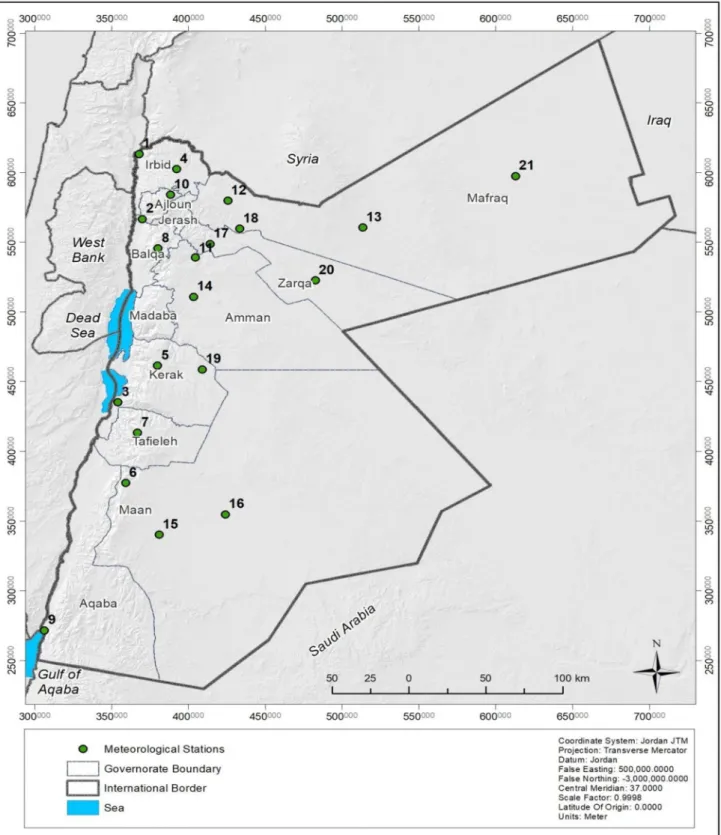
2.1 Study AreaThe Hashemite Kingdom of Jordan, one of the Middle East and North Africa (MENA) countries, is located 80 km east of the Mediterranean Sea, between 29°11′ and 33°22′ N, and 34°19′ and 39°18′ E. The country as a whole covers an area of 89,318 km2, of which 88,794 km2 is considered land, with territorial waters covering 524 km2, and including the Dead Sea, and the Gulf of Aqaba at 430 km2 and 94 km2, respec‑
tively. The land area consists, topographically, of 550 km2 of heights, 10,000 km2 of plains, 8244 km2 of the Rift valley, and 70,000 km2 of desert, including the Badia (Fig. 1).
Jordan is a semi‑arid and drought‑prone country that is heavily influenced by the range of mountains to the West (MoEnv 2016). The western part of Jordan, the Highlands, has a Mediterranean climate characterised by a hot, dry summer and a cool, wet winter, which are separated by two short transitional periods. This generates two contrast‑
ing seasons, the relatively mild and rainy months from October to May, and a hot and dry summer during the rest of the year. During the summer months, temperatures average around 32 °C with recorded highs of up to 49 °C.
In the winter, temperatures drop markedly, with averages of around 13 °C. The dry desert and steppe regions of the country receive less than 100 mm of rain a year, but the quantity of precipitation increases with the rise in eleva‑
tion in the highlands east of the Jordan Valley, ranging from 300 mm to more than 500 mm in the south and north, respectively). Frost and occasional snow can be seen in Amman during the height of the winter season, and in general, the farther inland from the Mediterranean Sea an area of the country lies, the greater the contrast there between the two seasons, and the less rainfall received.
Jordan is thus mostly arid (90%) and semi‑arid (8%), with diverse agro‑ecological zones (MoEnv 2016).
Potential evapotranspiration typically exceeds rainfall.
Approximately 92% of rainfall evaporates, while only 5.4% recharges the groundwater and the remaining 2.4%
becomes surface water (Salameh and Bannayan 1993). The country can be classified into three main physiographical regions: the Lowlands (Ghor Region), the Highlands, and the Desert lands (Badia), which vary in elevation from 1854 m above mean sea level (amsl) at the Um Dami Mountain to 417 m below mean sea level at the Dead Sea (GLOWA 2013). The Lowlands, a part of the Great Rift Valley (JRV), extend from the northwestern part of the country towards the south western corner, with eleva‑
tions ranging from 197 m below msl in the north to 417 below msl at the Dead Sea. The Highlands and Marginal Steppes region extend north–south to the east of the JRV, stretching from the Yarmouk River in the north to Ras El‐Naqab in the south. The mountains peaks’ elevations vary from 1150 m amsl in Ras Muneef to 1365 m amsl at Al–Shoubak, and the height exceeds 1500 m at El‐Qurain.
The Desert lands extend north–south from the eastward foot of the Highlands, with elevations ranging from 600 to 750 m amsl.
Jordan ratified the United Nations Framework Conven‑
tion on Climate Change in 1993 and the Kyoto Protocol in 2003. Analysis of historical data associated with the cli‑
mate state in Jordan as published in the third national com‑
munication report showed that there has been a decline in precipitation at a rate of 1.2 mm per year, as well as increases in temperature of an average of 0.02 °C annually (MoEnv 2016).
2.2 Water Sector Status at Jordan
The water sector is regulated by the Ministry of Water and Irrigation By‑Law No. 14 (2014), Water Authority of Jordan
Law No. 18 (1988) and its amendments, and Jordan Val‑
ley Authority By‑Law No. 30 (2001). Other relevant laws include Public Health Law No. 47 (2008), Environmental Protection Law No. 85 (2006), and Groundwater By‑Law
Fig. 1 The map of the Hashemite Kingdom of Jordan as a study area
No. 85 (2002) and its amendments. The amendments to By‑Law No. 14 (2014) are the instrument by which MWI assumes policy and strategic leadership of the water sector (Al‑Karablieh and Salman 2016; Molle et al. 2017).
Jordan’s renewable water resources are limited and insuf‑
ficient to national demand. Jordan has just 15 surface water basins and 12 groundwater basins, with about 40% of total water resources being shared water (Figs. 2, 3). The quantity of renewable water resources available for different purposes is around 853 mcm annually, yet the total amount used for all sectors was 1053.6 mcm for 2017, while the estimated water demand quantity for all sectors now is 1412 mcm. The Govern‑
ment has tried to compensate for the difference between water demand and supply by providing implementing all possible techniques to harvest water and reuse unconventional water as much as possible (Wolff et al. 2012). Currently, there are 12 dams with 335.3 mcm total capacity; however, their storage was only 227 mcm for 2017. In addition, 361 desert dams, earth and concrete ponds, have been designed to hold 111.7 mcm, and the government has constructed 34 wastewater treatment plants with a total capacity of 0.639 mcm/day (MWI 2017).
The tremendous need for water in all sectors is being met by groundwater abstraction above the safe yield, which is imposing groundwater depletion beyond recharge rates along with quality deterioration. Deficits in groundwater are clear at all basins, with the groundwater levels in the main aqui‑
fers dropping at a rate of 2 m/year; however, the decline in some depleted areas has reached as high as 20 m (Fig. 2).
It is important to note that the number of working wells in Jordan exceeds 3200, yet many further illegal wells are being drilled every year, with the estimates for non‑revenue water reaching as high as 48% for 2017.
2.3 Combined Drought Index (CDI)
Daily rainfall, air temperature and weather data for 21 mete‑
orological stations were obtained from the Jordan Meteoro‑
logical Department (JMD). This climatic data represent the long‑term records from 1980 to 2017. The characteristics of the meteorological stations are presented in Table 1.
There seasonal drought indices were used to calculate the combined drought index, those were precipitation drought index (PDI), temperature drought index (TDI), and vegeta‑
tion drought index (VDI). Both PDI and TDI are indica‑
tives for meteorological–climatic droughts, while the VDI reflects the vegetation stress caused by adverse climatic and hydrological factors. The PDI, TDI, and VDI indices were calculated using the following equations (Balint et al. 2011):
(1) PDIi,m=
1 IP
∑IP−1 j=0 P∗i,(m−j)
1 (n×IP)
∑n k=1
�
∑IP−1 j=0 P∗(m−j),k
�×
�
�
�
�
�
� RL(P∗)m,i
1 n
∑n k=1RL(P∗)m,k
� ,
where P* is the modified monthly precipitation amount, T*
is the modified monthly temperature, NDVI* is the modified monthly average normalised difference vegetation index, IP is the interest period (6 months in this case), RL (P) (run length) is the maximum number of successive months below long‑term average rainfall in the interest period, RL (T) is the maximum number of successive months above long‑term average temperature in the IP, RL (NDVI) is the maximum number of successive months below long‑term average NDVI in the IP, n is the number of years with relevant data, j is a summation parameter for the IP, and k is the summa‑
tion parameter covering the years for which relevant data are available (SWALIM 2011).
The normalised difference vegetation index (NDVI) val‑
ues at a spatial resolution of 8 km were computed using the following equation (Kogan 1990):
where NIR is the near‑infrared response, R is the visible red portion of the spectrum bands of the Advanced Very High Resolution Radiometer (AVHRR) at the National Oceanic and Atmospheric Administration (NOAA). The data were provided by Global Inventory Modeling and Mapping Stud‑
ies (GIMMS) and downloaded from the University of Mary‑
land Global Land Cover Facility Data Distribution centre (http://www.glcf.umiac s.umd.edu/data/gimms /).
The combined drought index (CDI) was computed as a weighted average of the three seasonal drought indices, as in Eq. (5). The weighs were assigned according to Balint et al.
(2011) based on partial correlation analyses as 50%, 25%, and 25% for precipitation drought index (PDI), temperature drought index (TDI), and vegetation drought index (VDI), respectively. The higher weight assigned to PDI is an indica‑
tion for the importance as a determinant drought factor as compared to temperature and vegetation drought indices.
(2) TDIi,m=
1 IP
∑IP−1 j=0
� Ti,(m−j)∗
�
1 (n×IP)
n
∑
k=1
�
∑IP−1 j=0 T(m−j),k∗
�×
�
�
�
�
�
� RL(T∗)m,i
1 n
∑n
k=1RL(T∗)m,k
� ,
(3) VDIi,m=
1 IP
∑IP−1 j=0 NDVI∗
i,(m−j) 1
(n×IP)
∑n k=1
�
∑IP−1 j=0 NDVI∗
(m−j),k
�
×
�
�
�
�
�
� RL(NDVI∗)m,i
1 n
∑n
k=1RL(NDVI∗)
m,k
� ,
(4) NDVI= NIR−R
NIR+R,
(4) CDIi,m=0.5×PDIi,m+0.25×TDIi,m+0.25×VDIi,m.
Fig. 2 Groundwater spatial map and status in Jordan for the year 2017 (modified after (MWI 2017))
Drought severity at each meteorological station was clas‑
sified into five drought categories, again as recommended by Balint et al. (2013), and these are presented in Table 2. The probability of occurrence under each category was estimated by dividing the count of drought events per category over the total count of drought events.
Fig. 3 Groundwater system vul‑
nerability determination sketch Climate Change
Drought Exposure (E)
Social, economic, and instuonal capacity
System Sensivity (S)
Drought Impacts (I)
Cognion, Percepon, and
Willingness
Adapve Capacity (C)
Groundwater System Vulnerability (V)
Table 1 Statistical summary of annual precipitation data by station
No. Station name Altitude (m) Precipitation (mm) Temperature (°C)
Mean annual Min Max Max Min Mean
1 Baqura − 170 392.4 174.3 918.3 33.6 10.2 22.6
2 Deir Alla 330 282.3 117.0 599.0 35.0 11.5 24.3
3 Ghor Safi − 350 72.4 18.3 151.8 36.9 13.8 25.8
4 Irbid 616 459.6 216.8 912.9 29.1 5.8 18.3
5 Rabba 920 337.3 138.0 606.0 27.7 4.3 16.9
6 Shoubek 1365 251.6 95.0 482.0 24.6 0.7 13.3
7 Tafieleh 1200 203.8 85.0 358.0 27.1 3.4 16.1
8 Salt 796 550.1 246.0 1130. 27.8 3.9 16.9
9 Aqaba 51 25.6 1.0 86.0 35.5 11.8 24.9
10 Ras Munief 1150 463.9 217.0 913.0 25.5 1.4 14.8
11 Amman Airport 790 254.2 111.0 548.0 30.0 4.8 18.2
12 Mafreq 686 154.8 65.0 301.0 28.8 4.6 17.3
13 Safawi H5 674 70.1 16.0 158.0 33.6 5.1 19.9
14 Queen AIA 722 155.9 56.0 326.0 28.0 4.4 16.9
15 Maan 1069 41.2 12.0 108.0 30.2 4.5 18.2
16 Al‑Jafr 865 31.4 1.0 135.0 31.0 5.1 13.1
17 Zarqa 664 129.5 48.0 258.0 30.7 5.8 19.2
18 Wadi Dhuleil 575 141.0 54.5 276.0 30.5 5.2 18.4
19 Qatraneh 730 97.3 25.0 156.0 28.6 5.1 17.7
20 Azraq South 610 54.0 9.0 149.0 32.4 5.8 19.8
21 Reweished H4 683 81.2 16.0 168.0 32.9 4.4 19.8
Table 2 Adopted CDI drought categories
Source: (Balint et al. 2011;
SWALIM 2011)
Drought category CDI value No drought > 1.0
Mild 1.0–0.8
Moderate 0.8–0.6
Severe 0.6–0.4
Extreme < 0.4
2.4 Generating a Drought Vulnerability Map
Before commencing vulnerability analysis, an “Impact Chain Framework” was drafted based on the theory of inter‑
action between exposure, sensitivity, and adaptive capacity factors controlling or affecting the groundwater systems in Jordan. The framework was generated based on multiple stakeholders’ assessment, with stakeholders ranging from governmental ministries through academia, and research centres.
Vulnerability is a function of the character, magnitude, and rate of drought to which a system is exposed, along with its sensitivity, and adaptive capacity (Al‑Bakei et al. 2019).
Jordan’s groundwater drought vulnerability was assessed for the whole country based on a scoring technique for drought impacts (I) as identified through both drought exposure (E)
and the sensitivity (S) of the country’s groundwater sector, in addition to existing adaptive capacity (C) (Fig. 3).
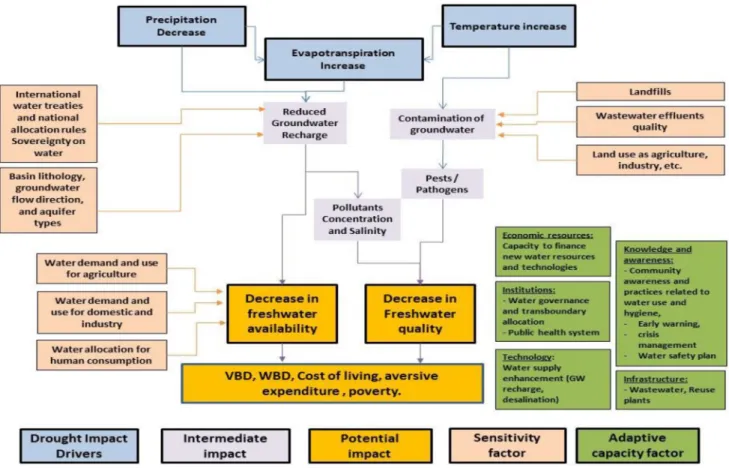
Figure 4 shows the impact chain framework for the drought vulnerability assessment for the groundwater systems in Jor‑
dan as generated based on multiple stakeholders’ assessment.
The framework identifies the factors to consider in the vul‑
nerability assessment. Exposure, the degree of climatic stress upon a groundwater system, was categorised by merging two factors: drought severity and probability of occurrence derived from CDI Table 3).
Groundwater sensitivity, the degree to which the ground‑
water system is affected by climate‑related variables, was determined at each basin using a cumulative weighted func‑
tion based on existing groundwater conditions (Eq. 1). In this study and based on generated impact chain framework, the following factors were implemented in the sensitivity analyses:
groundwater safe yield, abstraction, and depletion:
Fig. 4 Impact chain framework for the drought vulnerability assessment of groundwater systems in Jordan
Table 3 Scoring of drought
exposure Score 1 Score 2 Score 3 Score 4 Score 5
Drought severity CDI ≥ 1 1.0 > CDI > 0.8 0.80 > CDI > 0.6 0.6 > CDI > 0.4 CDI ≤ 0.4 Probability of
occurrence (Pr) PO ≤ 10% 10% > Pr > 33% 33% > Pr > 67% 67% > Pr > 90% Pr ≥ 90%
where Fi is each individual factor and Wi is the weight assigned to each factor.
The individual groundwater basin adaptive capacity, the ability of system to adjust to climate change and moder‑
ate potential damage and to cope with the consequences, was estimated using a cumulative weighted function of the factors included in Table 4 as recommended and generated by the impact chain framework. These include economic, institutional, technological, knowledge and awareness based, and infrastructure aspects.
Groundwater sector vulnerability to drought was assessed using a scoring technique by which the vulnerabil‑
ity emerged as the ratio of impact to adaptive capacity as discussed in impact chain framework in Fig. 3. The scores were estimated for each vulnerability class based on expert judgments of the associated impacts (I) and sensitivity (S) of the country’s water sector, taking into account existing adaptive capacity (C). Five water vulnerability categories were suggested: extremely vulnerable, highly vulnerable, moderately vulnerable, low vulnerability, very low vulner‑
ability (Table 5).
(5) Cumulative weighted function =
∑n
i=1Wi×Fi
∑n
i=1Wi , 2.5 Mapping Drought Impacts
Simple Kriging interpolation was generated within ArcGIS (10.5) software. The long‑term drought vulnerability map was implemented in four steps: the determination of distri‑
bution type; characterisation of spatial distribution through computation of semi‑variance clouds in all directions; selec‑
tion and construction of the best empirical fit; prediction at unsampled points using a point Kriging technique (Goo‑
vaerts 1997, 1999; Selker et al. 1999; Salman et al. 2009;
Bancheri et al. 2018).
2.6 Proposing Drought
Assessing drought vulnerability through the application of a multi‑stakeholder approach encourages the identification of sustainable adaptation strategies that could significantly improve infrastructure resilience. A long list of possible adaptation options/measures was thus proposed by multidis‑
ciplinary stakeholders in response to the identified hazards and vulnerabilities in groundwater systems. The measures were categorised under seven different themes: (1) demand management, (2) supply side management, (3) cooperation with neighbouring countries and the international commu‑
nity, (4) integrated water information and database devel‑
opment, (5) training, awareness, and capacity building, (6) innovation and technology, and (7) Strategic planning/
Policy/Legislations/Government Participation.
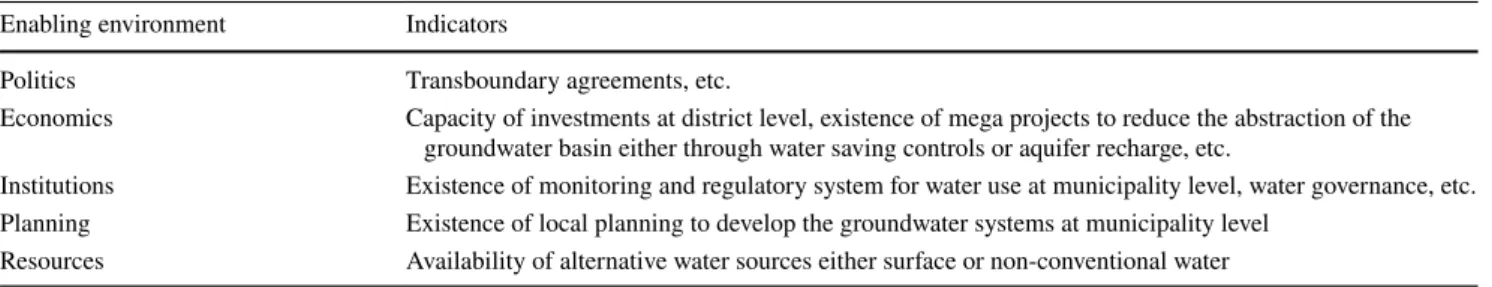
Table 4 Groundwater basin adaptive capacity factors included in the vulnerability assessment Enabling environment Indicators
Politics Transboundary agreements, etc.
Economics Capacity of investments at district level, existence of mega projects to reduce the abstraction of the groundwater basin either through water saving controls or aquifer recharge, etc.
Institutions Existence of monitoring and regulatory system for water use at municipality level, water governance, etc.
Planning Existence of local planning to develop the groundwater systems at municipality level Resources Availability of alternative water sources either surface or non‑conventional water
Table 5 Scoring of drought vulnerability
Drought impact score
AdaptiveCapacity
Score 0.1 – 1 1.1 – 2 2.1 – 3 3.1 – 4 4.1 - 5
0.1 – 1 Very Low Low Low Moderate Moderate
1.1 – 2 Low Low Moderate Moderate Moderate
2.1 – 3 Low Moderate Moderate High High
3.1 – 4 Moderate Moderate High High Extreme
4.1 - 5 Moderate High High Extreme Extreme
3 Results
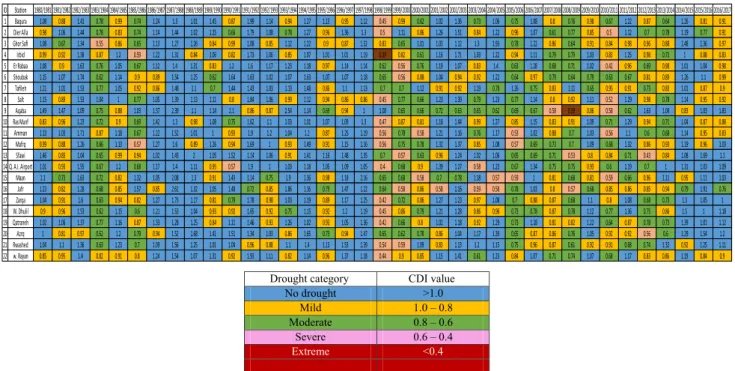
3.1 Generating the Combined Drought Index (CDI) Based on Eqs. (1–4), the seasonal combined drought indi‑
ces were generated for all meteorological stations from the period 1980–2017. The CDI magnitude varies significantly by the year and station, ranging from extreme drought to no drought, as indicated by associated CDI scores from 0.39 to 2.61 (Table 6). Almost all regions suffer from drought to some degree, but not all the regions experience droughts at the same time. Temporal distribution and frequency of dry periods vary markedly among the regions, and in terms of timescale, the longest dry spell duration was 13 years, at Aqaba. On the other hand, as the table shows, while the longest drought periods were during the period from 2005 to 2014, most parts of the country witnessed severe drought during the period 1998–2000.
Since drought in Jordan is a temporal and spatial phe‑
nomenon that varies by location (station) and year of impact, it is thus inconvenient to measure the average CDI magni‑
tudes for all years (drought and non‑drought years), as this would likely be around one. To indicate the exact probability of drought events in each drought category, drought prob‑
abilities were thus determined for each station by taking into account the number of events in each category divided by total drought events (Table 7). Results indicate that the most common or frequent occurring droughts range from mild to moderate in category, as indicated by the highest probability, while severe and extreme droughts are rare.
The average magnitude for each drought category was calculated based on sum of CDIs per category over the total number of drought events per category (Table 8). The results indicate that all stations had similar CDI values for the mild and moderate drought categories; however, the magnitudes vary significantly at both severe and extreme drought catego‑
ries which indicates that severe and extreme drought cases are more site specific (i.e. micro‑scale impacts).
3.2 Drought Vulnerability Map
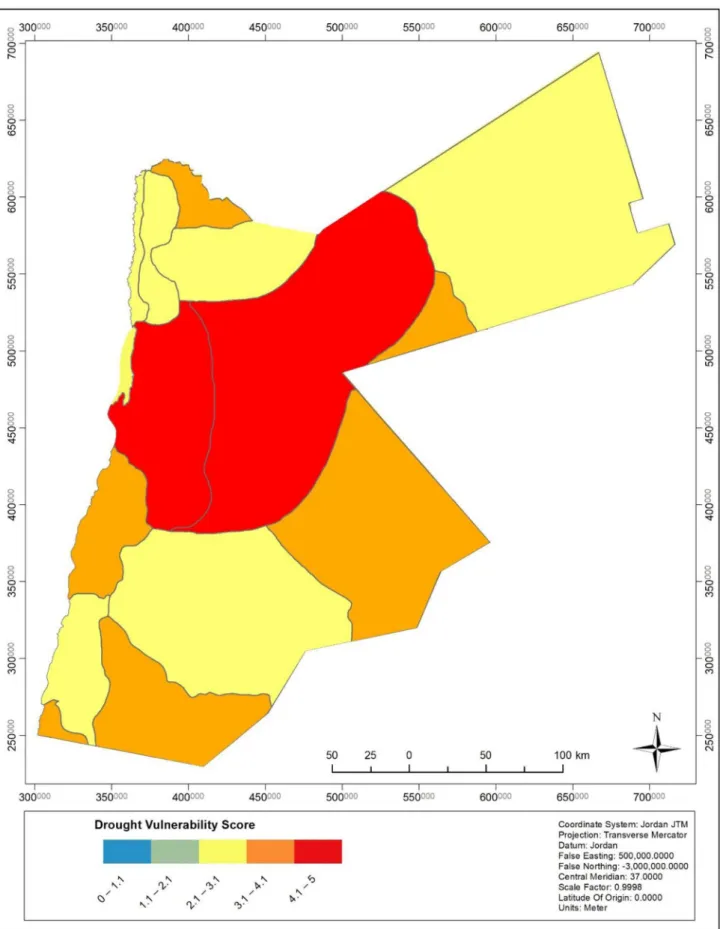
Based on the scores for both district and groundwater basin levels, a drought vulnerability map was generated (Fig. 5).
The generated scores vary from 2.1 to 4.6 ranging from moderate to high vulnerability. The highest scores and thus most vulnerable basins are Azraq and Dead Sea ground‑
water basins. The high generated vulnerability scores are derived from the moderate to high impacts and associated by moderate to low adaptive capacity. Both Azraq and Dead Sea groundwater basins are categorised within the highest impact and low adaptive capacity scores.
4 Discussion
Based on the generated groundwater vulnerability map that is derived from CDI assessment along with real groundwater sensitivity and actual adaptive capacity analyses, the country of Jordan is experiencing both micro‑ and macro‑drought events with varying spatial and temporal range of impacts.
Table 6 CDI values regarding each station and year from 1980 to 2017
Drought category CDI value
No drought >1.0
Mild 1.0 – 0.8
Moderate 0.8 – 0.6
Severe 0.6 – 0.4
Extreme <0.4
ID Staon 1980/1981 1981/1982 1982/1983 1983/1984 1984/1985 1985/1986 1986/1987 1987/1988 1988/1989 1989/1990 1990/1991 1991/1992 1992/1993 1993/1994 1994/1995 1995/1996 1996/1997 1997/1998 1998/1999 1999/2000 2000/2001 2001/2002 2002/2003 2003/2004 2004/2005 2005/2006 2006/2007 2007/2008 2008/2009 2009/2010 2010/2011 2011/2012 2012/2013 2013/2014 2014/2015 2015/2016 2016/2017
1 Baqura 1.08 0.88 1.41 0.78 0.99 0.74 1.24 1.3 1.01 1.45 0.87 1.99 1.14 0.94 1.27 1.13 0.95 1.12 0.45 0.99 0.62 1.02 1.36 0.73 1.06 0.75 1.08 0.8 0.76 0.98 0.67 1.22 0.87 0.64 1.26 0.81 0.91
2 Dier Alla 0.98 1.06 1.44 0.78 0.83 0.74 1.14 1.44 1.02 1.25 0.66 1.79 1.08 0.78 1.27 0.96 1.36 1.3 0.5 1.11 0.86 1.26 1.51 0.84 1.22 0.96 1.07 0.61 0.77 0.85 0.5 1.12 0.7 0.78 1.19 0.77 0.91
3 Ghor Safi 1.08 0.67 1.34 0.55 0.86 0.65 1.13 1.27 1.26 0.84 0.99 1.08 0.85 1.12 1.22 0.9 0.87 1.32 0.83 0.65 1.01 1.03 1.12 1.3 1.93 0.78 1.22 0.86 0.64 0.91 0.84 0.98 0.96 0.88 1.48 1.36 0.97
4 Irbid 0.99 0.92 1.38 0.87 1.2 0.59 1.22 1.31 0.84 1.06 0.82 1.73 1.06 0.85 1.07 1.01 1.01 1.19 0.39 0.82 0.61 1.16 1.71 1.03 1.22 0.94 1.11 0.79 0.79 1.03 0.83 1.25 0.98 0.73 1 0.88 0.83
5 Er Rabaa 1.08 0.9 1.63 0.76 1.05 0.67 1.12 1.4 1.31 0.83 1.2 1.6 1.17 1.23 1.18 0.97 1.14 1.14 0.62 0.56 0.76 1.19 1.07 0.83 1.4 0.63 1.28 0.68 0.71 1.02 0.42 0.96 0.69 0.98 1.01 1.04 0.98
6 Shoubak 1.15 1.07 1.74 0.62 1.14 0.9 0.89 1.54 1.25 0.62 1.64 1.63 1.02 1.07 1.63 1.07 1.07 1.18 0.65 0.56 0.88 1.04 0.94 0.92 1.22 0.64 0.97 0.79 0.64 0.79 0.63 0.67 0.81 0.89 1.26 1.1 0.99
7 Tafileh 1.21 1.01 1.53 0.77 1.05 0.92 0.86 1.48 1.1 0.7 1.44 1.43 1.03 1.13 1.48 0.86 1.1 1.13 0.7 0.7 1.12 0.91 0.92 1.19 0.78 1.26 0.75 0.83 1.11 0.65 0.95 0.91 0.73 0.83 1.01 0.87 0.9
8 Salt 1.15 0.89 1.53 1.04 1 0.77 1.05 1.39 1.13 1.11 0.8 1.84 1.06 0.99 1.12 0.94 0.86 0.86 0.45 0.77 0.66 1.23 1.39 0.79 1.23 0.77 1.14 0.8 0.92 1.11 0.52 1.29 0.98 0.78 1.14 0.95 0.92
9 Aqaba 1.49 1.47 1.09 0.75 0.88 1.03 1.37 2.39 1.1 1.14 2.1 0.86 0.87 2.54 1.14 0.69 0.94 1 1.08 0.65 0.66 0.72 0.63 0.65 0.62 0.69 0.67 0.58 0.39 0.86 0.58 0.62 1.63 1.04 0.83 1.03 1.83
10 Ras Munf 0.83 0.96 1.23 0.72 0.9 0.69 1.42 1.3 0.98 1.08 0.75 1.62 1.1 1.03 1.01 1.07 1.09 1.3 0.47 0.87 0.81 1.18 1.44 0.99 1.27 0.85 1.15 0.83 0.91 1.09 0.71 1.29 0.94 0.71 1.04 0.87 0.88
11 Amman 1.13 1.03 1.71 0.87 1.18 0.67 1.22 1.52 1.01 1 0.93 1.9 1.2 1.04 1.2 0.87 1.25 1.19 0.56 0.78 0.58 1.21 1.16 0.76 1.17 0.53 1.02 0.88 0.7 1.03 0.56 1.1 0.6 0.68 1.14 0.95 0.83
12 Mafrq 0.99 0.88 1.26 0.66 1.13 0.57 1.27 1.6 0.89 1.26 0.94 1.69 1 0.93 1.49 0.91 1.15 1.16 0.56 0.75 0.78 1.32 1.37 0.85 1.08 0.57 0.69 0.73 0.7 1.09 0.68 1.32 0.86 0.93 1.19 0.96 1.03
13 Sfawi 1.46 0.85 1.04 0.65 0.99 0.94 1.02 1.43 2 1.05 1.52 1.14 1.06 0.91 1.41 1.16 1.48 1.35 0.7 0.57 0.63 0.96 1.24 1.02 1.06 0.65 0.69 0.71 0.53 0.8 0.84 0.71 0.43 0.84 1.08 1.69 1.1
14 Q. A.I. Airport 1.01 0.93 1.55 0.67 1.2 0.68 1.17 1.4 1.11 0.95 0.57 1.9 1 1.03 1.18 1.05 1.09 1.05 0.4 0.68 0.9 1.39 1.27 0.58 1.23 0.67 1.34 0.75 0.75 0.93 0.6 1.19 0.7 1 1.31 1.03 1.09
15 Maan 1.1 0.73 1.63 0.72 0.82 1.32 1.05 2.08 1.3 0.91 1.43 1.14 0.75 1.9 1.36 0.98 1.18 2.16 0.65 0.68 0.58 0.7 0.78 1.18 0.57 0.59 1 0.81 0.68 0.81 0.59 0.66 0.96 1.11 0.95 1.11 1.03
16 Jafr 1.23 0.82 1.28 0.68 0.85 1.57 0.85 2.61 1.32 1.05 1.48 0.72 0.85 1.86 1.16 0.79 1.47 1.22 0.64 0.58 0.86 0.58 1.16 0.59 0.58 0.78 1.03 0.8 0.57 0.68 0.85 0.86 0.85 0.94 0.79 1.91 0.76
17 Zarqa 1.04 0.91 1.6 0.63 0.94 0.82 1.27 1.73 1.17 0.81 0.79 1.78 0.98 1.03 1.19 0.89 1.17 1.25 0.42 0.72 0.86 1.27 1.23 0.97 1.08 0.7 0.88 0.87 0.68 1.1 0.8 1.08 0.68 0.73 1.3 1.05 1
18 W. Dhulil 0.9 0.96 1.53 0.62 1.15 0.6 1.21 1.53 1.04 0.93 0.92 1.65 0.92 0.75 1.15 0.92 1.2 1.19 0.45 0.86 0.79 1.21 1.28 0.86 0.96 0.73 0.78 0.87 0.78 1.12 0.77 1.36 0.75 0.86 1.5 1 1.18
19 Qatraneh 1.02 1.06 1.37 0.77 1.16 0.87 1.33 1.28 1.25 0.84 1.11 1.46 0.93 1.26 1.02 0.93 1.05 1.36 0.42 0.66 0.8 1.02 1.18 0.92 1.29 0.73 1.28 0.81 0.82 1.22 0.64 0.87 0.78 0.73 1.39 1.01 1.12
20 Azrq 1 0.81 0.97 0.62 1.2 0.79 0.94 1.52 1.68 1.41 1.51 1.34 1.03 0.86 1.65 0.73 0.94 1.47 0.65 0.62 0.78 0.86 1.04 1.17 1.39 0.65 0.87 0.86 0.76 1.05 0.92 0.92 0.56 0.6 1.29 1.54 1.2
21 Rwashed 1.04 1.1 1.36 0.63 1.23 0.7 1.09 1.56 1.25 1.01 1.04 0.96 0.88 1.1 1.4 1.13 1.53 1.39 0.54 0.59 1.09 0.83 1.13 1.2 1.15 0.75 0.96 0.87 0.61 0.92 0.91 0.68 0.74 1.32 0.92 1.25 1.11
22 w. Rayan 0.85 0.95 1.4 0.82 0.91 0.8 1.24 1.54 1.07 1.31 0.92 1.93 1.11 0.82 1.14 0.96 1.37 1.18 0.44 0.9 0.85 1.15 1.41 0.61 1.23 0.84 1.07 0.71 0.74 1.07 0.68 1.17 0.83 0.86 1.19 0.84 0.9
Table 7 Probability of drought occurrence at each station
Italic values indicate P < 0.05
ID Station Probability of drought occurrence (drought events/total events)
Probability of drought under different category (drought event per category/
total drought events)
Overall drought probability Mild Moderate Severe Extreme
1 Baqura 0.54 0.55 0.40 0.05 0.00 1.50
2 Dier Alla 0.51 0.42 0.47 0.11 0.00 1.68
3 Ghor Safi 0.54 0.70 0.25 0.05 0.00 1.35
4 Irbid 0.49 0.67 0.22 0.06 0.06 1.50
5 Er Rabaa 0.46 0.41 0.47 0.12 0.00 1.71
6 Shoubak 0.51 0.47 0.47 0.05 0.00 1.58
7 Tafileh 0.51 0.58 0.42 0.00 0.00 1.42
8 Salt 0.51 0.58 0.32 0.11 0.00 1.53
9 Aqaba 0.54 0.30 0.55 0.10 0.05 1.90
10 Ras Munf 0.51 0.68 0.26 0.05 0.00 1.37
11 Amman 0.43 0.38 0.38 0.25 0.00 1.88
12 Mafrq 0.54 0.50 0.35 0.15 0.00 1.65
13 Sfawi 0.49 0.44 0.39 0.17 0.00 1.72
14 Q. A. I. Airport 0.41 0.27 0.53 0.20 0.00 1.93
15 Maan 0.54 0.35 0.45 0.20 0.00 1.85
16 Jafr 0.62 0.43 0.35 0.22 0.00 1.78
17 Zarqa 0.51 0.58 0.37 0.05 0.00 1.47
18 W. Dhulil 0.57 0.52 0.43 0.05 0.00 1.52
19 Qatraneh 0.43 0.56 0.38 0.06 0.00 1.50
20 Azrq 0.54 0.50 0.45 0.05 0.00 1.55
21 Rwashed 0.43 0.50 0.38 0.13 0.00 1.63
22 Wadi Rayan 0.54 0.75 0.20 0.05 0.00 1.30
Table 8 Average drought
magnitude at each station ID Station Non Mild Moderate Severe Extreme
1 Baqura 1.24 0.91 0.71 0.45 0.00
2 Dier Alla 1.26 0.90 0.73 0.50 0.00
3 Ghor Safi 1.25 0.90 0.68 0.55 0.00
4 Irbid 1.20 0.88 0.73 0.59 0.39
5 Er Rabaa 1.21 0.92 0.69 0.49 0.00
6 Shoubak 1.27 0.91 0.67 0.56 0.00
7 Tafileh 1.21 0.89 0.72 0.00 0.00
8 Salt 1.22 0.90 0.76 0.49 0.00
9 Aqaba 1.44 0.87 0.67 0.58 0.39
10 Ras Munf 1.21 0.89 0.72 0.47 0.00
11 Amman 1.21 0.89 0.70 0.56 0.00
12 Mafrq 1.26 0.91 0.71 0.57 0.00
13 Sfawi 1.28 0.89 0.68 0.51 0.00
14 Q. A. I. Airport 1.21 0.93 0.69 0.52 0.00
15 Maan 1.36 0.89 0.71 0.58 0.00
16 Jafr 1.45 0.85 0.73 0.58 0.00
17 Zarqa 1.24 0.88 0.70 0.42 0.00
18 W. Dhulil 1.27 0.91 0.73 0.45 0.00
19 Qatraneh 1.20 0.87 0.72 0.42 0.00
20 Azrq 1.32 0.90 0.69 0.56 0.00
21 Rwashed 1.21 0.91 0.69 0.57 0.00
22 Wadi Rayan 1.27 0.87 0.69 0.44 0.00
Fig. 5 Drought vulnerability score map for Jordan
At a regional scale, the long‑term droughts are more likely to range from mild to moderate categories with duration that may last up to 12 consecutive years. However, at micro‑
scale, the drought impacts may reach severe and extreme levels with durations up to five consecutive years as at Irbid and Aqaba.
Along with the spatial and temporal variability in drought exposure, the variability in the degree to which the ground‑
water system is affected by climate‑related variables com‑
plicates the vulnerability assessment. The groundwater sensitivity factors may include the decrease in freshwater availability as a function of basin lithology, groundwater flow direction, aquifer type, international water treaties, national allocation rules, water demand and use for all sec‑
tors, and water allocation for human consumption, in addi‑
tion to groundwater quality factors which are a function of various different anthropic uses (e.g. landfill, wastewa‑
ter treatments effluent quality) and land use. In this study, the use of simple indicators as in this case provided a real estimation based on actual characterization of the exist‑
ing groundwater basins including groundwater safe yield, abstraction, and depletion.
The generated drought vulnerability map indicates that the whole country is subject to drought events, with any‑
where between moderate to high vulnerability. Although the CDI values indicate that transitional zones with rainfall trend shifts are the most susceptible regions for high drought impacts, the high groundwater sensitivity and weak adap‑
tive capacities caused by weak water governance and limited management plans at both ministry and municipality level justify the extreme vulnerability at the Azraq and Dead Sea groundwater basins, based on the fact that these basins have very high abstraction with intensive depletion rates.
On the other hand, the Zarqa groundwater basin displays moderate vulnerability despite suffering from high abstrac‑
tion, reaching 165 mcm with a depletion rate of 77.5 mcm;
the basin vulnerability is moderated due to the presence of investments at district level associated with mega projects to generate alternative water sources and local plans to reduce water loss.
The vulnerability map also indicates that Disi and Yar‑
mouk groundwater basins are highly vulnerable to drought, which is attributable to political aspects, particularly weak enforcement of transboundary agreements. The groundwater basin thus is being either depleted heavily by neighbouring countries and/or close to feed ports for surface water used in building large water dams.
Based on the generated vulnerability map, the individual groundwater basin adaptive capacity should be strengthened to cope with the drought consequences. This includes not only political agreements, but rather improving the exist‑
ing institutional arrangement of the monitoring and regula‑
tory systems towards water governance and proper planning
at municipality level. Searching and managing alternative resources might reduce the drought impacts but this requires high investment capacity at both district and governorate levels.
Although none of the government ministries holds the specific remit for drought risk management units, several activities are involved with drought and its management in one way or another. Aspects related to data collection and analysis, monitoring and forecasting, and development of drought mitigation and action plans require such a unit to be established. Until that point, all of the following ministries must be considered:
• The Ministry of Water and Irrigation, through its respon‑
sibilities for hydrologic analysis and related modelling, as well as in its central and field offices in which it imple‑
ments methods to control water, use it efficiently, and protect its quantity and quality.
• The Ministry of Agriculture, through its efforts to combat desertification, conduct research, and provide extended services related to the water use and efficiency. There are two units concerned with parts of the drought manage‑
ment cycle: The Drought Management Unit (DMU) at the National Centre of Agricultural Research and Exten‑
sion (affiliated with MOA) and the Agricultural Risk Management Fund (ARMF).
• The Ministry of Higher Education, through its research dealing with water shortages and studies related to better use of water and protection of quality.
• The Ministry of Transport/Directorate of Meteorology, through its prediction modelling activities with regard to precipitation, temperature, moisture, wind, and related meteorological data.
• The Ministry of Environment through a number of pro‑
grams focused on desertification and climate change, as well as its involvement in the protection and monitoring of water quality.
• The Ministry of Planning through the Department of Statistics, which issues periodical reports and statisti‑
cally indicative data related to drought and agricultural production.
Current drought management in Jordan is challenged by a weak link between information, available climate tools and decision‑making for searching and adopting the best drought management plan at all levels. Neither there is a special legislation dealing with drought, nor preparedness is available in a manner commensurate. The Government of Jordan should develop and implement national drought man‑
agement plans based on proactive risk management rather than crisis management to address various types of drought in coordination with the public and private sectors. The Gov‑
ernment of Jordan should develop, coordinate and evaluate