Assessment of the interaction between surface- and groundwater after the diversion of the inner delta of the River Danube (Hungary) using multivariate statistics B. Trásya, J. Kovácsa, I.G. Hatvanib,*, Timea Havrila, T. Némethb,c, P. Scharekd, Cs. Szabóe,
aDepartment of Physical and Applied Geology, Eötvös Loránd University Budapest, Hungary}
bInstitute for Geological and Geochemical Research, MTA Research Centre for Astronomy and Earth Sciences, Budapest, Hungary}
cDepartment of Mineralogy, Eötvös Loránd University, Budapest, Hungary}
dGeological and Geophysical Institute of Hungary, Budapest, Hungary}
eLithosphere Fluid Research Lab, Department of Petrology and Geochemistry, Eötvös Loránd University, Budapest, Hungary}
*Corresponding author. Address: Institute for Geological and Geochemical Research, Research Center for Astronomy and Earth Sciences, Hungarian Academy of Sciences, H-1112 Budapest, Budaörsi út 45
Tel.: +36 70317 97 58; fax: +36 1 31 91738. E-mail: hatvaniig@gmail.com
Abstract
Anthropogenic activity such as damming or diversion of rivers cause extensive disturbance to ecosystems, as well as the interaction between surface water and groundwater.
Following the diversion in 1992 of the River Danube (NW Hungary) and the construction of a water barrage system, the level of shallow groundwater dropped and altered the connection between surface water and groundwater. This paper outlines the changes in the interaction of surface water and shallow groundwater and other related environmental consequences caused by an 80% decrease in runoff resulting from this intervention. The time series (1996-2004) of 27 water quality variables measured from three surface and three subsurface sampling sites
were analyzed using periodicity, hierarchical cluster- and principal component analyses. It was found that: (i) the degree of riverbed clogging increased due to diminished runoff; this clogging blocked interaction between surface water and groundwater at certain sampling sites; (ii) extreme floods were capable of resetting this situation and changing the flow currents to differing degrees in the surface/sub-surface waters. These findings enabled a better understanding of the changes in water quality primarily attributable to the diversion of the river (the change in water level, riverbed clogging etc.). The changed hydrological setting of the subject area became very similar to that which might be expected to evolve due to climate change around the world. Thus, the study not only serves as an example for the processes evolving (e.g. riverbed clogging) in similarly modified river sections, but to those as well, which are expected to suffer from aridification.
Keywords: riverbed clogging, Gabčíkovo–Nagymaros water barrage system, river diversion, groundwater surface water interaction, cluster analysis, principal component analysis
1 Introduction
The assessment of water quality monitoring data is crucial to any undertaking aiming to sustain the natural characteristics of the environment as much as possible (Xu et al. 2009). This question is even more important when it comes to understanding the changes caused by river diversion and/or the installation of water barrage systems. In every case, such artifacts cannot but cause great disturbances in the ecosystem, not only on local but regional scales. The natural flow regime, i.e. the spatiotemporal variation of the magnitude and regularity of a certain flow, significantly decreases (Bednarek 2001), as does the regularity of floods replenishing the riparian ecosystem (Whitney et al. 2015). The decreased release of water from the river into the groundwater flow regime thus affects water table dynamics (Fan et al. 2015, Vörösmarty et al.
2003).
Due to the isolated state of the dammed river section: (i) the connectivity between the two banks of the river is inhibited, resulting in the isolation of populations and habitats, and therefore a decrease in genetic variability, and (ii) without fish ladders, the migratory routes of fish are blocked, leading to the disappearance of certain species (Baxter 1977, Park et al. 2003,
conditions, and with an increase in local nutrient content due to higher sediment deposition, biota will shift from lotic to lentic, increasing the risk of eutrophication (Vörösmarty et al.
2010).
In certain special cases, the damming of a river can ameliorate water quality (e.g. resulting in a decrease in heavy metals) in the mainstream river due to sediment deposition in the dam reservoir (Chapman et al. 2016, Fan et al. 2015). However, as previously mentioned, the disruption occasioned to the natural biogeochemical cycles of nutrients, carbon and metals (Friedl and Wüest 2002), may be added to the list of the complex and cumulative negative impacts of damming on water quality (Dams 2000, EC 2000),. As a consequence, along with the changes in the original ecological conditions (e.g. sediment-poor water arriving downstream of the dam (Bednarek 2001, Bilotta and Brazier 2008), other sections of the river are affected, and changes in the dynamic connectivity between the channel and floodplain water bodies are to be anticipated (Ward and Stanford 1995).
1.1 Possible changes in surface water and shallow groundwater interaction caused by damming
The natural circumstances of the interaction between surface water (SW) and groundwater (GW) is well documented, especially in the case of rivers. One general type of such interaction is where SW recharges GW, while in arid periods when the SW level drops below the GW table, this dynamic is reversed (Hayashi and Rosenberry 2002, Sophocleous 2002, Winter 1999). It is evident that anthropogenic activity, such as damming, in its character of a “by-product” of the construction of water barrage systems, may dramatically change the natural sedimentological and geomorphological conditions of the river (Assani and Petit 2004, Fan et al. 2015, Habersack et al. 2016, Ibisate et al. 2013, Li et al. 2013, Sear 1995). This takes place when increasing sediment deposition upstream of hydropower plants causes river bed clogging and alters the physical conditions in the sediment, thereby affecting the recharge of GW (Estrany et al. 2009, Ibisate et al. 2013) and the physicochemical conditions of the SW (Woessner 2000). The disruption of the connectivity between SW and GW may also have adverse environmental consequences such as causing a drop in GW levels where it is mainly recharged by surface water, leading to the creation of unfavorable conditions for agriculture, as are likely to occur in relation to the forecast climate change (Hua et al. 2015, Hughes et al.
2011, Kløve et al. 2014).
The interaction between SW and GW, taken as one single resource (Winter 1998), takes place via the medium of the alluvium forming the river bed and clearly determines the functioning of riparian ecosystems (Kalbus et al. 2006), the quality of the GW, its nutrient content and the level of the shallow GW. As far as the question of a safe and continuous water supply goes, the state of the river bed plays a crucial role because the first centimeters of the alluvium are the main location of filtration by the biofilm (Hubbs 2007, Ray et al. 2003). Since waters taken for agriculture (Zeng and Cai 2014), the urban environment (Whitney et al. 2015), and the drinking water supply system (Jaramillo 2012) are taken and filtered through the riverbank, any degradation of the biofilm will affect the whole quality of life in the region (Winter 1998).
Numerous processes take place in the transition zones between SW and GW, e.g. the transport, degradation, transformation, precipitation or sorption of substances (Bourg and Bertin 1993, Ray et al. 2003). Many methodological approaches exist to assist the exploration of these processes (Kalbus et al. 2006), such as direct measurements e.g. bag-type seepage meters (Lee 1977), further developed in the last couple of years, and heat tracer methods, or methods based on Darcy’s Law (Darcy 1856), plus mass balance approaches.
The central notion informing the study of SW and GW interactions using mass balance approaches is that any gain or loss of SW or any changes in the properties of the SW may be related to the water source, and therefore, the GW component can be identified and quantified (Kalbus et al. 2006). Environmental tracer methods (e.g. stable isotopes (Stute et al. 1997)) are frequently applied to the exploration of these issues. The main drawbacks of tracer-based hydrograph separation are that the waters before and after an “event” are often too similar in their isotope composition, and that the composition is in many cases not constant over space nor time (Genereux and Hooper 1998). Geochemical tracers have been applied with a degree of international success to the study of the connections between different water bodies, e.g. SW and GW (Cook and Herczeg 2000, Ladouche et al. 2001, Yang et al. 2012). Methods to determine contaminant concentrations (e.g. monitoring wells) are also used in the research of SW and GW (Kalbus et al. 2006).
1.2 Adverse effects of anthropogenic activity: interaction between surface- and groundwater in the inner delta of the River Danube
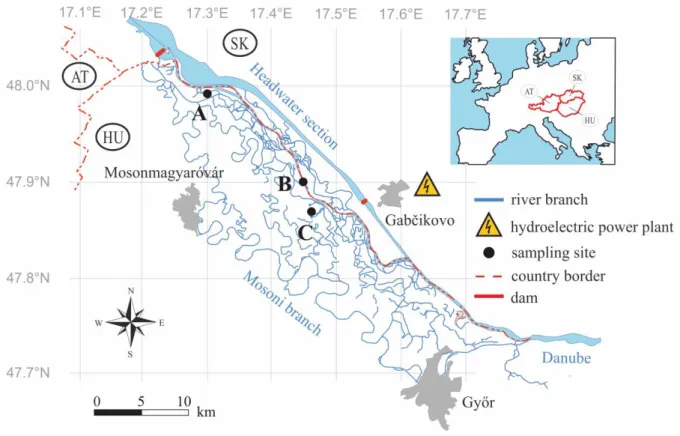
An ideal area to study the various aspects of the phenomena discussed above is to be found in Hungary, at the Szigetköz Island (375 km2), located between the dam of the Gabčíkovo power plant’s headwater (power) channel and the Mosoni branch of the River Danube, which split the Szigetköz into small islands (Fig. 1). After entering Hungary and the Little Hungarian Plain, the energy of the Danube decreases and its sediment settles and thickens, forming the foundation of the Szigetköz. This is not a “classical” island; it is intersected by numerous side- arms of the Danube with various bed profiles characterized by different runoffs and flow velocities.
The study area displays all the characteristics of those anthropogenic problems mentioned in Section 1. In October 1992, a section of the Danube 58 km in length was diverted in the area of the Szigetköz into a 27 km long cement power canal (Smith et al. 2000) at river kilometer (rkm) 1851.75 in connection with the construction of the Gabčíkovo power plant (Bős) (Jansky et al. 2004, Kovács et al. 2015). The diversion was undertaken by Slovakia, as in 1989 Hungary decided not to participate further in the originally bilateral hydropower plant construction project. Thus, Slovakia finished a version of the project in 1996 which circumvented Hungary, making cooperation between the two countries unnecessary (Smith et al. 2000).
Previous to the diversion, the Danube had been a source of recharge to the shallow GW, whereas after the diversion the abandoned main riverbed taps the shallow GW (Hankó et al.
1998). Originally, the level of the shallow GW in the hydrogeologically homogeneous aquifer of several hundreds of meters’ thickness had been uniform, and had been driven mainly by the natural water level fluctuation of the Danube. After the diversion, the majority of the Danube’s flow was redirected to an insulated power plant canal that rejoins the original riverbed only at Palkovičovo, at rkm 1811. Due to the diversion the runoff in the old Danube decreased by ~80%
(Jansky et al. 2004, Smith et al. 2000), thus radically changing the previously obtaining hydrological conditions. Consequently, water level in the riverbeds dropped several meters, and by 1993, some branches of the Danube had dried up (Trásy 2012, Trásy et al. 2018). As the subsurface aquifer of the area is in close connection with the SW network, the level of shallow GW dropped significantly as well (Bárdossy and Molnár 2004). To minimize the negative effects of the damming, in 1995 a water supply system was set into operation in the Szigetköz region consisting of a bottom dam on the Old Danube, with weirs, sluices and channels (Smith
et al. 2000). These events further modified not only the flow conditions of the Danube, but also those of the GW, along with the connection between the two (SW & GW), determining the environmental conditions of both banks of the Danube (Scharek et al. 2000). After the diversion, the conditions in the original “old” river stabilized around a state similar to that of the arid years before the diversion (with a streamflow of approximately 250 m3 s-1; Smith et al.
2000). This new, stabilized situation was disrupted by heavy floods with runoffs of approximately 1000 m3 s-1 in 1997 and 2002 (ÉDUKÖVIZIG 2014). Climatic characteristics are important in alluvial floodplain aquifers, where floods play a vital role in recharging the GW (Kidmose et al. 2013, Morin et al. 2009, Scibek et al. 2007, Whitehead et al. 2009). For example, hydrological transitions induced by climate change can influence the amount and behavior of carried sediment, in turn affecting the riverbed directly, and, consequently, SW- GW interaction (Brunke 1999, Hoehn and Cirpka 2006, Kløve et al. 2014, Schindler Wildhaber et al. 2012). It is therefore important to assess the effects of droughts on SW-GW interaction (Kløve et al. 2014).
1.3 Mimicking the possible effect of climate change on surface and groundwater systems in the region
The hydrological setting of the study area is very similar to that which may be expected to evolve due to climate change as predicted in the scenarios of the Intergovernmental Panel on Climate Change (IPCC 2014) for the region. This is largely because the 80 % decrease in runoff is the main driving phenomenon of the current situation, and this simulates a serious drought in the area, although other factors (e.g. evaporation, precipitation, infiltration etc.) also play a part.
Since the impact of climate change on GW dependent systems has received insufficient attention (Taylor et al. 2013) it is crucial to give greater consideration to the phenomenon (Garamhegyi et al. 2017, Havril et al. 2017). With regard to the magnitude and frequency of recharge the number of extreme events is expected to increase (Field 2012). The number of extremely wet days in most of the Northern Hemisphere has significantly (5%) increased in the past cca. 100 yrs (Alexander et al. 2006)and the predictions – for 2071-2100 - suggest that there will be a significant increase (>25%) in winter-, and decrease (<-10%) in summer mean precipitation in the Carpathian Basin, along with a simmer increase in maximum dry spell length (reference period: 1961-1990 (Gao et al. 2006)). These changes are likely to cause short, highly arid periods and more frequent floods (Bartholy et al. 2013, Dankers and Hiederer 2008),
thus posing a potential threat to surface waters (Döll and Zhang 2010, Steele-Dunne et al. 2008, Whitehead et al. 2009).
The area has turned into an example of a continuously arid region, modeling the hydrological and geochemical processes occurring in the SW and GW of such locations.
1.4 Aims
The main aims of the study were to assess the changes occurring in the SW and GW interaction of the River Danube in the Szigetköz area after the damming. The question of whether the regulation of the river and/or the damming caused changes in the communication between the SW and the GW was raised, as was the question of whether these could be followed in the time series of the physicochemical characteristics of the SW and GW. Moreover, the question was raised of how these presumed changes manifest in the stochastic relationships of the water quality parameters characterizing the recharge to GW from the SW, and vice-versa.
2 Materials and methods
2.1 Sampling strategy and data
2.1.1 Archived datasets
The hydrological and hydrogeological effects of the diversion of the Danube (i.e. the change in flow directions from the river towards the GW after 1992) were monitored continuously over the period 1996-2004 by the Hungarian Geological Institute. To follow the state of the SW and GW interaction in the river section most affected by the diversion, quarterly water quality measurements were conducted up to 2004 at fourteen sampling sites (Scharek et al., 2004). After necessary data preprocessing, 9 sites were omitted due to missing data, and of the remaining 5, only three sites had comparable datasets, i.e. measurements at the same time (±3 days) using the same set of water quality variables. Therefore, these three sites were selected, and may be taken as representing the following regimes: a GW recharge zone (i.e. the SW recharges the GW) (site A); a GW discharge zone (i.e. the SW taps the GW) (site B); and an area affected by riverbed clogging (site C) (Fig. 1). At the decisions concerning this were made in the course of the on-site surveys (Neppel et al. 1999, Scharek et al. 2000, VITUKI 2004), assessing the river bed condition (e.g. grain size, macrophyte/algae coverage), water
organoleptic characteristics, and the hydraulic condition of the environment (e.g. stagnant water). Moreover, temporal changes in the river section were also recorded (Scharek et al. 2000, VITUKI 2004), e.g. at site C, the stone and pebble shingle surface began to suffer from clogging, coupled with an increased presence of algae. This was further confirmed with oxygen stable isotope analyses at site A, which showed that the river water is tapped by the shallow GW (Deak et al. 1996).
The dataset used in the study was obtained from samples taken from both the SW of the river and the GW of the riverbanks, in the latter case by tapping the GW with a probe. For the multivariate analysis, 27 water quality parameters provided by the Environmental Protection and Water Management Research Institute (VITUKI) were analyzed. In the course of the sampling, in every case the relative water levels between GW and SW were measured within 1 m of each other, providing the opportunity to make inferences concerning the water flow direction between the water bodies (Darcy 1856) (Fig. 3).
Fig. 1. Study area, the Szigetköz itself and its monitoring sites, along with the branches of the Danube and the “new” canal with the hydroelectric power plant at Gabčikovo.
HU: Hungary, SK: Slovakia, AT: Austria.
2.2 Applied methodology
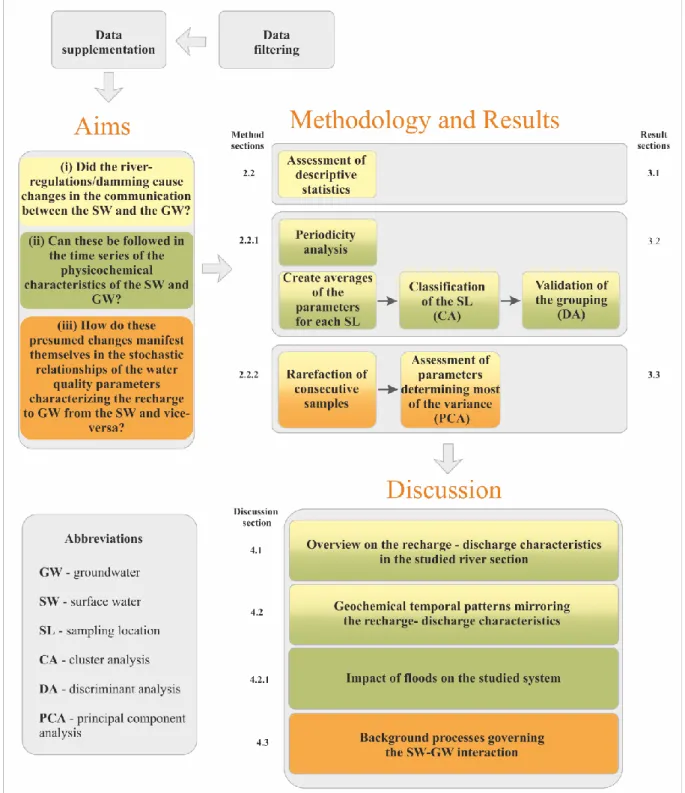
The aims were to explore the behavior of the three assessed sampling sites over time and to be able to (i) describe their baseline conditions after the regulation of the river section in 1992, (ii) describe the stochastic relationships and/or time series of the physicochemical characteristics of the SW and GW and (iii) find the natural background processes related to them. In pursuit of these aims, the following steps were taken. Following an overview of the descriptive statistics (Section 3.1) and temporal trends/changes of the data (Section 3.2), periodicity analysis was carried out on the water quality parameters of both SW and GW (Section 3.2). Consequently, the time points were grouped based on their similarity using cluster analysis (Cloutier et al. 2008, Wang et al. 2007, Ward Jr 1963). As a last step, principal component analysis (Bro and Smilde 2014, Helena et al. 2000, Magyar et al. 2013a, Wold et al.
1987) was used to determine the driving background processes (Section 3.3). The steps described above were conducted along the lines of the methodological framework found in Hatvani et al. (2014b), Kovács et al. (2012), in which the best practice for the statistical assessment of water framework related data is discussed (Fig. 10).
2.2.1 Periodicity and cluster analyses
To determine the spatial and temporal effect of the floods in the area periodicity and cluster analyses were carried out, respectively. It was presumed that the large floods (>1000 m3 min-1) in the Szigetköz area would simulate the conditions before the diversion (avg. discharge 2000 m3 min-1).
In the moderate climate zone, where the study area is located, it is an a priori assumption that the time series of water quality parameters will show annual periodicity based on the results of different periodicity analyses (e.g. wavelet spectrum analyses) of water quality parameters of similar study sites (Brunet and Astin 1999, Hatvani et al. 2017, Hatvani et al. 2014a, Labat et al. 2005, Magyar et al. 2013b). If this period is in any degree missing, it is considered to be a periodicity anomaly (PA), which may indicate a drastic change in the environment, one which is likely to have been induced by anthropogenic activity.
There are numerous methods discussed in the literature which may be used when there is a need to determine the periodicity of physicochemical parameters (Brockwell and Davis 2013, Percival and Walden 2006, Strang and Fix 2011). According to Shannon’s theory (Shannon 1949), a quarterly sampling frequency would theoretically be sufficient for commencing modern periodicity analysis on the data, e.g. Fast Fourier Transformation (Cooley and Tukey 1965), Wavelet (Li and Guo 2000) or spectrum analysis (Kovács et al. 2010), etc.. In reality, however, the actual sampling frequency only partially meets the data input requirements of these methods. Therefore, another approach was used.
To assess the annual periodicity line diagrams were prepared for each variable, (measured values vs. time), along with a theoretical function derived by the authors representing the annual period. This theoretical function attributes a theoretical value to each measurement point in time (Eq. 1):
P = A ∗ sin(2𝜋
𝑇 + 𝑥 + 𝑦) + 𝑧 (1)
where P stands for the period, A for the amplitude, T the period, x the measurement point in time, y the shift of the theoretical curve in days along the abscissa, and z the parameter’s average for the whole time period investigated.
If the amplitude of the assessed parameters is within ±25 % of its average theoretical period regarding the whole time investigated (Eq. 1), it is accepted that the parameter in question indicates annual periodicity. If the values of the parameter fall outside this interval, a period anomaly (PA) is presumed. For a detailed example, see Fig. 7. With cluster analysis, not only similar sampling sites (Hatvani et al. 2011), but time segments of similarly behaving time points can be formed (Tanos et al. 2015). It may be supposed that the years with average flow will group into similar time segments, interrupted by the large floods. To find similarity, a metric is attributed to the data. If the distance determined by this metric is small, the measurements will fall into the same group. In the present paper Ward’s method and squared Euclidian distance were used (Güler et al. 2002, Monjerezi et al. 2011, Tanos et al. 2011).
2.2.2 Principal component analysis
According to general practice in hydrogeology, using Principal Component Analysis (PCA) the water quality variables most responsible for the variance of the total dataset may be sought (Hotelling 1933, Wold et al. 1987). In the course of the analysis, the number of
physicochemical water quality variables is reduced by compressing the information into principal components (PCs). These are linear combinations of the original variables, uncorrelated, explaining the variance in a monotonically decreasing way, starting with the first PC. These PCs can be attributed to known phenomena occurring in the SW and/or GW of the Szigetköz area. Therefore, the differences in the composition of the PCs in either the SW or GW can provide valuable information, assisting researchers in gaining a better understanding of local phenomena (e.g. riverbed clogging).
In the course of the present research, it was the principal component loadings which provided the most useful information concerning the behavior of the observed phenomena.
Only PC loadings falling outside the ±0.7 interval were considered as influential (Cloutier et al.
2008). Since the loadings depend on sampling, these are considered the statistics of random variables. Therefore, a ±0.03 (5%) error is accepted in relation to the interval of influence (Hatvani et al. 2015). Turning to the principal components, influence was accepted at a level of over 30 % explanatory power in the case of the first, and over 10 % in the case of the second component.
3 Results
3.1 General overview
3.1.1 Basic statistics and general picture of the dataset
To provide an overall picture of the general behavior of parameters, their descriptive statistics were calculated (see details in the Supplementary online material, SOM). It is obvious that values of T, OS (oxygen saturation), DO (dissolved oxygen), pH and concentrations of NO3- were higher in the SW than in the GW (SOM Fig. S1) with the exception of temperature at site B. The longer the flow path and higher the penetration depth of GW, the flow produces a higher temperature in the GW due to the increasing subsurface temperature gradient. Thus, the higher temperatures in the GW than the SW at site B reflect GW discharge of a higher order of flow (intermediate or regional). The temperature fluctuation of SW is lowest at site B, where the SW taps the GW. This can be attributed to the buffering effect of GW, since its temperature is generally more stable than the SW temperature (see temperature ranges in Tables S1 and S3).
The concentration of the major elements, however, only slightly differs between the SW and GW.
In general, the patterns of the measured parameters in the SW of the three monitoring sites (Fig. 1) are aligned to each other more closely than in the GW. For example, in the GW the medians of EC, Ca2+, HCO3-, H2SiO3, and SO42- are in most cases higher at site B than those at sites A or C. On the contrary, Na+, Mg2+ and Cl- averages are the lowest at site B (SOM Table S1, S3). The hydrochemical variability of GW could indicate the chemical evolution of the groundwater along its flowpath, with concentrations increasing from recharge areas to discharge areas as in the Chebotarev sequence (Chebotarev 1955). Cl- may be expected to increase from recharge zones towards discharge zones in a groundwater flow system, while the HCO3- concentration is expected to decrease along flowpaths. These hydrochemical differences in GW could also reflect different orders of GW flow with different chemical types (i.e. major ion content), since the Chebotarev sequence is also valid from the local flow systems to higher orders of flow.
In most cases the standard deviation of the parameters measured at site A is higher than that at the two other sites in the GW. The measured values of temperature were lowest at site A (12 °C), followed by sites C (13 °C) and B (13.3 °C). The median of DO in the SW varies between 10.06 and 11.9 mg l-1, unlike in the GW, where its values were much lower. At site B, OS is almost zero (Fig. 5B). The averages of the parameters are in all cases lower in the SW than in the GW.
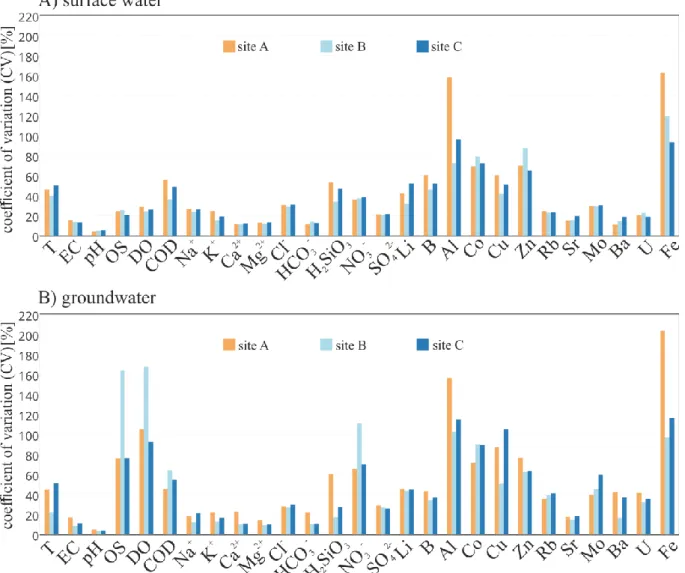
As far as their coefficient of variance (CV) is concerned, the variability of the major elements was much smaller than that of the trace elements (Fig. 2), especially in the GW (Fig.
2B). The highest CVs were observed for Fe, Al, Zn, and Co (163; 158; 88 & 69 % in SW and 204; 156; 77 & 90 % in GW, respectively). In fact, these were the parameters the CVs of which differed to the greatest extent between the SW and the GW. Since CV is the ratio of the standard deviation to the mean, it indicates the variability of different parameters (even those measured on different scales) in a comparable (“standardized”) way. It was also observed that in the GW the variability of the parameters related to organic matter (OS, DO, COD, NO3-) increased especially at site B, compared to those in the SW (Fig. 2). In the case of DO, for example, this increase was from ~ 30 % in the SW to ~170 % in the GW at site B, whereas in the case of the other two sites this was from ~30 to 80 %.
Fig. 2. Coefficient of variation (CV) (%) of all measured parameters A) in surface water (SW) and B) in groundwater (GW) at the three sampling locations (1995-2004).
The characteristic differences between the three sites can be described by their most determining phenomena: GW recharge at site A, GW discharge at site B and river bed clogging in the vicinity of site C (Fig. 1).
3.1.2 Differences between the sampling sites
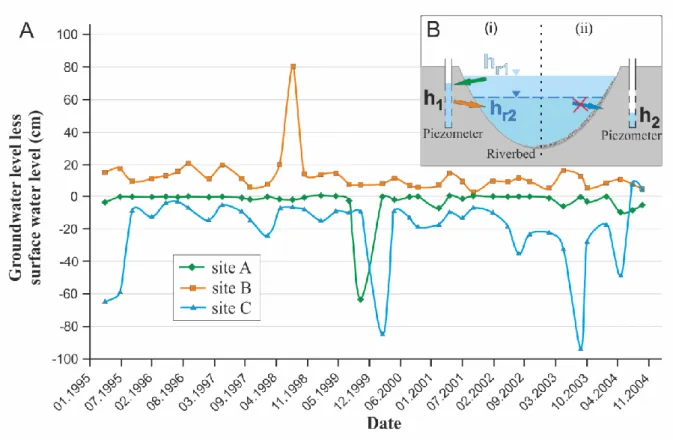
At each sampling site, the absolute water level (m asl) of the shallow GW level and of the River Danube were measured and compared (Fig. 3). Based on the differences in relative water level (which is proportional to the hydraulic gradient), flow direction between GW and SW can be determined.
At site B, the GW level was always higher (minimum difference 10-20 cm) than the SW level over the measured period, which, bearing in mind the general hydraulic law (Darcy 1856) indicates GW discharge (i.e. the GW recharges the SW) (Fig. 3B, orange arrow).
In the case of sites A and C the opposite was true, i.e. the level of the SW was always higher than the GW level, suggesting GW recharge. However, at site A, water level differences between GW and SW (<5 cm) were significantly less than these differences at site C. The dynamic factor loading map of the Danube – based on the Dynamic Factor Analysis (DFA) results of Kovács et al. (2015) – indicates that the river has a larger influence on the GW levels at site A than at site C (SOM Fig. S2). This again is in accordance with the phenomenon of developed river bed clogging (Scharek et al. 2000, VITUKI 2004); this, in turn, restricts the interaction between SW and GW at site C (Fig.3B, crossed blue arrow) and indicates GW recharge at site A (Fig.3B, green arrow);
Fig. 3. A) Water level differences between the shallow groundwater and the River Danube during the period 1995-2004 at the three sampling sites. Positive values indicate
a higher shallow groundwater level compared to the surface water level of the River Danube, and therefore represent groundwater discharge (as in the case of site B).
B) A theoretical cross section representing conditions in the case of (i) the water level difference between groundwater and surface water generating water exchange between them; and in case of (ii) the interaction between groundwater and surface water restricted by riverbed clogging. If the surface water level is higher than the groundwater level (hr1
> h1), groundwater recharge occurs, indicated by a green arrow. Where the surface water taps the groundwater (hr2 < h1), this is indicated by orange arrow. The crossed out blue arrow represents restricted communication between surface water and groundwater.
3.2 Assessment of temporal changes
In the case of surface measurements, similar patterns were observed for the parameters characterizing hydrogeochemical facies (Zhang et al. 2012) (Na+, K+, Ca2+, Mg2+, Cl-, HCO3-, SO42-) at all three sampling sites (Fig. 1). Beginning in 1997, a decrease can be observed in the SW (Fig. 4A), lasting until 2002, with an increase in 2003 followed by a decrease as indicated in numerous samples afterwards. This pattern, however, is not explicit in the GW samples (Fig.
4B). Here, the parameters displayed much more individual patterns. At site B (Fig. 1), an increase was observed in the concentrations from 1999.
Fig. 4. TDS annual averages for 1996-2004, representing: Na+, K+, Ca2+, Mg2+, Cl-, HCO3-, and SO42- A) in the surface water, and B) in the groundwater. A decreasing trend can be observed up to 2002 at sampling locations A and C. Following this, the
outlying values reached the levels of 1996/97. In the case of groundwater, the concentration values are higher and the differences between the years are greater than
in the surface water.
The parameters related to oxygen clearly differ between the SW (Fig. 5A) and the GW (Fig.
5B). In the former, oxygen saturation is between 75-130 %, whereas in the latter this is 30 %.
Moreover, at site B it almost reaches 0 % (Fig. 5B). The oxygen saturation of the SWis higher than that of the GW and displays outlying values. In the GW, the three sampling locations show very different patterns to those of the SW, at site B increasing to approximately 10 % only in few times.
Fig. 5. Oxygen saturation time series A) in the surface water, and B) in the groundwater (1996-2004) at the three sampling sites, indicated by different colors. Note the different
concentration intervals of the vertical axis.
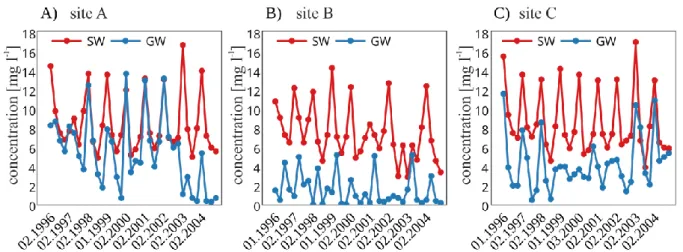
At all three sites the nitrate values in the GW differed to a great extent, whereas in the SW, no such difference was observed, with values varying between 8-12 mg l-1 (Fig. 6). At sampling site A, the nitrate time series of the SW and the GW showed similar values, whereas at site B the GW nitrate values (median: 0,9 mg l-1) were almost 10 times lowerthan the SW (median 7,05 mg l-1). Site C can be considered as a composite of A & B: whereas between 1992 and 2002, the concentrations differed in the SW and the GW, in 2003-2004 they yielded quite similar values (Fig. 6C).
Fig. 6. Nitrate time series of sampling sites A, B & C in the surface water and groundwater for 1996-2004. The difference in the magnitude of the concentration values
between the surface water and the groundwater changes from site to site.
From the exploration of the periodic behavior of the analyzed parameters, direct hydrogeological and geochemical interpretations may be made. As seen in the results presented above, obvious differences arise between the SW and the GW. In the SW, temperature, Na+, K+, Ca2+, Mg2+, Cl-, HCO3-, and H2SiO3 indicate annual periodicity, whereas in the GW mature periodic behavior for these variables was not observed. Only T indicates a clearly periodic behavior at all the sites in relation to GW. However, Na+, and Cl- displayed periodic behavior at sites A & C (Figs. 7A & B), and nitrate (1998-2001) at site A (Fig. 6A).
In the SW, K+, Mg2+, and HCO3-, period anomalies occurred in 1997 and 2002, while these are less pronounced in the cases of Na+ and Cl-. Here, the most explicit period anomalies are seen in 2003 and 2004, combined with the decrease in amplitude (Fig. 7). As for HCO3- and Mg2+, besides 1997 and 2002, additional period anomalies are observed in 2003-2004. At site B, in the case of Na+ and Cl- measured in the GW, a distorted period can be seen with a reduced amplitude, clearly separating it from the other two sites. In the case of Cl-, this was in fact true for the whole assessed time period (Fig. 7B). On the basis of these facts, it can be stated that three distinct time periods may be delimited in which the annual period was missing from parameters: 1997, 2002, and 2003-2004.
Fig. 7. Periodic behavior of Na+and Cl- [mg l-1] and period anomalies in the surface water A), and the groundwater B) (1996-2004). Period anomalies occur when the parameter values fall beyond the 25 % envelope curves indicated in grey. For specifics
of the period anomalies, see Section 2.2.1
To see whether hydrological changes affecting the whole set of water quality parameters together can be observed, the annual averages of the measured parameters were clustered using 60% of the maximum linkage distance as the threshold of separation, in accordance with general practice (Pucci 1998). In the case of the SW, two groups, and in the case of the GW, three groups could be distinguished (Fig. 8) (all dendrograms may be found in the SOM, Fig. S3).
Subjected to discriminant analysis, these three groups proved to be valid.
Fig. 8. Temporal grouping of years based on clustering using hierarchical cluster analysis (HCA). Years marked with similar colors belong to the same temporal cluster groups. In the case of surface waters two groups, while in the case of groundwater three
groups were identifiable. The dendrograms can be found in Fig. S3.
3.3 Assessment of background factors driving local processes
The number of assessed water quality parameters was compressed into principal components. Based on the scree plots (Fig. S4), only the first two PCs were evaluated in detail (Fig. 9). This way, the water quality variables characterizing the background factors in the case of both the surface- and groundwater were separable.
As for the results of the principal component analysis (PCA), it was found that EC, Na+, Ca2+ and Mg2+ always act as influential parameters regardless of whether measured in the SW
or the GW. Meanwhile, the role of T may be considered as determining in the 1st PC of the SW at all the sampling sites, whereas in the GW its importance decreases (Fig. 9. And Table S6).
From the perspective of the sampling locations, however, at site A, the first PC of the SW resembled that of the GW with regard to HCO3-, Zn, with Ba being influential in both B, Sr and NO3-, however, only played a determining role in the SW (Fig. 9.).
Since the major elements display similar behavior in the SW and GW at all the sites, the focus will now shift to the most explicit differences, which are mostly to be found in the trace elements. In the first PC at site B the main difference between the SW and GW is that in the SW, among others, Sr, Ba, and U play an influential role, in contrast to in the GW (Fig. 9.). In the second PC of the GW, B, Al, Co, Cu were shown to be influential, along with Mo, Fe and to a certain extent Rb, which fell slightly outside the chosen interval of influence.
At site C the set of influential parameters in the PCs of the SW and GW differed to a higher degree to that at the other two sites. In the SW at site C the PCs pattern resembles that found at site A, particularly in the pronounced role of the major elements in the 1st PC, along with a couple of the trace elements (Fig. 9.). By way of contrast, in the GW the pattern of the PCs is quite different to those from the other two sampling sites. Specifically, in the 1st PC of the GW the influential role of temperature, K+, Cl-, HCO3-, NO3-, B, Sr, and U decreased in part or fully as compared to the SW, whereas the importance of O2, EC, and SO42- increased. Similar differences were observed in the case of the 2nd PC (Fig. 9.).
Fig. 9. Principal component loadings of the first and second principal components (PC1, PC2) at the three sampling sites in the surface- and the groundwater. The colored vectors (red correspond to PC1 and blue to PC2) represent the values falling outside
±0.7. The exact values are presented in Table S2.
4 Discussion
In this section, the results are compiled and compared to related studies along the lines shown in Fig. 10. For an overview of the development of the developed methodology driven by the aims (Section 1.4) and the related findings, the reader is referred to Fig. 10.
Fig 10. Flowchart showing the logical thread of the study. The various background colours indicate connected logical threads.
4.1 Overview of recharge and discharge characteristics in the river section studied
In the statistics of the hydrochemical parameters two important points stand out: (i) the contrast between the relative water level differences (Fig. 3), and (ii) the observations gathered using dynamic factor analysis showing that the river water is the most important driving fact in
the vicinity of site A (Kovács et al., 2015; SOM Fig. S2). Using a Kruskal-Wallis test (SOM Table S5) (Kruskal and Wallis 1952), it can be demonstrated that the SW of the sites does not differ significantly since the runoff of the river is orders of magnitude higher than the discharge rate of groundwater into the river. In the case of GW, whereas site B noticeably diverges from sites A and C in the case of numerous parameters this difference is only true to a smaller degree (3 parameters see in SOM Table S5) when one considers sites A and C. Interaction between GW and SW can happen in one of two ways: SW taps the GW as the latter flows through the riverbed into the river, or river water infiltrates through the sediments into the GW, recharging it (Kalbus et al. 2006, Winter 1998). At site B the average GW temperature (15.3 °C) is higher, and the maximum temperature (20.6 °C) lower than sites A and C, and the OS values are also low (mean: 2 %) (SOM: Table S3), indicating a depletion of oxygen along the flow path of the sampled GW due to long residence time in agreement with the Chebotarev sequence (Chebotarev 1955). This supports the finding that over the assessed time-period the Danube tapped the GW, which therefore flowed from the aquifer to the river (Fig. 3).
At site A, the low (compared to site B) average temperature (12.1 °C) (SOM Fig. S1 and SOM Table S3) and high standard deviation of the measured water quality parameters (Fig. 2) indicate the more determining role of river water in the chemistry of the GW measured in the probe. River water has the highest effect on the GW at site A since there is no riverbed clogging there. Moreover, the water level difference between SW and GW points to the same result (hr1
> h1 in Fig. 3). The mixing of the river water and the GW is presumably behind the higher deviations at site A, since at site B, where the SW has just a small effect, the standard deviation tends to be the smallest. Here, at site A, the infiltration of river water into the GW is the lowest, providing an opportunity for an equilibrium state to form.
Furthermore, the annual averages and pattern of TDS of the GW at site A resemble those of the SW at the same site (Fig. 4). This also indicates that the chemical characteristics of the GW could originate in the SW, due to the SW discharge into the aquifer. On the contrary, the water chemical characteristics of GW at site B are to a high degree independent of those for the SW (i.e. the Danube) as a result of the draining stream. In the case of site C, up to the year 2002, no similar pattern was observed between the SW and GW (Figs. 5 and 6), which may indicate a weak communication between the two.
The pattern of the time series sheds light on the fact that the trace elements behave differently (Gaillardet et al. 2003, Schmidt et al. 2003) in time and space because of their
remobilization, depending mainly on pH and redox conditions (Bourg et al. 1989, Chapelle 2005, Gaillardet et al. 2003). This variable behavior is pronounced in the CVs (Fig. 2). In the meanwhile, parameters related to the oxygen content of the water (Fig. 5), NO3- (Fig. 6) and most of the trace elements, were almost always higher in the GW (SOM: Table S2, Table S4).
4.2 Geochemical temporal patterns mirroring recharge/discharge characteristics
Periodicity analyses have shown (Fig. 7) that most of the major elements display annual periodicity, as suggested in the work of Gaillardet et al. (2003). In the GW, at sites A and C periodicity can indeed be found in most years (Section 3.2). At site B, however, in the case of the majority of the parameters, even if annual periodicity exists, it is undeveloped (amplitude
<25 %). Furthermore, at site A at all times and at site C after large floods (1997, 2002), the water flows from the Danube to the GW, recharging it, whereas at site B it flows the opposite direction, discharging it. Where the GW is recharged by SW (site A), the SW transfers its periodic behavior to the GW. In contrast, in the opposite case (site B), periodicity is undeveloped (e.g. in the case of Na+, and Cl-), indicating a flow direction towards the river (Fig.
7). The reason for the lack of periodicity is presumably the fact that the GW has a much less direct relationship with local meteorology (seasonality) and anthropogenic influence, and has a long residence time, thus dampening the periodic behavior of the system.
Of the many parameters assessed, nitrate was chosen to serve as an example to describe the communication between the SW and the GW because it is widely accepted that changes in nitrate concentrations are good indicators of bank filtration conditions of the river bed (Mitsch et al. 2005, Sprenger et al. 2011, Wett et al. 2002). Subsurface reductive conditions and denitrification taking place in anaerobic environment may both be indicated by a decrease in nitrate (Sprenger et al. 2011, Tufenkji et al. 2002). Where water has a longer residence time (Fig. 6), denitrifying bacteria reduce nitrate, and consequently nitrogen in the form of N2 gas will be released from the sediment (Reddy et al. 1989). The slower the seepage, the more time is left for the process of reduction. In settings where the time series of nitrate measured in the SW and GW water follow each other, seepage is faster and the connection between them is highly developed (Fig. 6) in similar hydrological situations. In the case of the River Leith (Scotland), for example, a similar situation may be observed, where a strong flow (flood) from
the GW towards the SW takes place (with loose streambed material, i.e. decreased riverbed clogging) and nitrate concentrations are elevated (Krause et al. 2009).
Where the SW and GW time series show differing patterns, communication between the SW and GW is weak, unless the runoff of surface water is orders of magnitude higher, than recharge from GW. In this case the effect of the GW is just marginal. At site A, the nitrate time series of the SW and GW move in parallel to each other, suggesting that the Danube waters seep through the riverbed quite quickly. At site C, from 1998 (Fig. 6), the nitrate time series of the GW became independent of the SW, and this remained so up to the fourth quarter of 2002.
At the same time, this cannot be said of sites A and B. To understand this phenomenon, the PA of the periodicity analysis needs to be assessed in detail (Section 4.2.1).
4.2.1 Impact of floods on the studied system
Altogether, the periodicity analysis pointed out three period anomalies in both the SW and the GW (Fig. 7) occurring in 1997, 2002 and 2003-2004. The years 2003-2004 were handled together because each parameter indicated a PA for both years. This confirms the idea that similar hydrological circumstances obtained in both years. In the summer of 1997 and in August 2002 extremely high floods struck this area, causing a vast increase in water volume and velocity in the Danube. These events were identified as the major reason for the PAs. The fast runoff loosened up the fine grained fraction of sediment from the bed, washed it out and settled it down in the lower sections of the Szigetköz (Búzás et al. 2009, VITUKI 2004). This hydrological situation simulated a setting similar to that prevailing prior to the diversion of the Danube (1992), restoring the communication between the SW and GW. Due to the flood, Danube water with elevated TDS concentration (Fig. 4) was capable of seeping through the river-bed, resulting in changes in chemical composition of the GW. Nevertheless, at site B, where the GW continuously flows towards the Danube (h1>hr2; Fig. 3), this phenomenon continued, though to only a decreased extent (e.g. in the case of Cl- in Fig. 7).
Because of the floods of 1997 and 2002, the water level in the river bed increased, thus the general flow paths changed, going now in the opposite direction to that prevailing since the diversion (GW to river). Thus, under the changed circumstances, the GW began to tap the water of the Danube, which started to function as the source of the GW (Fig. 3B). After the flood had receded and the water level in the river had fallen to its average value, the GW still maintained
its high level and started to feed the water into the river-bed until the respective water levels leveled out (h1≈hr2). This process contributed to the mobilization of the fine grain sized sediment (Winter 1998). Since after the flood of 2002 only one further sampling was carried out that year, the true medium-term effects of the flood can only seen in the water chemistry data for 2003. Thus, this particular flood may be considered as the cause of both the sudden elevated amount of the TDS at all three sampling areas and the more extensive communication between the SW and GW at site C (Fig. 4). A similar process to this has been observed and discussed using geostatistical methods (Trásy et al. 2018). There, it was pointed out that the floods in the Szigetköz (2006, 2009 and 2013) have changed the subsurface flow conditions by removing the clogged strata from the riverbed. This was found as one of the – although indirect – main explanations of the change in representativity of the subsurface water level monitoring system in the area (Trásy et al. 2018).
Assessing the organic micropollutants from SWs, Luo et al. (2014) came to the conclusion that in periods of low water level these pollutants cannot be detected in bank filtered water because in such circumstances they are hardly able to infiltrate. The same behavior is characteristic of viruses and bacteria, which were only able to reach the production wells during extreme floods. These observations reinforce the findings presented, namely, that large floods with enough energy (Schälchli 1992, Vericat et al. 2006) are capable of ameliorating the connection between SW and GW. Furthermore, it was proven with in situ experiments that even after clogged strata had been removed, the value of hydraulic conductivity did not return to its original level. At the same time, cases of external clogging have been recorded in which the original connection is not restored even after the removal of the upper clogged layers (Pholkern et al. 2015). It is worth comparing the situation under consideration with that in the River Enns.
Using MODFLOW model simulations and field experiments, the proportion of filtrated river water in a well near the river was found to decrease significantly immediately after flooding, despite the constant hydraulic conductivity of the riverbed (Wett et al. 2002). This was due to i) the increase in the level of the GW table occasioned by precipitation and by stream stage elevation during the flood, and ii) an increased GW head, which, together with decreased stream stage after flooding, resulted in a reduced hydraulic slope and seepage rate.
Besides its periodic behavior, the temporal continuity of the dataset could also be determined by temporarily clustering the changes in the Danube riverbed and the flood events (Fig. 8 & SOM Fig. S3). Of the two groups obtained for the SW, the year 2003 belonged to the
one containing the years of the 1990s, because, if only for a short time, the river behaved similarly to how it had before the diversion of the Danube. In the case of the GW, three groups could be separated (Fig. 8), probably due to the floods. It is well known that floods destabilize the stable state of the riverbed (Vericat et al. 2006). Therefore, in the study area flood events transported the fine grained sediment fractions away from the river bed, causing declogging, and settled them in certain sections, creating a new setting after each flood event, as in 1997 and 2002 (Búzás et al. 2009, VITUKI 2004). This resulted in a new grouping of the sampling sites each time. A similar situation was observed in the Danube (1998-2002) some kilometers upstream from Vienna, where the change in leakage lasted a couple of weeks. The sampling resolution in the present study was only monthly, yet a cyclic characteristic of clogging was observable over a longer time scale (Blaschke et al. 2003). However, if an armor layer (Schälchli (1992) was already present in the river bed sediment prior to river bed clogging, then it would be able to protect the fine grained sediment from erosion. A part of the fine-grained sediment forms the layer itself, whereas the other connects to it in the course of the suction, reaching down to a depth of a couple of meters. In this way, erosion processes will not be in equilibrium with the effects of deposition (Julien 2010, Sieben 1999). Therefore, the original vertical hydraulic conductivity will not be restored either (Goldschneider et al. 2007), as discussed previously.
This phenomenon to a serious degree endangers the cross border riverbank filtered water production system planned for the future (Kármán 2013). Using a numeric model, Koczka Bara et al. (2014) pointed out the important role of river bed clogging in relation to the interaction of SW and GW in a setting similar to the Szigetköz area. Though it may be only a meter thick, such a layer affects the equipotential GW level to a high degree, decreasing the effect of SW in the GW fluctuation. In the case of such a layer attaining a thickness of 2 meters the SW will be incapable of reaching the GW, such as at site C in the Szigetköz. Depending on the sediment material and the aquifer rocks, the watershed structure and the flow paths, riverbed clogging can significantly change over short distances within one river section, and is traceable through the SW-GW interaction.
With climate change increasing the number of extreme weather events (Gao et al. 2006), the frequency of the above discussed tandem of clogging due to a significant decrease in runoff and de-clogging due to floods is expected to also increase. The scenario discussed in the paper closely resembles a state that may be expected in general on any river where flow velocity is
decreased due to global changes, anthropogenic activity or any other cause relating to decreased bank-filtration.
4.3 Background processes governing the SW-GW interaction
In to the PCA results for site A (Fig. 9.), similarities can be observed between the SW and GW, mostly in the 1st PC (Fig. 9.). The linear relationships of the SW are transferred into the GW due to its seepage, as also seen in the basic statistics. The influential role of HCO3- in the 1st PC of the SW and the GW (Fig. 9.) indicates good communication between these waters at site A.
In the case of the other two sites, however, HCO3- is not dominant due to the increased residence time of the GW. At site B only Na+, Ca2+, Mg2+ and EC could be considered influential in both the SW and the GW, whereas in the case of 6 other water quality parameters (T, Cl-, HCO3-, SO42-, Sr, U) these differed, i.e. the background processes of the SW and GW of the Danube are indeed different at site B (Fig. 9.). In the 2nd PC of the GW, five elements in water (B, Al, Co, Cu, Fe) have an influential role (Benner et al. 1995), indicating interaction between the GW and the fine grained sediment of the surface (Gaillardet et al. 2003). Although B and Al are located on opposite sides of the mobility scale, still these are both present in the 2nd PC, indicating the same set of processes, e.g. sorption and ion exchange processes in clay minerals and Fe- and Mn-oxy-hydroxides (Dong et al. 2000, Matsunaga et al. 1993) (Fig. 9.). In addition, the role of Fe should also be mentioned; it is in close connection with the redox conditions of the water through the precipitation of iron oxides (Chapelle 2005, Jain and Ram 1997, Phillips 1999). Although the 4th PC only explained 10 % of the total variance, it suggests that those parameters in close connection to the oxygen content of the water have an important role when the system is considered as a whole. These findings support the suspicion that the main characteristics of site B are determined by the flow coming from the aquifer towards the river (Fig. 3B; h1>hr2).
With regard to PCA at site C, obvious differences were observed between the SW and GW, as seen in the periodicity and HCA results (Fig. 8). These differences are presumably caused by the fine-grained sediments settled on the river bottom because of the decreased flow velocity in the section in which site C is located. Due to the deposition of these sediments, a layer was formed on the bottom, causing river bed clogging. Such a phenomenon has also been observed in the River Rhine, driven mainly by sedimentation, water quality, erosion, etc.
(Pholkern et al. 2015, Schälchli 1992), consequently resulting in a decreased GW level in the area. The sediment thickness and quality varies, depending on the hydrological conditions, bed morphology and river section characteristics (Hoehn 2002, Schmidt et al. 2003, Sear 1995, Trajkovska et al. 2014). With the change in the thickness and the composition of fine-grained sediment on the riverbed, the communication between the SW and the GW has also changed.
As pointed out by Kovács et al. (2015), after the diversion of the Danube, recharge from the river towards the GW continuously decreased, as manifested in the decrease in the level of the GW. This layer of fine-grained sediment, however, was washed away from the site in 1997 and 2002 by the two extreme high floods, in this way temporarily re-establishing natural communication between the SW and the GW which had obtained prior to the diversion of the Danube.
5 Conclusions
Understanding the changes in GW interaction with SW is essential to be able to sustain a healthy environment in the vicinity of the diverted Danube. On the basis of, and by supplementing the results of the time series and multivariate analyses, it has been made clear that communication between the SW and the shallow GW is dampened by river bed clogging, mainly due to the diversion of the Danube in the area, and this only changes substantially in the case of large floods.
The phenomenon of river bed clogging can be mainly attributed to the decreased amplitude of periods in the GW at the sampling site most affected by riverbed clogging (site C), as well as the formation of the different temporal cluster groups. What is more, the geochemical aspects of the present study take us beyond our previous knowledge of this phenomenon. By grouping the sampling sites, it was proven that floods fundamentally change the characteristics of GW flow compared to the pre-diversion state mostly determined by the generally low river water level to a different degree in the surface/sub-surface waters. In the case of large floods (1997 and 2002), a counter-effect may be observed: higher water level and flow velocity remove the clogged strata, therefore the communication between the SW and the GW is restored and the processes of the SW begin to appear in the GW. Thus floods – even artificial – can in this sense be considered as beneficial to the area.
The difference in the pattern of stochastic relationships between the SW and the GW concurred with the results of other multivariate analyses, underlining once again the diverse hydrological situation (recharge/discharge/river bed clogging) obtaining in the area. This is primarily attributed to the diversion of the river. The scenario discussed in the paper closely resembles a state that is to be expected in general on any river where flow velocity is decreased by global changes, anthropogenic activity or any other cause related to decreased bank- filtration.
References
Alexander, L.V., Zhang, X., Peterson, T.C., Caesar, J., Gleason, B., Tank, A.M.G.K., Haylock, M., Collins, D., Trewin, B., Rahimzadeh, F., Tagipour, A., Kumar, K.R., Revadekar, J., Griffiths, G., Vincent, L., Stephenson, D.B., Burn, J., Aguilar, E., Brunet, M., Taylor, M., New, M., Zhai, P., Rusticucci, M. and Vazquez‐Aguirre, J.L. (2006) Global observed changes in daily climate extremes of temperature and precipitation. Journal of Geophysical Research:
Atmospheres 111(D5).
Assani, A.A. and Petit, F. (2004) Impact of hydroelectric power releases on the morphology and sedimentology of the bed of the Warche River (Belgium). Earth Surface Processes and Landforms 29(2), 133-143.
Bárdossy, A. and Molnár, Z. (2004) Statistical and geostatistical investigations into the effects of the Gabcikovo hydropower plant on the groundwater resources of northwest Hungary/Analyses statistiques et géostatistiques des effets de la centrale hydroélectrique de Gabcikovo sur les ressources en eaux souterraines du Nord-Ouest de la Hongrie. Hydrological Sciences Journal 49(4).
Bartholy, J., Pongrácz, R. and Hollósi, B. (2013) Analysis of projected drought hazards for Hungary. Advances in Geosciences 35(35), 61-66.
Baxter, R. (1977) Environmental effects of dams and impoundments. Annual Review of Ecology and Systematics 8, 255-283.
Bednarek, A.T. (2001) Undamming rivers: a review of the ecological impacts of dam removal.
Environmental management 27(6), 803-814.
Benner, S.G., Smart, E.W. and Moore, J.N. (1995) Metal behavior during surface-groundwater interaction, Silver Bow Creek, Montana. Environmental science & technology 29(7), 1789- 1795.
Bilotta, G. and Brazier, R. (2008) Understanding the influence of suspended solids on water quality and aquatic biota. Water Research 42(12), 2849-2861.
Blaschke, A.P., Steiner, K.-H., Schmalfuss, R., Gutknecht, D. and Sengschmitt, D. (2003) Clogging Processes in Hyporheic Interstices of an Impounded River, the Danube at Vienna, Austria. International Review of Hydrobiology 88(3-4), 397-413.
Bourg, A., Darmendrail, D. and Ricour, J. (1989) Geochemical filtration of riverbank and migration of heavy metals between the Deûle River and the Ansereuilles alluvion-chalk aquifer (Nord, France). Geoderma 44(2), 229-244.
Bourg, A.C. and Bertin, C. (1993) Biogeochemical processes during the infiltration of river water into an alluvial aquifer. Environmental science & technology 27(4), 661-666.
Bro, R. and Smilde, A.K. (2014) Principal component analysis. Analytical Methods 6(9), 2812- 2831.
Brockwell, P.J. and Davis, R.A. (2013) Time series: theory and methods, Springer Science &
Business Media.
Brunet, R.C. and Astin, K.B. (1999) Spatio-temporal variation in some physical and chemical parameters over a 25-year period in the catchment of the river Adour. Journal of Hydrology 220(3–4), 209-221.
Brunke, M. (1999) Colmation and depth filtration within streambeds: retention of particles in hyporheic interstices. International Review of Hydrobiology 84(2), 99-117.
Búzás, K., Guti, G., Hahn, I., Ijjas, I., Janák, E., Józsa, J., Kern, K., Kitley, G. and Kovács, G.
(2009) Preliminary Feasibility Study: The Rehabilitation of the Szigetköz Reach of the Danube, p. 144, The Hungarian Section of the Working Group for the Preparation of the Joint Hungarian-Slovak Strategic Environmental Assessment Established by the Government Delegations of the Gabcikovo-Nagymaros Project, Budapest.
Chapelle, F. (2005) US Geological Survey, Columbia, SC, USA. Surface and Ground Water, Weathering, and Soils: Treatise on Geochemistry 5, 425.
Chapman, D.V., Bradley, C., Gettel, G.M., Hatvani, I.G., Hein, T., Kovács, J., Liska, I., Oliver, D.M., Tanos, P., Trásy, B. and Várbíró, G. (2016) Developments in water quality monitoring and management in large river catchments using the Danube River as an example.
Environmental Science & Policy 64, 141-154.
Chebotarev, I. (1955) Metamorphism of natural waters in the crust of weathering—1.
Geochimica et cosmochimica acta 8(1-2), 22-48.
Cloutier, V., Lefebvre, R., Therrien, R. and Savard, M.M. (2008) Multivariate statistical analysis of geochemical data as indicative of the hydrogeochemical evolution of groundwater in a sedimentary rock aquifer system. Journal of Hydrology 353(3–4), 294-313.
Cook, P.G. and Herczeg, A.L. (2000) Environmental tracers in subsurface hydrology.
Cooley, J.W. and Tukey, J.W. (1965) An algorithm for the machine calculation of complex Fourier series. Mathematics of computation 19(90), 297-301.
Dams, W.C.o. (2000) Dams and Development: A New Framework for Decision-making: the Report of the World Commission on Dams, Earthscan.
Dankers, R. and Hiederer, R. (2008) Extreme temperatures and precipitation in Europe: analysis of a high-resolution climate change scenario. Office for Official Publications of the European Communities Luxembourg, EUR 23291.
Darcy, H. (1856) Les fontaines publiques de la ville de Dijon: exposition et application, Victor Dalmont.
Deak, J., Deseo, E., Bohlke, J. and Revesz, K. (1996) Isotope hydrology studies in the Szigetköz region, north-west Hungary. Isotopes in water resources management 1, 419-432.
Dong, D., Nelson, Y.M., Lion, L.W., Shuler, M.L. and Ghiorse, W.C. (2000) Adsorption of Pb and Cd onto metal oxides and organic material in natural surface coatings as determined by selective extractions: new evidence for the importance of Mn and Fe oxides. Water Research 34(2), 427-436.
Döll, P. and Zhang, J. (2010) Impact of climate change on freshwater ecosystems: a global- scale analysis of ecologically relevant river flow alterations. Hydrology and Earth System Sciences 14(5), 783-799.
EC (2000) Directive 2000/60/EC of the European Parliament and of the Council establishing a framework for Community action in the field of water policy, Brussels.
ÉDUKÖVIZIG, É.-D.K.é.V.I.-N.-T.W.D. (2014), Győr.
Estrany, J., Garcia, C. and Batalla, R.J. (2009) Groundwater control on the suspended sediment load in the Na Borges River, Mallorca, Spain. Geomorphology 106(3–4), 292-303.

![Fig. 7. Periodic behavior of Na + and Cl - [mg l -1 ] and period anomalies in the surface water A), and the groundwater B) (1996-2004)](https://thumb-eu.123doks.com/thumbv2/9dokorg/1429780.121539/19.892.225.665.482.641/fig-periodic-behavior-period-anomalies-surface-water-groundwater.webp)