25th Internutionul Symposium on Analytical ami Problems
MONITORING OF DROUGHT AND INLAND EXCESS WATER IN THE SERBIAN- HUNGARIAN CROSS-BORDER REGION IN THE FIRST HALF-YEAR OF 2019 Zsuzsanna Ladányi*, Boudewijn van Leeuwen, Viktoria Blanka, Zalán Tobak, Kovács
Ferenc, Gábor Mezősi
Department o f Physical Geography and Geoinformatics, University o f Szeged, H-6720 Szeged, Egyetem u. 2-6, Hungary
* e-mail: ladanyi@geo. u-szeged. hu
Abstract
Due to climate change and its natural geographic conditions, the water supply o f the Hungarian-Serbian cross-border region shows extreme variation. The area suffers from both droughts and inland excess water, thus research and geographical observation o f the problems is very important. This study demonstrates the development o f a monitoring system o f the two phenomena by the help o f satellite images supplemented by field data using crowdsourcing elements within the framework o f the Drought and Excess Water Research and Monitoring Centre, furthermore, evaluates the monitoring results for the first half-year in 2019.
Introduction
One o f the most important environmental problems nowadays is global climate change, and its regional and local effects. In the last 100 years the average temperature o f the Earth increased by +0.7°C and undesirable changes occurred also in case o f precipitation, as long periods without rainfall and extreme precipitation events became more frequent in large parts o f the temperate zones on both hemispheres [1], Climate change has a considerable impact on the lowland areas o f the Carpatian Basin. Due to climate change and the natural geographic conditions, the water supply o f the region is showing extreme variation, the area suffers from both drought [2] and inland excess water [3] - these can take turns, and occur in consecutive years or even in the same year.
It was also observed that the frequency o f extreme weather conditions’ occurrence has also changed. Years drier than the average have become more frequent, and the distribution o f the rainfall is turning less and less favourable, as beside the long dry periods, extreme precipitation events occur especially in the summer causing an increase in runoff o f the valuable water resources. For this research and geographical observation o f the problems related to climate change and hydrological extremes is very important in the region [5] [6] [7].
This study presents the results o f the Drought and Excess Water Research and Monitoring Centre (DERMC) to set up a monitoring system o f the two phenomenon by the help o f satellite images supplemented by field data using crowdsourcing elements in the Hungarian- Serbian cross-border region, furthermore evaluates its operation for the first half-year in 2019.
Study area
The developed monitoring system covers Southeast Hungary (Csongrad and Bacs-Kiskun counties) and Vojvodina (Fig. la). The majority o f the area is lowland, where the mean annual temperature is around 11°C and the annual precipitation is 500-600 mm. The highest mean temperature occurs in July, typically between 21°C and 23°C, while the rainfall is around 300 mm in the summer half o f the year [8] [1]. Examining the climate change trends o f the last decades reveals that the temperature has been rising and the precipitation level has slightly decreased [9] [10], resulting in a 20-30 mm yearly precipitation shortage in the area.
The most important rivers are the Danube, the Tisza/Tisa River, the Maros River, and the Tamis River; besides these, most o f the surface waterflows are artificial canals. The study
area is diverse in terms o f soil type, physical properties and soil moisture regime o f the soils (Fig. lb). Chernozem soil and its different variations dominate the area; sandy soils and meadow soils are also common in the region. The land cover and land use o f the area is dominated by agricultural land (Fig. 1/c). In the last 200 years large areas o f land became used for farming purposes, therefore the proportion o f agricultural land is high, and the natural vegetation remained only in relatively small areas. Even in these areas, where the natural vegetation survived, unfavourable processes can be observed, because the climate change o f the last few decades and human activities resulted in natural wetland habitats starting to dry out, and this process is accompanied by the degradation and transformation o f the vegetation [11].
Figure 1. Location o f the study area, furthermore its soil types (FAO 1985) and land cover (Corine 2018) (1: Artificial surfaces; 2: Agricultural areas; 3: Forests and semi natural areas;
4: W aterbodies; 5: Wetlands)
Methods
The methods for drought and excess water monitoring were based on selected parameters like surface moisture, vegetation and water abundance using medium and low-resolution satellite data and crowdsourcing methods. The main goal was to estimate the spatial and temporal changes o f the two hydrological extremes under study. The developed monitoring system collects and processes remotely sensed (drone, Sentinel 1 and MODIS satellite) and in situ surveyed datasets (soil moisture and meteorological data and inland excess water patches). The data is stored in a geodatabase and published online using web mapping technologies.
Inland excess water, vegetation anomaly and surface moisture monitoring using medium and low-resolution satellite images
The work process that was developed for inland excess water monitoring utilises a combination o f satellite images from Sentinel 1 radar data and Sentinel 2 multispectral data to produce regional scale inland excess water maps in an operative way, on a weekly basis. The radar and optical data-based processing phases use imagery form Sentinel 1 A, IB, 2A and 2B.
These satellites provide a full coverage o f the sampling area approximately every third day.
Thanks to the C-band active remote sensing technology, data can be acquired regardless the part o f the day or weather conditions. The workflow combines radar thresholding, and optical
25th International Symposium on Analytical and Environmental Problems
The vegetation assessment uses MOD09A] surface reflectance images and M OD13AI.006 vegetation index products and data were processed using the Google Earth Engine cloud computing platform (see methods in more details in [13]). For the demonstration o f the current condition o f vegetation anomalies compared to the long-term average (2000-2017), the NDDI drought index was applied where a positive deviation indicates drought conditions:
NDW1 - (NIR - SWJR) / (NIR + SWIR) NDDI = (NDVI - NDW1) / (NDVI + NDWI)
NDDIstandardiscd = (NDDI- NDDIaVerage) / ND Deviation
where NIR and SWIR are respectively the near infrared and the short-wave infrared bands o f the MODIS instrument. NDVI is Normalized Difference Vegetation Index, NDWI is Normalized Difference Water Index.
Based on the standardised anomaly the water shortage o f the studied period can be identified, which reduces the biomass production or delays its temporal dynamics.
Surface moisture monitoring is based on the normalized difference moisture index (NDMI) calculation using Google Earth Engine:
NDMI = (NIR - SWIR) / (N IR + SWIR)
where NIR is the narrow near infrared band 8a and SWIR is the short-wave infrared band 11 o f atmospherically and geometrically corrected Sentinel 2 level 2 data.
To reduce the missing data due to cloud cover, composites were created for the median pixel value o f 10 days. This ensures that the pixels o f at least 2 images per composite were considered.
GeoApp and crowdsourcing contributing to inland excess water inundation mapping
The location-based data collecting application for Android and iOS devices enables the monitoring o f inland excess water patches. The application has an editable layer, during data collection, the features o f the inland excess water patches can be provided according to a predefined categorical system, and the location o f the observed phenomenon can be specified on the map by manually or using the GPS position. A photograph can be attached to the observation using the camera o f the device. The collected data are automatically transferred to the interactive maps o f the project. The app can be downloaded for free, but registration is required.
Results and discussion
All data collected and processed in the framework o f the project is made available via the public project website (https://aszaly.geo.u-szeged.hu/wateratrisk/) and maps or diagrams.
Data can be downloaded for further analysis.
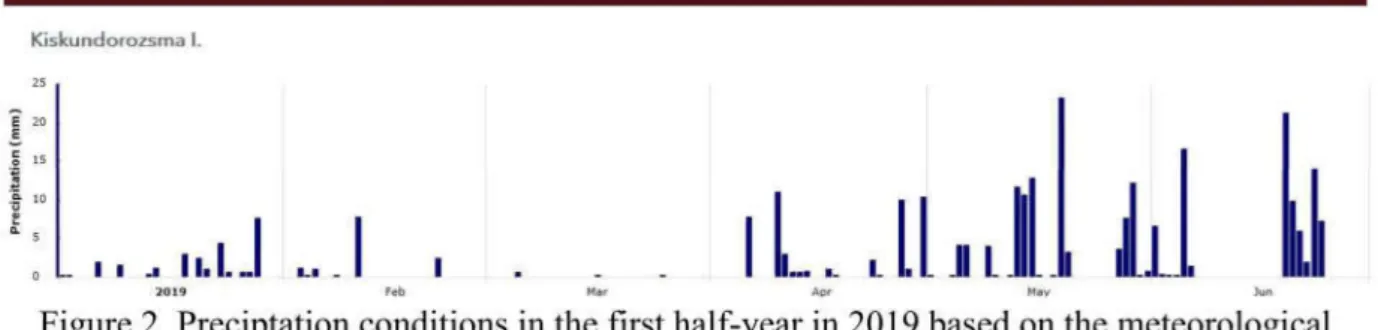
Due to the low amount o f precipitation between October 2018 and March 2019, drought formed in winter/early spring in 2019, which can be considered extraordinary. There was hardly any water stored in the upper soil layer, resulting in reduced crop growth during the autumn-winter period. At the end o f April, a more humid period began, and the soil moisture deficit was recharged, resulting in favourable condition for agriculture e.g. autumn wheat. In May, however, a lot o f precipitation fell (more than two times more than the long-term average), causing rather unfavourable impacts (e.g. plant infections) and water management challenges (Fig 2). As a result, also minor inland excess water inundations could form between the end o f May and mid-June, which is uncommon in normal years.
K is k u n d u r o z s n ia L
Figure 2. Preciptation conditions in the first half-year in 2019 based on the meteorological station o f the DERMC (Source: https://aszaly.geo.u-szeged.hu/wateratrisk/)
Figure 3 represents the DERMC monitoring results in the between March and June 2019. As very limited precipitation fell until April 2019, a significant drought developped, which is well observable on surface wetness maps. Vegetation showed negative anomalies in the first month o f the vegetation period only on sand covered areas and along the rivers. Flere, differences in soil structure and water household could mitigate the impact o f the formed drought on the vegetation (e.g. on Chernozems average conditions can be observed in the upper part o f Vojvodina). For the end o f April, moisture conditions changed due to rainfall, and the water conditions improved along the rivers according to the surface moisture maps, but still dry contitions can be observed on higher parts o f the sandland. Due to the high amount o f precipitation in May, the surface moisture contitions were almost ‘w et’ except for the Chemoems in Vojvodina and South Hungary. In those areas, the vegetation still showed negative anomalies due to the drought conditions. In June, the surface moisture maps showed that the whole area is under wet conditions and vegetation index shows similar conditions compared to the long-term avearage. In 2019, there were no significant inland excess water floods during the late-winter/early spring period, just some relatively small inundations between the end o f May and mid-June. The developed GeoApp will be used in the future to validate the satellite derived inundation patches with field observation.
r t t i "i 1t 111
0 50 100 150
I No drought Normal I Drought I Extreme drought
Figure 3. Surface moisture (top) and vegetation anomaly (bottom) maps at the end o f March,
25th International Symposium on Analytical and Environmental Problems
Conclusion
This study presented the satellite image based and in situ monitoring results o f the Drought and Excess Water Research and Monitoring Centre for the HU-SRB cross-border area for the first half-year o f 2019. It was shown that substantial drought occurred in the winter-early spring period, which had significant impact on agriculture. Due to the humid May, the situation was balanced, however, the extraordinary amount o f precipitation in May and June, resulted in small inland excess water inundations in the study area. The developed methods and the applied used indices for monitoring proved to be useful to demonstrate the drought and excess water conditions in the studied region.
Acknowledgements
The research was funded by the WATERatRISK project (HUSRB/1602/11/0057).
References
[1] OMSZ. https://www.met.hu/eghajlat/eghajlatvaltozas/megfigyelt_valtozasok/ (2019)
[2] K. Fiala, V. Blanka, Zs. Ladányi, P. Szilassi, B. Benyhe, D. Dolinaj, I. Pálfai. Drought severity and its effect on agricultural production in the Hungarian-Serbian cross-border area.
Journal o f Environmental Geography 7 (3—4), 43-51. (2014)
[3] Cs. Bozán, J. Körösparti, L. Pásztor, I. Pálfai. Excess water hazard mapping on the South Great Hungarian Plain. Proceedings o f the 13th International Conference on Environmental Science and Technology Athens, Greece, 5-7 September 2013, 8. p. (2013)
[4] G. Mezősi, V. Blanka, Zs. Ladányi, T. Bata, P. Urdea, A. Frank, B. Meyer. Expected mid- and long-term changes in drought hazard for the South-Eastern Carpathian Basin.
Carpathian Journal o f Earth and Environmental Sciences 11 (2), 355-366. (2016)
[5] F. Kovács, F. Assessment o f regional variations in biomass production using satellite image analysis between 1992 and 2004. Transactions in GIS 11/6, 911-926. (2007)
[6] Zs. Ladányi, J. Rakonczai, A.J. Deák. A Hungarian landscape under strong natural and human impact in the last century. Carpathian Journal o f Earth and Environmental Sciences 6 (2), 35-44. (2011).
[7] J. Rakonczai. Effects and consequences o f global climate change in the Carpathian Basin.
In: Blanco J., Kheradmand H. (eds.): Climate Change - Geophysical Foundations and Ecological Effects. Rijeka: InTech, 2011, 297-322. (2011)
[8] J. Smailagic, A. Savovic, D. Markovié, D. Nesic. Climate characteristics of Serbia. Republic Hydrometeorological Service of Serbia. (2013)
[9] V. Blanka, G. Mezősi, B. Meyer. Projected changes in the drought hazard in Hungary due to climate change. Időjárás / Quarterly Journal o f the Hungarian Meteorological Service
117(2), 219-237 (2013).
[10] J. Spinoni, T. Antofie, P. Barbosa, Z. Bihari, M. Lakatos, S. Szalai, T. Szentimrey, J. Vogt.
An overview o f drought events in the Carpathian Region in 1961-2010. Advances in Science and Research, 10, 21-32. DOI: 10.5194/asr-10-21-2013 (2013)
[11] J. Rakonczai, K. Fiala, M. Mesaros, A. Frank, S. Popov. Water management conflicts. In.
Blanka, V., Ladányi Zs. (eds) Drought and Water Management in South Hungary and Vojvodina. University o f Szeged, Szeged, 78-80. (2014)
[12] B. van Leeuwen, Z. Tobak, F. Kovács, Gy. Sipos. Towards a continuous inland excess water flood monitoring system based on remote sensing data, Journal o f Environmental Geography, 10(3-4), 9-15. DOI: 10.1515/jengeo-2017-0008 (2017)
[13] A. Gulácsi, F. Kovács. Drought monitoring o f forest vegetation using MODIS-based normalized difference drought index in Hungary. Hungarian Geographical Bulettin 61 (1), 29-42.(2018)