68 (2019) Supplement, 24-39 First published online: 24 Sept 2019
Corresponding author: S.ENGEL-DI MAURO, 133 Science Hall, Department of Geography, SUNY New Paltz, New Paltz, NY 12561, USA
E-mail: engeldis@newpaltz.edu
Short-term acidification detection in soils along the northern Dráva floodplain (SW Hungary) by means of Acid Neutralising Capacity
(ANC) analysis
Salvatore ENGEL-DI MAURO
Department of Geography, State University of New York, New Paltz, USA Abstract
Various methods can be used for soil acidification monitoring, which can be useful towards remediation or preventing environmental degradation. It has been demonstrated that acidification can be made evident over the span of a few years, with proper monitoring. However, a reliance on pH as a main indicator can lead to detection inadequacies, especially where soils are relatively well buffered against acidity and acid deposition is negligible. A technique employing acid-neutralising capacity (ANC) derivation was applied to cultivated and uncultivated Alluvial Meadow soils to find out whether ANC data could prove effective in determining the occurrence and degree of acidification. Sampling and lab work were carried out between 2009 and 2010 on 33 sites under various land uses. Unlike pH, ANC, soil organic matter (SOM), and cation exchange capacity (CEC) decreased significantly. ANC analysis appears to be effective in detecting acidification trends over short periods and, in contrast to previous studies, under ostensibly unremarkable conditions.
Key words: acid-neutralising capacity (ANC), agriculture, Drava floodplain, Hydromorphic meadow soils, soil acidification
Introduction
Soil acidification can impair ecosystem functions, food production, and human health by inducing Al and Mn toxicity, reducing nutrient availability and cycling rates, and contributing to surface water heavy metal contamination, among other consequences (BLAKE 2005; HELYAR and PORTER 1989; SUMNER 1998). Monitoring and early detection improves chances to remediate if not prevent acidification. Most related research and monitoring relies on pH measurement, which reflects active acidity and leaves unaddressed exchangeable (and residual) forms of acidity. This can lead to missing acidification trends in, for example, highly buffered soils in regions of low to no acid precipitation. Moreover, amendments like lime can mask the acidifying effects
of reductions in soil organic matter (SOM) and cation exchange capacity (CEC) by raising pH over the short term. Underestimation in the longer term may also result from pH not accounting for mineral dissolution processes (BRAHY, et al. 2000; LESTURGEZ, et al. 2006).
Several more effective techniques can be used to measure acidification. Base saturation and buffer pH values give an indirect indication of acidification, and when combined with solution pH, can show trends for both solution and exchange sites processes. Ca/Al ratios can also reveal the intensity of acidity at any one time and acidification trends can be thereby deduced (CONYERS, et al. 1991). Another method consists in estimating buffering capacity by tracking the amount of acid per unit of pH change and inserting the derived values in an acidification rate equation (HELYAR and PORTER 1989; NELSON and SU 2010). A major shortcoming in these techniques is the lack of tracking for acidifying and alkalising compounds, which helps account for the interplay between soil properties and human impacts and thereby specify anthropogenic sources (PORTER, et al. 1995; SUMNER 1998). This is achieved by assessing soil acid neutralising capacity (ANC), the amount of strong acid necessary to reduce pH in a system to a given reference value. The focus is on the components contributing to relative acidity by measuring the concentrations of different acidifying and alkalising compounds (VAN BREEEMEN, et al. 1983) or by titration with acids and bases (BINKLEY and SOLLINS 1989).
Findings using these methods suggest that soil acidification can be detected over periods as short as two to four years (HELYAR, et al. 1990; RICHTER and MARKEWITZ
2001). Although soil ANC and pH change magnitudes do not necessarily correspond, the advantage of estimating changes in soil ANC lies in differentiating sources of acidification, including in detecting outcomes due to human impact (VAN BREEEMEN
and WRIGHT 2004). VAN BREEEMEN et al. (1983) succeeded in using soil ANC calculations to distinguish the acidifying effects of regular precipitation from those of atmospheric deposition from industrial emissions. Field experiments and monitoring at Hubbard Brook, USA, showed a decline in soil ANC by 2.0 kmol ha-1 over 13 years (-0.15 kmol ha-1 a-1) for Fragiorthods under forest, in large measure due to S deposition (WHITTAKER, et al. 1979). At Hackfort, The Netherlands, soil ANC decreased by 4.8 kmol ha-1 over only two years (-2.4 kmol ha-1 a-1) for Dystrochrepts under forest. Most of the acidifying compounds were traceable to a combination of net NH4+ inputs from protonated and nitrified atmospheric NH3 inputs (VAN BREEEMEN and JORDENS 1983).
So far, research has focused on atmospheric acid deposition and most investigated sites are characterised by intrinsically poor buffering capacities. Yet it has been shown that agrochemical N fertiliser additions can lead to soil acidification in temperate regions (BARAK, et al. 1997; BOLAN, et al. 2003; BOUMAN, et al. 1995). These impacts, however, take more than a decade to become evident. A study was therefore carried out to determine the short-term detectability of acidification relative to pH measurement, in
an area with known problems of soil pH decline but characterised by well-buffered soils that are relatively unaffected by acid deposition. Because the differentiation of acidifying and alkalising components is important to identifying and thereby potentially addressing anthropogenic sources, an ANC derivation technique was preferred.
Additionally, component-based analysis instead of titration was adopted so as to consider more effectively the typically gradual dissolution rates in mineral soils. Due to the short time frame of this study, results cannot be taken to indicate trends in soil properties, although significant changes in soil ANC may be evinced.
Materials and Methods Environmental Setting and Data Processing
The area investigated (Figure 1) in the northern part of the Dráva River Floodplain (SW Hungary) is circumscribed within an Early Holocene plain underlain by a series of aggradational and degradational sequences (17.9056-18.1346° E, 45.8193-45.8966° N;
111-183 m above sea level).). A succession of cut-off meanders and oxbow lakes makes for variable soil texture and predominantly alluvial parent material. Until nineteenth century levee construction and stream canalisation, the area was prone to flooding (LOVÁSZ 1977).
Most rainfall occurs in late spring and late summers are driest (mean annual precipitation 670-700 mm). Mean annual temperature is 11 °C, ranging between -3 and 27 °C. Over the past decades, autumns and winters have become milder, while total yearly precipitation has declined (PONGRÁCZ, et al. 2014; TRÁJER, et al. 2013). During fieldwork years, 2008 precipitation was higher but less acidic (491 mm; average pH 6.01) than 2009 (474 mm; average pH 5.63). The 2009 growing season (April-October) was drier (226 mm) than that of the preceding year (329 mm). Precipitation pH data from nearby gauging stations (OMSZ 2011) were turned into H+ mol kg-1 values. They amount to negligible H+ additions (1.957 x 10⁻⁵ to 2.283 x 10⁻⁵ mol kg-1), relative to typical values (0.1 kmol-1 ha-1 or ca. 3.774 x 10⁻⁴ mol kg-1, assuming 10 cm depth and 2.65 g cm-3 density)for areas unaffected by industrial emissions (VAN BREEEMEN, et al.
1991). Because of this, the main acidifying factors were assumed to be from agricultural sources.
Data from the Soil Conservation Information Monitoring system (Talajvédelmi Információs Monitoring - TIM) and its predecessor, the Agrochemical Information and Management System (Agrokémiai Információs és Irányítási Rendszer - AIIR), show that 54% of farmland is made up of Hydromorphic (Alluvial) Meadow soils (Réti öntéstalaj in the Hungarian soil classification, or Gleyic Fluvisols in the WRB system;
KRASILNIKOV, et al. 2009). Clay mineralogy is predominantly chlorite, illite, and smectite. Soil monitoring from the 1980s and 1990s and results from the author’s 1999 fieldwork revealed decreasing soil pH. About 30% of cultivated soils exhibited
pHKCl < 5.5 compared to values above pHKCl 6 for the uncultivated equivalent soil types (n = 81-323; BARANYAI, et al. 1987; BMNTÁ 1989; VÁRALLYAY, et al. 1995). However, a dearth of current monitoring makes it difficult to verify the occurrence or determine the degree of acidification.
Figure 1
Location of study area and sampling points
Cultivated plots were between 0.02 and 20 ha in area. Farmers grew a variety of vegetables on smaller plots (beans, potatoes, paprika peppers, celeriac, onions, garlic, herbs, etc.), and included maize or watermelon where parcels were larger than ca. 0.25 ha. Larger land owners (> 5 ha) grew mainly cereal crops (wheat, barley, and
maize), sunflower, and soy. Agrochemical use varied mainly in relation to farmer income and a few farmers used organic amendments. No major changes were detected in crop yield during the project period. Yields were within FAOSTAT-reported national averages for farms using more than 100 kg agrochemical fertiliser, but above average for maize (for more details, see ENGEL-DI MAURO 2018).
Sampling
Thirty-three sites were selected on the basis of soil type, land use, and accessibility (i.e., permission from private owners or municipal government). A soil map (1:100,000 scale) was used to determine the area covered by Alluvial Meadow soils (MÉM ORSZÁGOS FÖLDÜGYI ÉS TÉRKÉPÉSZETI HIVATAL 1983a-b) and preliminary field analyses were carried out in 2008 for verification. Thirty cultivated parcels comprised the variable cases, including two orchards and two pastures. Three fields were comprised of two residential parks and one forest. The park areas were within village centres and, according to local inhabitants and agronomists, they have never used for farming purposes. Disturbed areas (such as fire places, compacted zones, sparse sport infrastructure, etc.) were avoided. These three sites functioned as comparative controls.
Samples under forest were expected to have lower ANC values relative to cultivated sites.
One composite sample per ha (or smaller, depending on parcel area) was collected at each site at a single-tiered sampling depth (0-30 cm) prior to fertiliser application (February-March) in 2009 and 2010 (TAN 1996). Sampling was conducted along diagonals from field corners, with six samples taken per diagonal. A hand-held Trimble Juno ST GPS receiver was used to ensure sampling at the same location. The total number of composite surface samples was 66 (one per site per year). Compositing has been shown not to diminish sampling efficacy in accounting for pH spatial variability (BAKER, et al. 1981). Surface bulk density samples were taken from each land parcel with a core sampler, using a slide hammer.
Sample Analysis
Samples were air dried, processed, and analysed at the Crop Health and Soil Protection Station of Fejér County in Velence, Hungary. Analyses were carried out to determine pH, texture, CEC, SOM, and elemental content. Measurements of pH were made using a Radelkis OP-300 (Sentron) digital meter, 12h after mixing 1:2.5 soil:water (pHW) and soil:1 M KCl suspensions (pHKCl). CaCO3 was measured with a calcimeter as % volume loss following 10% HCl treatment (MSZ-08-0206-2 1978;
BUZÁS 1988). Texture was estimated with the Sándor Arany method (KA), a plasticity index. Ranging between 0 and 80, KA values refer to the amount of cm3 of distilled water added to turn 100 g of soil into a paste of near saturation, at low plasticity, using a mechanical mixer. The volume of added water is divided by the sample weight and
multiplied by 100. Numbers greater than 50 signify increasing clay content and lower than 30 indicate sandy textures (MSZ-08-0205 1978; STEFANOVITS, et al. 1999). CEC was derived from a modified version of the Mehlich method and analysis was carried out with an ICP TJA ICAP 61E (MSZ-08-0214-1 1978). Because the soils under investigation tend to be above pHW 5.8 and are of variable charge, CEC overestimation should not be a concern (see SKINNER et al., 2001). SOM content was determined by using a Spectronic Genesys 5 spectrophotometer, after application of a modified Walkley-Black method, where organic soil constituents are reacted with 5% K2Cr2O7
and concentrated H2SO4 (MSZ-08-0452 1980). Nitrate (NO3-N) and ammonium (NH4-N) forms of N were determined through 10 g soil sample extraction in 50 mL 1 M KCl. Flow Injection Analysis (FIAstar Tecator) was used to measure NO3-N and NH4-N in the filtered extract (TECATOR 1984; MSZ 20135 1999). Ammonium-lactate extractable K, Na, P and 1 M KCl extractable Mg and SO4-S values were derived through atomic absorption method with the above-mentioned ICP analyser (MSZ 20135 1999). Al, Ca, and Fe contents were determined by ICP-AE spectrometry, using a TJA IRIS HR Duo analyser following HNO3 and H2O2 digestion (MSZ 21470-50 2006).
Bulk densities were estimated through the cylindrical core technique (ARSHAD, et al.
1996).
Data Processing and Analysis
ANC was calculated by component composition in moles, using the following equation (VAN BREEEMEN 1991):
ANC = [2CaO]+[2MgO]+[2K2O]+[2NaO]+[2FeO]+[NH3]-[2SO3]-[2P2O5]-[HCl]-[2N2O5] With brackets denoting moles and compounds listed according to their inorganic forms, the equation assesses the net effect of basic and acid components (Sumner, 1998). Since the lowest surface soil pHW throughout the study was 5.89 (pHKCl 4.12), the equation is based on a reference pHW >5.50, which means that Al2O3 dissolution is negligible and therefore excluded from the estimation procedure (VAN BREEEMEN, et al. 1983). Acidifying N sources are given as NH3 to encompass different kinds of inputs, including N fertiliser and (in this case negligible) atmospheric deposition.
Though inorganic N typically plays a minor role (VAN BREEEMEN, et al. 1984), N-fertiliser inputs in farming areas necessitate the inclusion of inorganic forms of N in this specific study (see also VAN BREEEMEN 1991).
All data from the analytical results were converted into their respective formula component equivalents (e.g., NH4+ to NH3; SO4-S to 2SO3) in mol kg-1 soil. Values for pHW, pHKCl, and SOM were included directly from lab results. Results for pHW were available only for one year and were therefore excluded from statistical analyses. Clay content was represented through KA values. CEC (cmolc kg-1 soil) was also considered to account for combined effects of organic substances, clay mineralogy, oxyhydroxides,
and other reactive minerals (RICHTER and MARKEWITZ 2001; SUMNER and NOBLE 2003). Values from 2009 were subtracted from those of 2010 to discern overall losses or increases.
Fertiliser data were converted into H+ kmol ha-1 release or consumption. Over short periods, NH3 and NO3-N lead to OH- production, while inputs of NH4+-N and SO4--S result in the release of H+ and 2H+ respectively (BOLAN, et al. 2003). Crop harvest base cation removal was estimated by known ash-alkalinity content (ANTAL
1999; FAGERIA, et al. 1997). Analytical results were turned into mol kg-1 values, from which net base cation losses were calculated and then multiplied by farmer-reported yield to determine total base cation removals.
All statistical analyses were carried out using SPSS 13.0 (HO 2006; TIMM 2002).
Data were tested for relative conformity to a Gaussian frequency distribution through the Shapiro-Wilk test, which tends to be more reliable when n < 50 (D’AGOSTINO, et al.
1986). The test indicated unconformity for 2010 SOM values. These results were taken into consideration with respect to statistical techniques used, relying on nonparametric ones where appropriate. Each variable was grouped by sampling year and general land use (cultivated, uncultivated). Samples being from the same statistical population (not randomly selected), a Paired Sample t-Test was used to examine the main initial hypothesis that mean ANC is changing. Other variable means were likewise analysed.
Paired Sample t-Test results were compared with correlations among all ANC-related variables considered. These were tested for potentially linear relationships via regression analysis, as appropriate.
Results
Descriptive statistics for soil ANC components (mmol kg-1) are reported in Table 1. Chlorine played no significant role in determining soil ANC. In the case of the cultivated parcels, on the buffering side, there was a decline in mean values for Ca, Fe, K, and Na with slight increases in Mg and NH3 content. Increases in Ca, Fe, and NH3
were statistically significant. All mean levels of acidifying compounds declined and the reduction in NO3-N was statistically significant. On the uncultivated parcels, the tendency differed to some extent, with increasing mean values for Ca, Mg, Na, and NH3
and decreasing mean values for Fe and K. Only S and P declined, with respect to acidifying compounds, while there was NO3-N enrichment. Save for Ca and Fe, the concentration levels of soil ANC components were very low.
Table 1
Values in mmol kg-1 for components of soil Acid Neutralising Capacity (ANC) on cultivated and uncultivated plots, 2009-2010
2CaO 2MgO 2K2O 2NaO 2FeO NH3 2SO3 2P2O5 HCl 2N2O5
Cultivated (n=30) 2009
mean 446.81 37.11 2.06 7.73 1184.72 0.03 0.40 4.30 0.01 0.13 SE 65.81 2.60 0.18 0.85 46.44 0.00 0.03 0.87 0.00 0.01 stdev 360.43 14.22 1.00 4.67 254.35 0.00 0.14 4.77 0.00 0.05 min 119.38 15.42 0.53 0.94 792.47 0.03 0.19 0.65 0.01 0.03 max 1361.37 64.67 5.73 17.94 1700.13 0.03 0.68 22.54 0.01 0.22 2010
mean 357.96 38.00 1.83 7.30 1052.79 0.33 0.40 3.67 0.01 0.10 SE 41.86 2.67 0.14 0.77 39.17 0.02 0.03 0.74 0.00 0.01 stdev 229.26 14.62 0.79 4.22 214.57 0.10 0.14 4.05 0.00 0.06 min 113.80 18.42 0.43 2.49 635.82 0.03 0.20 0.53 0.01 0.00 max 1075.13 73.81 3.61 23.22 1478.97 0.54 0.75 14.65 0.010 0.23 mean
change -88.85* 0.89 -0.24 -0.43 -131.93
** 0.30
** -0.01 -0.63 0.00 -0.03
**
Uncultivated (n=3) 2009
mean 205.72 50.16 7.97 5.22 1500.32 0.03 0.62 5.93 0.01 0.15 SE 32.70 8.22 4.74 2.74 270.94 0.00 0.10 4.32 0.00 0.04 stdev 56.64 14.23 8.21 4.74 469.28 0.00 0.18 7.48 0.00 0.08 min 140.33 35.34 2.48 1.45 1091.95 0.03 0.43 0.86 0.01 0.06 max 239.46 63.71 17.41 10.54 2012.97 0.03 0.78 14.51 0.01 0.20
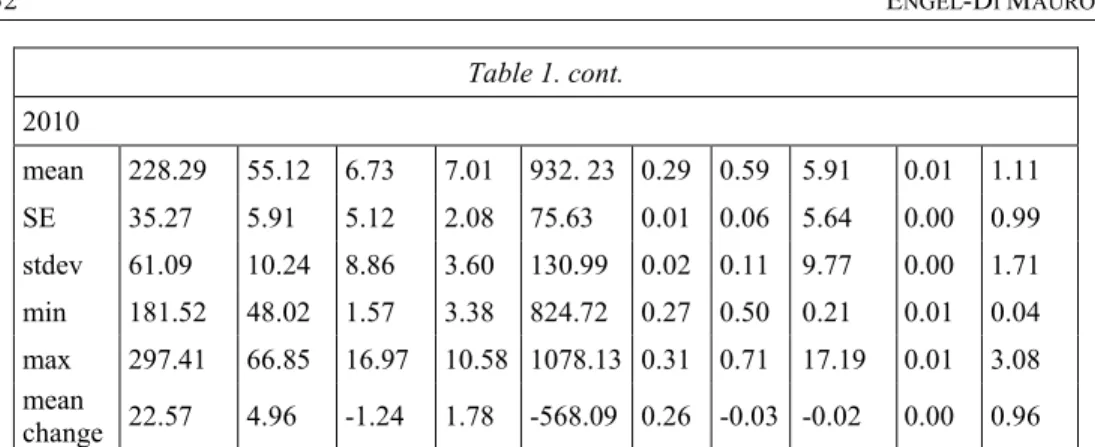
Table 1. cont.
2010
mean 228.29 55.12 6.73 7.01 932. 23 0.29 0.59 5.91 0.01 1.11 SE 35.27 5.91 5.12 2.08 75.63 0.01 0.06 5.64 0.00 0.99 stdev 61.09 10.24 8.86 3.60 130.99 0.02 0.11 9.77 0.00 1.71 min 181.52 48.02 1.57 3.38 824.72 0.27 0.50 0.21 0.01 0.04 max 297.41 66.85 16.97 10.58 1078.13 0.31 0.71 17.19 0.01 3.08 mean
change 22.57 4.96 -1.24 1.78 -568.09 0.26 -0.03 -0.02 0.00 0.96
* Paired sample t-test on changes in mean values significant at the 0.05 level
** Paired sample t-test on changes in mean values significant at the 0.01 level
Calculated soil ANC and ANC-influencing variables are shown in Table 2.
Noteworthy is pH values indicating no acidity problem in cultivated areas. KA values show a tendency for moderate to high clay content (sandy loam to clay), which in this case would mean greater buffering capacity against acids, given prevailing clay mineralogy. SOM (%) appears to be moderate to abundant for such soils and CEC values (cmolc kg-1) reflect what would be expected for soils of the above-described texture range. Unlike pH, which did not change significantly, there were drops in ANC, SOM, and CEC in cultivated fields. In the uncultivated parcels, ANC and CEC also declined, but not SOM. Paired Sample t-tests indicated statistically significant inter- annual differences for ANC (t = 3.727, two-tail p = 0.001, df = 29) and CEC (t = 3.300, two-tail p = 0.003, df = 29). Differences in SOM averages were significant in both the Paired Sample t-Test (t = 3.781, two-tail p = 0.001, df = 29) and Wilcoxon test (Z = -3.093, two-tail p = 0.002).
Since SOM and CEC were found to decline significantly, SOM and CEC figures were treated as predictor variables on ANC through regression analysis. The highest proportion of variance, explained by CEC, was exceedingly low (R2 = 0.186, F = 7.081, p = 0.012). No other variables exhibited any higher regression score, except pH, which showed a low explanatory level (R2 = 0.266, F = 23.202, p < 0.001). Such regression analyses were carried out for exploratory purposes, since pH, like ANC, is actually a product of the effects of the other variables. Treating it here as having any predictor status is merely to underline the fact that ANC reduction cannot be explained by any single variable alone (VAN BREEEMEN, et al. 1983).
Table 2
Acid Neutralising Capacity (ANC) and related soil properties of Northern Drava Floodplain Alluvial Meadow soils
ANC pHKCl KAa SOMb CECc ANC pHKCl KAa SOMb CECc mol kg-1 % cmolc kg-1 mol
kg-1 % cmolc
kg-1 2009
Cultivated (n=30) Uncultivated (n=3)
mean 1.7 6.1 44.9 2.6 20.0 1.8 5.1 55.0 3.8 28.3
SE 0.1 0.2 1.1 0.1 0.9 0.1 0.1 2.7 0.2 1.4
stdv 0.5 0.8 6.1 0.6 4.8 0.5 0.5 14.5 1.3 7.9
min 1.0 4.2 33.0 1.5 10.8 1.4 4.6 41.0 2.5 21.5
max 2.8 7.1 57.0 3.5 29.8 2.3 5.4 70.0 5.0 36.9
2010
mean 1.5 6.2 44.4 2.3 17.8 1.2 5.3 51.0 3.4 19.6
SE 0.1 0.1 1.0 0.1 0.8 0.1 0.6 5.9 0.6 3.0
stdv 0.4 0.7 5.6 0.5 4.2 0.2 1.00 10.2 1.1 5.2
min 0.8 4.6 32.0 1.6 9.9 1.1 4.1 42.0 2.6 13.9
max 2.1 7.3 57.0 3.5 27.2 1.5 6.0 62.0 4.6 23.9
mean change -0.2 ** 0.1 -0.5 -0.2 ** -2.2 ** -0.5 0.1 -4.0 0.4 -8.7
a KA is a plasticity index for particle size.
b Soil Organic Matter
c Cation Exchange Capacity
** Paired sample t-test on changes in mean values significant at the 0.01 level, including Wilcoxon test for SOM data.
Discussion and Conclusion
Overall, the results, taken at face value, do not indicate an acidification trend for the period of study. However, cultivation is clearly associated with average reductions in ANC, SOM, and CEC, while pHKCl increased slightly (Table 2). Notably, no significant changes were found for mean pH or for any variable pertaining to uncultivated plots. Nevertheless, as borne out in the correlation matrix shown in Table 3, ANC, pH, SOM, and CEC are positively correlated with each other. This would be expected because these variables have overlaps in their contributions to ANC and they can have mutually altering influences. As base cations form part of ANC
calculations, CEC should also co-vary with ANC almost by definition. Hence, multiple regression analysis would be inappropriate because of a high degree of multicollinearity, aside from a low samples to variables ratio (and regardless of multiple regression technique, results did not yield more than an adjusted r2 of 0.414).
Table 3
Correlation matrix of ANC and related variables from analytical results for Alluvial Meadow soils (n=66).
ANC pHKCl KA SOM CEC
ANC 1
pH 0.52** 1
KA 0.50** 0.30* 1
SOM 0.25* 0.05 0.78** 1
CEC 0.31* 0.09 0.63** 0.66** 1 Fertiliser -0.29* -0.10 -0.28* -0.18 -0.16 Harvest -0.32** -0.19 -0.04 0.20 0.08
** Pearson’s r correlation significant at the 0.01 level (two-tail).
* Pearson’s r correlation significant at the 0.05 level (two-tail).
ANC and pH are included in Table 3 to illustrate their degree of covariance with predictor variables. ANC co-varies significantly with all the predictor variables considered, while pH only does so relative to KA. This suggests that pH is a less sensitive indicator of acidification over the short term. Notably, there is greater covariance among SOM, KA, and CEC than with other variables. These findings largely agree with those presented in other studies, thereby validating the proxy measures used for some of the variables in this study (e.g., PRASAD and POWER 1997).
Importantly, ANC correlates negatively with both fertiliser additions and harvest removal estimates to a significant degree. The findings on SOM are also of potentially major consequence, since such rapid loss is unusual over a mere two years. Both of these short-term trends could be explainable by cultivation practices. Observed changes in ANC components (Table 1) could be due to cation removals through harvesting, in the cases of Ca, K, and P, as well as to variabilities in amounts and types of fertiliser N inputs. There may also be a leaching effect for some of these compounds, as well as for Fe and Na, related to water-table fluctuations. In the case of Fe, reduction processes due to ponding could account for this, with a greater lability of reduced Fe. As observed in the sampled fields, early spring often features confined areas of ponding and near-surface water-table rise generally.
The objective of this project was to determine whether, and to what extent, soil acidification is occurring in an area along the Drava floodplain. To this end, ANC was calculated and related to known influencing factors, KA (proxy for clay content), SOM,
and CEC. Paired sample t-tests suggest that ANC are likely declining and that two years of data suffice to detect at least incipient acidification, even in less susceptible soils like Hydromorphic (Alluvial) Meadow soils. The results demonstrate that an acidification trend may not be noticeable by means of pH measurement alone. This may be due to the short-term effects on pH of fertiliser additions as well as the fact that ANC includes content on and in soil mineral and organic particles. ANC data can provide a more effective way of identifying potential longer-term trends that are eventually of wider ecological significance.
Under regional climates like those affecting the Drava floodplain, one should expect a tendency for soils to acidify over time. However, in this case, acidification is occurring at a faster rate than typically reported by using pH measurements alone, and there is an appreciable anthropogenic component involved that could make the difference between relatively regular acidification rates and the surpassing of a threshold. Statistical analyses additionally indicated significant SOM reduction. This will likely result in further lowering ANC, although currently the effects are diluted by other variables like clay content. Because the soils considered in this study have been affected by centuries of cultivation, the fate of SOM (and with it presumably CEC) is expected to be largely tied to human impacts. It is uncertain whether changes to SOM can be regarded as anthropogenic or more specifically ascribable to agriculture. The shifts detected may also be an artifice of methodological inadequacies. Greater confidence in the results would be gained through longer-term study and more information over and controls for different farming activities (e.g., tillage methods, harvesting quantities, etc.).
Due to the limitations of this study, it is not possible to ascertain causal linkages among the variables analysed and changes in soil ANC. To assess the relative importance of different sources, more resources are required than were available for the study presented here. Greater research support would enable a longer-term field study (at least five years) with more replicates (more than 100 for ten or more variables), and the inclusion of additional variables, such as irrigation water content, differences in tillage techniques, and water-table depths. Higher spatial resolution in the sampling procedure (and thereby more total samples) could assist in discerning statistically effects that are contingent on spatial distribution. CEC may be declining as a result of decreasing SOM, according to the results of this study, but a longer-term study with finer spatial resolution is necessary to parse out the variables involved in SOM decline and the determinants of change in CEC.
A longer-term study would also enable the detection of threshold conditions and the timing in which they could be reached. Such data would also enable a determination of whether currently observed soil ANC decline falls within the amplitude of soil ANC values over several years or decades and test whether non-equilibrium dynamics are operative. Consequently, the results of this work only point to the usefulness of soil
ANC in detecting short-term acidification trends compared to traditional assessments based on pH measurements.
Acknowledgement
This manuscript is based on a project supported by the National Science Foundation (USA), Grant No. 0615878. The author wishes to thank Attila Melegh (Demographic Research Institute, Budapest), Sándor Kucsera (Soil Testing Lab, Velence), Zita Ferenczi (Hungarian Meteorological Service), Sándor Hajdú (Soil and Plant Protection Agency, Baranya County), Sándor Kurucz (Soil and Plant Protection Agency, Baranya County), Kálmán Vörös (Páprád), Gábor István Tóth (Sellye), and Tibor Tóth (Institute for Soil Sciences and Agricultural Research) for their generous assistance prior to and during the project.
References
ANTAL, J. 1999. Fertilisation for Crops. In: Nutrient Management (ed. G. FÜLEKY), pp. 321-322, Mezőgazda Kiadó, Budapest. (in Hungarian)
ARSHAD, M.A., LOWERY,B.,& GROSSMAN,B., 1996. Physical tests for monitoring soil quality. In: Methods for Assessing Soil Quality (eds J.W. DORAN & A J. JONES), pp. 123-141, Soil Science Society of America, Madison.
BAKER, A.S., KUO,S.,&CHAE, Y.M., 1981. Comparisons of arithmetic average soil pH values with the pH values of composite samples. Soil Science Society of America Journal. 45. 828-830.
BARAK, P., JOBE,B.O.,KRUEGER,A.R.,PETERSON,L.A.,&LAIRD, D.A. 1997. Effects of long-term soil acidification due to nitrogen fertilizer inputs in Wisconsin. Plant and Soil. 197. 61-69.BARANYAI, F., FEKETE,A.,&KOVÁCS, I. 1987. The results of soil nutrient content analyses in Hungary. Mezőgazdasági Kiadó, Budapest (in Hungarian).
BINKLEY, D., & P. SOLLINS. 1990. Factors determining differences in soil pH in adjacent conifer and alder-conifer stands. Soil Science Society of America Journal. 54.
1427-1433.
BLAKE, L. 2005. Acid rain and soil acidification. In: Encyclopedia of Soils in the Environment (ed. HILLEL, D.), Elsevier, Amsterdam.
BMNTÁ [Baranya County Soil Conservation and Plant Protection Agency]. 1989. AIIR database information for large operations’ agricultural plots. Unpublished database.
BMNTÁ, Pécs (in Hungarian).
BOLAN, N.S., ADRIANO, D.C., & CURTIN, D., 2003. Soil acidification and liming interactions with nutrient and heavy metal transformation and bioavailability.
Advances in Agronomy. 78. 215-272.
BOUMAN, O.T., CURTIN,D.,CAMPBELL,C.A.,BIEDERBECK,B.O.,&UKRAINETZ, H., 1995.
Soil acidification from long-term use of anhydrous ammonia and urea. Soil Science Society of America Journal. 59. 1488-1494.
BRAHY,V.,DECKERS,J.,&DELVAUX, B. 2000. Estimation of soil weathering stage and acid neutralizing capacity in a toposequence Luvisol–Cambisol on loess under deciduous forest in Belgium. European Journal of Soil Science. 51. 1-13.
BUZÁS, I., 1988. Handbook of Soil and Agrochemical Analytical Mehods 2. Mehods for Soil Physico-Chemical and Chemical Analysis. Mezőgazdasági Kiadó, Budapest (in Hungarian).
CONYERS, M.K., MUNNS, D.N., HELYAR, K.R., & POILE, G.J., 1991. The use of cation activity ratios to estimate the intensity of soil acidity. Journal of Soil Science. 42.
599-606.
D’AGOSTINO, R.B., & STEPHENS, M.A., 1986. Goodness-of-Fit Techniques. Marcel Dekker, New York.
ENGEL-DI MAURO, S. 2018. An eco-social approach to soil pH variability on cultivated land: A case study from the Drava River Floodplain. In: The Palgrave Handbook of Critical Physical Geography (ed. R. LAVE,C.BIERMANN, and S.LANE), Palgrave, New York.
FAGERIA,N.K.,BALIGAR,V.C.,&JONES,C.A. 1997. Growth and Mineral Nutrition of Field Crops. Marcel Dekker, New York.
HELYAR, K.R., & PORTER, W.M., 1989. Soil acidification, its measurement and the processes involved. In: Soil Acidity and Plant Growth (ed A.D.DOBSON), pp. 61-101, Academic Press, Sydney.
HELYAR, K.R., CREGAN,P.D.,&GODYN, D.L., 1990. Soil acidity in New South Wales – Current pH values and estimates of acidification rates. Australian Journal of Soil Research. 28. 523-537.
HO, R., 2006. Handbook of Univariate and Multivariate Data Analysis and Interpretation with SPSS. Chapman and Hall, Boca Raton.
KRASILNIKOV, P., ARNOLD,R.,&MICHÉLI, E., 2009. Soil classification of Hungary. In: A Handbook of Soil Terminology, Correlation and Classification (eds PAVEL KRASILNIKOV,JUAN-JOSÉ IBÁÑEZ MARTÍ,RICHARD ARNOLD, AND SERGHEI SOBHA), pp. 170-176, Earthscan, London.
LESTURGEZ, G., POSS,R.,NOBLE,A.,GRÜNBERGER,O.,CHINTACHAO,W.,&TESSIER, D.
2006. Soil acidification without pH drop under intensive cropping systems in Northeast Thailand. Agriculture, Ecosystems and Environment. 114. 239–248.
LOVÁSZ, G., 1977. The Physical Geography of Baranya County. Baranya Megyei Levéltár, Pécs (in Hungarian).
MÉMORSZÁGOS FÖLDÜGYI ÉS TÉRKÉPÉSZETI HIVATAL. 1983a. Magyar Népköztársaság, Baranya M.-Somogy M., 03 Sellye, 1:100000. Kártográfiai Vállalat, Budapest.
MÉMORSZÁGOS FÖLDÜGYI ÉS TÉRKÉPÉSZETI HIVATAL. 1983b. Magyar Népköztársaság, Baranya M.-Somogy M., 04 Siklós, 1:100000. Kártográfiai Vállalat, Budapest.
MSZ-08-0210. 1977. Determination of Soil Organic Carbon Content. Hungarian Standards Association, Budapest (in Hungarian).
MSZ-08-0205. 1978. Analysis of Soil Physical and Hydraulic Properties. Hungarian Standards Association, Budapest (in Hungarian).
MSZ-08-0206/2. 1978. Analysis of the Chemical Properties of Soils. Laboratory Investigations (pH, Alkalinity, Total Water Soluble Salt Content, Hydrolitic and Exchangable Acidity). Hungarian Standards Association, Budapest (in Hungarian).
MSZ-08-0214-1. 1978. Quantitative and Qualitative Determination of Cation Exchange Capacity in Soil. Hungarian Standards Association, Budapest (in Hungarian).
MSZ-08-0452. 1980. Use of High-Capacity Analyser Systems for Soils Analyses.
Quantitative Determination of Soil Organic Carbon Content in a Contiflo Analyzer System. Hungarian Standards Association, Budapest (in Hungarian).
MSZ-08-1722/3. 1989. Soil Analysis. Determination of Soluble Toxic Element and Heavy Metal Content in Soils. Hungarian Standards Association, Budapest (in Hungarian).
MSZ 20135. 1999. Determination of Soluble Nutrient Element Content in Soils. Hungarian Standards Association, Budapest (in Hungarian).
MSZ 21470-50. 2006. Soil Analysis for Environmental Protection. Determining Total and Soluble Content of Toxic Elements, Heavy Metals, and Chromium (VI). Hungarian Standards Association, Budapest (in Hungarian).
NELSON, P.N., & N. SU. 2010. Soil pH buffering capacity: a descriptive function and its application to some acidic tropical soils. Australian Journal of Soil Research. 48.
201-207.
OMSZ (Hungarian Meteorological Service), 2011. Rainfall data, 1996-2010, Farkasfa, Siófok. Unpublished database. OMSZ, Budapest (in Hungarian).
PONGRÁCZ, R., BATHOLY,J.,&KIS, A. 2014. Estimation of future precipitation conditions for Hungary with special focus on dry periods. Időjárás. 118. 305–321.
PORTER, W.M., MCLAY,C.D.A.,&DOLLING, P.J. 1995. Rates and sources of acidification in agricultural systems of southern Australia. In: Plant-Soil Interactions at Low pH:
Principles and Management (eds R.A.DATE,N.J.GRUNDON,G.E.RAYMENT,&M.E.
PROBERT), pp. 75-83, Kluwer Academic Publishers, Dordrecht.
PRASAD, R., & POWER, J.F., 1997. Soil Fertility Management for Sustainable Agriculture.
CRC Press, Boca Raton.
RICHTER, D.D., & MARKEWITZ, D. 2001. Understanding Soil Change. Soil Sustainability over Millennia, Centuries, and Decades. Cambridge University Press, Cambridge.
SKINNER, M.F., ZABOWSKI,D.,HARRISON,R.,LOWE, A., & XUE, D. 2001. Measuring the cation exchange capacity of forest soils. Communications in Soil Science & Plant Analysis. 32. 1751-1764.
STEFANOVITS, P., FILEP,G.,&FÜLEKY, G. 1999. Soil Science. Mezőgazda Kiadó, Budapest (in Hungarian).
SUMNER, M.E., 1998. Acidification. In: Methods for Assessment of Soil Degradation (eds R. LAL,W.H.BLUM,C.VALENTINE,&B.A.STEWART), pp. 213-228, CRC Press, Boca Raton.
SUMNER, M.E., NOBLE, A.D., 2003. Soil acidification: the world story. In: Handbook of Soil Acidity (ed Z.RENGEL), pp. 1-28, Marcel Dekker, New York.
TAN, K.H., 1996. Soil Sampling, Preparation, and Analysis. Marcel Dekker, New York.
TECATOR. 1984. Determination of Ammonia Nitrogen (ASN 65-32/84) or Nitrate Nitrogen (ASN 65-31/84) in Soil Samples Extractable by 2 M KCl Using Flow Injection Analysis. Application Notes. Tecator, Höganas, Sweden.
TIMM, N.H., 2002. Applied Multivariate Analysis. Springer, New York.
TRÁJER, A., BOBVOS, J., KRISZTALOVICS, K., & PÁLDY, A. 2013. Regional differences between ambient temperature and incidence of Lyme Disease in Hungary. Időjárás.
117: 175–186.
VAN BREEEMEN, N. 1991. Soil acidification and alkalinization. In: Soil Acidity (eds B. ULRICH and M.E. SUMNER), pp. 1-17, Springer Verlag, Berlin.
VAN BREEEMEN, N., & JORDENS, E.R., 1983. Effects of atmospheric ammonium sulphate on calcareous and non-calcareous soils of woodlands in The Netherlands. In: Effects of Accumulation of Air Pollutants in Forest Ecosystems (eds B. ULRICH &J.PANKRATH), pp. 171-182, D. Reidel, Dordrecht.
VAN BREEEMEN, N., MULDER,J.,&DRISCOLL, C.T., 1983. Acidification and alkalinization of soils. Plant and Soil. 75. 283-308.
VAN BREEEMEN, N., & WRIGHT, R.F., 2004. History and prospect of catchment biogeochemistry: A European perspective based on acid rain. Ecology. 85.
2363-2368.
VÁRALLYAY,G.,BUZÁSNÉ HARTYÁNYI,M.,MARTH,P.,MOLNÁR,E.,PODMANICZKY,G., SZABADOS,I.,SZABÓNÉ KELE,G., 1995. Soil conservation information and monitoring system. Volume 1. Methods. Földművelésügyi Minisztérium, Budapest (in Hungarian).
WHITTAKER, R.H., LIKENS, G.E., BORMANN, F.H., SICCAMA, T.G., 1979. The Hubbard Brook Ecosystem study: forest nutrient cycling and element behavior. Ecology. 60.
203-220.
Received: 18 Oct 2018 Accepted: 12 Sept 2019