2. High precision mapping and monitoring of inland excess water inundations
Zalán Tobak; Boudewijn van Leeuwen; Ferenc Kovács; József Szatmári
Introduction
In rainy periods, in endorheic areas excess water that does not disappear through infiltration or evapotranspiration, or upwelling groundwater fed by run-off from under the surface from areas located higher, manifests on the surface in the form of shallow inundations. This temporarily occurring inland excess water is the source of serious economic, environmental and social problems on the plains of the Carpathian Basin.
The mapping of inland excess waters is very important from 3 aspects: (1) it helps to understand the relationship between factors that contribute to the accumulation of inland excess water, (2) knowing the location and size of inland excess water inun- dations makes it possible to do operative work for drainage purposes and for pre- venting further damage, and (3) the location, size and scale of future inland excess water inundations can be forecasted, which can be of help in preventive processes (Szatmári and van Leeuwen, 2013).
Four general methods are used for mapping and monitoring inland excess water:
(1) field survey takes a lot of time, there can be many mistakes, it costs a lot of money and the resulting maps are often inaccurate. (2) By integrating the factors that contribute to the accumulation of inland excess water into a geographic infor- mation system (GIS), hazard maps can be made, but the inundations that have already occurred can’t be determined by using this method (Pálfai, 2003; Bozán et al., 2005; Bozán et al., 2009; Pásztor et al., 2014). (3) Complex models that describe the hydrological process of inland excess water formation require a large volume of data, therefore they can’t be used effectively on a regional scale. (4) Data collected using satellite or remote sensing technology provide information about a large area, paired with processing and evaluation methods that can be automated, offering an optimal solution for the regional level, operational mapping of inland excess water.
As part of utilising the latter approach, in the last 30 years several research pro- jects were realised using aerial photography (Licskó et al., 1987; Rakonczai et al., 2003; van Leeuwen et al., 2012), multispectral satellite images (Csornai et al., 2000;
Rakonczai et al., 2001; Mucsi and Henits, 2010, van Leeuwen et al., 2013) and hyper- spectral data (Csendes and Mucsi, 2016). In addition to passive, optical sensors, the applicability of active, radar data has also been proven (Csornai et al., 2000; Csekő, 2003; Gálya et al., 2016, Gulácsi and Kovács, 2019).
It was of great help in the operative use of satellite images that systems of Earth observation satellites had been built, with adequate spatial resolution (min. 10-30 m) and better revisit periods. Within the framework of the European Space Agency’s (ESA) Copernicus programme, the Sentinel satellites launched from 2014 onwards serve the needs of various fields of application, for instance in the form of providing multispectral and radar images (Malenovský et al., 2012). The active sensors of the Sentinel 1A and 1B satellites provide radar data regardless of the weather conditions, while the Sentinel 2A and 2B satellites gather multispectral data 2-3 times a week.
The work process that was developed as part of the Water@Risk project utilises satellite images from Sentinel 1 and Sentinel 2 to produce regional scale inland excess water maps in an operative way, on a weekly basis.
Study area and data
The study area of the Water@Risk project was 2 counties in the south Great Plain (Bács-Kiskun and Csongrád) and the Vojvodina province in Serbia. Topographic con- ditions, the low relief, climate conditions and the soil characteristics in these areas all set the stage for the accumulation of inland excess waters. The majority of the area is cultivated agricultural land, which means that the size of the economic dam- age done is often considerable.
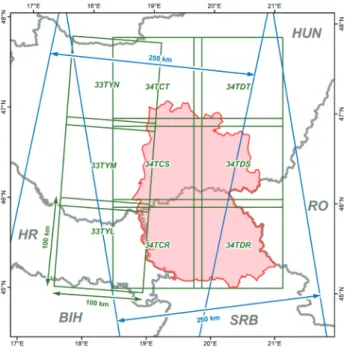
Three ascending swaths and 2 descending Sentinel 1 swaths, plus 9 Sentinel 2 tiles cover the full study area (Fig 2.1).
Figure 2.1 Sentinel 1 swaths (blue) and Sentinel 2 tiles (green) in the study area
The inland excess water maps are made using data from the Sentinel 1 and Sentinel 2 satellites.
Sentinel 1
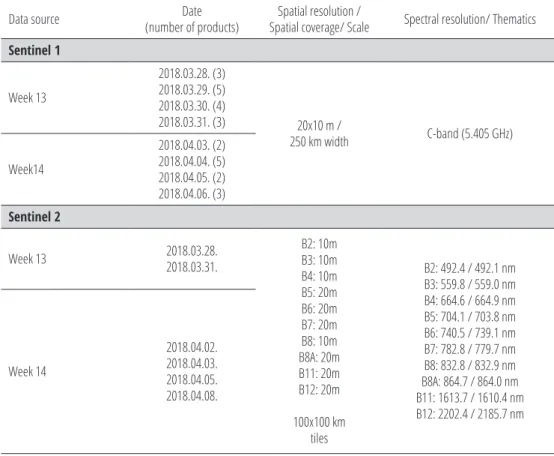
The radar based processing phase uses Sentinel 1A and 1B images. These two satel- lites provide a full coverage of the sampling area approximately every third day, and thanks to the C-band active remote sensing technology, they do it regardless of part of the day or weather conditions. Level-1 GRD products can be downloaded freely from the ESA servers – these constitute the input data. In the so-called Interferomet- ric Wide (IW) mode, the sensor produced a 20 x 10 m spatial resolution image with a 250 km swath of the surface (Malenovský et al., 2012). Data packages contain both the vertical-vertical (VV) and the vertical-horizontal (VH) polarisation layers, which were all utilised in the radar work process. In the present study we used Sentinel 1 data from the 26 March – 1 April 2018 period (week 13) and the 2 April – 8 April 2018 period (week 14) (Table 2.1).
Table 2.1: Summary parameters of the data utilised
Data source Date
(number of products) Spatial resolution /
Spatial coverage/ Scale Spectral resolution/ Thematics Sentinel 1
Week 13
2018.03.28. (3) 2018.03.29. (5) 2018.03.30. (4)
2018.03.31. (3) 20x10 m /
250 km width C-band (5.405 GHz)
Week14
2018.04.03. (2) 2018.04.04. (5) 2018.04.05. (2) 2018.04.06. (3) Sentinel 2
Week 13 2018.03.28.
2018.03.31.
B2: 10m B3: 10m B4: 10m B5: 20m B6: 20m B7: 20m B8: 10m B8A: 20m B11: 20m B12: 20m 100x100 km
tiles
B2: 492.4 / 492.1 nm B3: 559.8 / 559.0 nm B4: 664.6 / 664.9 nm B5: 704.1 / 703.8 nm B6: 740.5 / 739.1 nm B7: 782.8 / 779.7 nm B8: 832.8 / 832.9 nm B8A: 864.7 / 864.0 nm B11: 1613.7 / 1610.4 nm B12: 2202.4 / 2185.7 nm Week 14
2018.04.02.
2018.04.03.
2018.04.05.
2018.04.08.
Data source Date
(number of products) Spatial resolution /
Spatial coverage/ Scale Spectral resolution/ Thematics
Aerial photo 2018.03.28 10 cm / 20 km2 True-color (RGB)
CORINE Land Cover 1998 / 2018 1:50000 / 1:100000 Water bodies / Wetlands / Artificial Surfaces
High Resolution
Layers 2009-2015 20 m permanent and temporary water
and wetness Google Earth
(GeoEye / Pleiades) 2017-2018 0.41 / 0.5 m True-color (RGB)
OpenStreetMap various - Residental area, Road, Railway, Lake
and reservoir
Sentinel 2
The Sentinel 2A and 2B satellites acquire multispectral images with a 5-day return period. In the visible (VIS), near infrared (NIR) and shortwave infrared (SWIR) ranges altogether 13 bands are available, the spatial resolution of which is 10-20-60 m (Table 1). Level-2A products can be downloaded freely from the ESA servers in the form of 100x100 km tiles, and these store surface reflectance values that are free from atmospheric disturbances. In the work processes that are based on optical data, we used ten swaths of this data package (B2-B3-B4-B5-B6-B7-B8-B8A-B11-B12), plus the so-called scene classification layer that contains cloud cover information too. As part of the present research, we processed images produced by Sentinel 2 on 28 and 31 March 2018 and on 2, 3, 5 and 8 April 2018 (Table 2.1).
Supplementary data
Both the radar and the optical image based workflows require supplementary data.
These play a role in the teaching of algorithms as a reference, and they also make corrections in the resulting inland excess water map by masking those areas where inland excess water – per definition – can’t occur. The open water surfaces that con- stitute the reference data set originate from the 1:50000 and 1:100000 scale CORINE Land Cover, and the permanent water surfaces (Büttner et al., 2014) of Pan-European high resolution layers (High Resolution Layers - HRS), which were updated and made more accurate with the help of high resolution images from Google Earth (Table 1).
The mask data set contains urban areas, artificial surfaces of agricultural land, roads, railway lines, lakes and rivers – and the latter’s floodplains marked off by the dikes – plus the watery habitats, which were extracted from the CORINE and OpenStreetMap databases. At the beginning of the processing, those areas were excluded which – based on the cloud mask layer – were covered by clouds or cloud shadows.
Aerial photos
We collected aerial remote sensing data for the validation of the results. We used sensors mounted on a Cessna 172 single-engine aircraft and on an eBee X fixed- wing drone: 60 MP resolution PhaseOne P65+, and 20 MP senseFly S.O.D.A. RGB cameras, plus a 1.2 MP resolution Parrot Sequoia+ multispectral sensor. Aerial photography was performed in a selected part of the full study area, North East of Szentes on approximately 20 km2, on 28 March 2018, with a 10 cm spatial resolu- tion. An ortophoto mosaics were made from the individual photos.
Methodology
The methodology of the inland excess water inundation mapping presented here consists of pre-processing and processing stages. In the latter there is a radar algo- rithm and two algorithms based on multispectral images, from the results of which a binary inland excess water map is created after an integration phase. Since the methodology can be automated, it can be used in an operational way, and although it doesn’t classify different types of inland excess water into type categories, it can be used to provide inland excess water inundation information on a weekly basis, with medium spatial resolution (10 m).
Pre-processing
In the pre-processing stage OpenSearch API and OpenData API are used to auto- matically download Sentinel 1 GRD and Sentinel 2 L2A products for the study area from the ESA servers.
Sentinel 1 radar images require complex geometric and radiometric pre-process- ing, which involves radiometric calibration, noise filtering, correction of distortion resulting from surface topography and sideways-looking imaging geometry, plus the so-called angle of incidence must also be corrected (van Leeuwen et al. 2017). The 10x10 m pixels of the raster data sets acquired this way store the backscattering values in dB.
Sentinel 2 optical data are downloaded partly pre-processed (Level2A), storing surface reflectance. From the 13 imaging bands, 10 bands are extracted and resa- mpled into standard 10 m resolution. In each satellite image we masked the areas covered by different types of clouds and cloud shadows. We utilised the scene clas- sification layer for this, which was contained in the downloaded data package.
In the case of both data sources, we narrowed down processing for those areas only that are at the risk of inland excess water accumulation (Pálfai, 2003).
The pre-processing of satellite images was done using the ESA SNAP (Sentinel Application Platform) software, by means of running models.
196 WATER@RISK | www.geo.u-szeged.hu/wateratrisk
Processing
Threshold value based evaluation of radar data
Using the reference layer showing open water surfaces, we extracted the basic sta- tistical data of water covered land areas (minimum, maximum, average and standard deviations of dB values) from the VV and VH swaths. By utilising these, we defined threshold values that designate open waters. As the backscattering of radar signals from the water surface – with the assumption that there are no waves – is lower than from other surfaces, the method presumes that there is water cover in the images at pixels below the threshold value.
Automatic classification of multispectral data
ISODATA classification was performed on the Sentinel 2 images, the resulting classes were compared with the average spectra of the reference areas. Spectral similar- ity was calculated based on the angle differences measured in the 10 dimensional spaces marked out by the 10 imaging bands (Kruse et al., 1993); then we ranked the classes and those that showed the smallest deviation – the ones where the similarity level was the largest – and assigned water cover labels. In this case again, the result was a binary (water cover / no water cover) inland excess water map.
Spectral index calculation
Using the multispectral images, MNDWI (Modified Normalized Differential Water Index) was calculated, for which the visible green (B3) and a shortwave infrared (B11) bands were utilised (Equations 1 and 2) (Xu, 2005). We defined threshold values on the index map, with the help of the basic statistical data of the index values calcu- lated for the reference areas, which were suitable for designating the areas covered with water. The result of this work phase was also a binary inland excess water map.
Spectral index calculation
Using the multispectral images, MNDWI (Modified Normalized Differential Water Index) was calculated, for which the visible green (B3) and a shortwave infrared (B11) bands were utilised (Equations 1 and 2) (Xu, 2005). We defined threshold values on the index map, with the help of the basic statistical data of the index values calculated for the reference areas, which were suitable for designating the areas covered with water. The result of this work phase was also a binary inland excess water map.
𝑀𝑀𝑀𝑀𝑀𝑀𝑀𝑀𝑀𝑀 =
(()*++,- (./01)*++,2 (./01
(Eq. 1)
which, by using the bands of Sentinel 2, develops as follows:
MNDWI
Sentinel-2= (3
rdswath – 11
thswath) / (3
rdswath + 11
thswath) (Eq. 2)
Integration
In the last step we integrated the binary maps resulting from the radar phase and the multispectral work phase. The number of these maps is determined by the number of satellite images available and processable in the examined period of time. This way a reliability parameter can also be assigned to the integrated inland excess water inundation maps, defining the proportion of water cover in a given image, based on all the available input data and on the processing work phase.
Validation
For the validation of the inland excess water inundation maps we utilised the inland excess water patches extracted from the aerial data collection. In the nearly 20 km
2area we used the cross-tabulation method to evaluate the relationship between the on-site observed water cover and the water cover predicted by the processing series of steps.
Results
Inland excess water maps
In the spring of 2018 there was significant inland excess water inundation in the sampling area. Here, the inland excess water maps for 2 selected weeks (week 13: 29 March – 1 April 2018, week 14: 2 April – 8 April 2018) will be presented, generated based on the images
(Eq. 1) which, by using the bands of Sentinel 2, develops as follows:
MNDWI Sentinel-2 = (3rd swath – 11th swath) / (3rd swath + 11th swath) (Eq. 2)
Integration
In the last step we integrated the binary maps resulting from the radar phase and the multispectral work phase. The number of these maps is determined by the num- ber of satellite images available and processable in the examined period of time.
This way a reliability parameter can also be assigned to the integrated inland excess water inundation maps, defining the proportion of water cover in a given image, based on all the available input data and on the processing work phase.
Validation
For the validation of the inland excess water inundation maps we utilised the inland excess water patches extracted from the aerial data collection. In the nearly 20 km2 area we used the cross-tabulation method to evaluate the relationship between the on-site observed water cover and the water cover predicted by the processing series of steps.
Results
Inland excess water maps
In the spring of 2018 there was significant inland excess water inundation in the sampling area. Here, the inland excess water maps for 2 selected weeks (week 13:
29 March – 1 April 2018, week 14: 2 April – 8 April 2018) will be presented, generated based on the images transmitted by the Sentinel satellites (Figure 2). During week 13 altogether 42 (15+27), during week 14 exactly 33 (12+21) products were processed.
In order to increase the reliability of the results, only those images were consid- ered to be indicative of water cover, in which the processing algorithms detected a minimum 40% percent inland excess water inundation water rate.
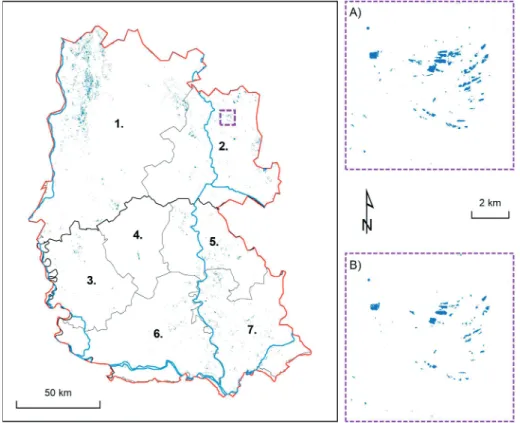
In the whole area 17,800 ha and 10,990 ha water cover was detected. The most affected parts were the northwest of Bács-Kiskun county – where mostly natural watery habitats were detected – and the areas along the river Tisza, in both Hungary and Serbia, where mainly the cultivation of arable land was threatened by inland excess water inundations. As regards the time, it can be observed that the size of inundated areas decreased a little by week 14 (Fig 2.2).
Figure 2.2 Inland excess water in the study area at the end of March / beginning of April in 2018 (1. Bács-Kiskun, 2. Csongrád, 3. West Bačka, 4. North Bačka, 5. North Banat, 6. South Bačka,
7. South Banat)
Validation
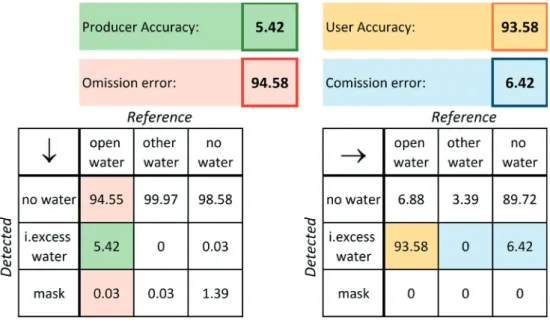
The reference data used for the validation of the method are from the aerial pho- tography campaign that took place on 28 March 2018 (week 13). Based on the val- ues we obtained from the cross-tabulation, 93.6% of the inundations detected by the work phase indicate actual patches of inland excess water (user accuracy, true positive), the proportion of overestimation was only 6.4% (commission error, false positive) (Table 2.2). However, it must be noted that – mainly due to the different resolutions of input data and the on-site imaging, plus because of the subjective factors in creating the reference map – only 5.4% of the reference inland excess water patches could be displayed in the result layer. This means that the level of underestimation (omission error, false negative) is very high.
Table 2.2 Results of the inland excess water map’s validation, based on the measurements on week 13
Discussion and conclusion
The developed methodology for detecting inland excess water processes radar and multispectral satellite imagery to provide inundation information on a weekly basis.
Each stage of the work process can be automated, therefore the method is suita- ble for operational use too. As for the limitations of the method, they are primarily rooted in the characteristics of input data: (1) the spatial resolution of the resulting map doesn’t exceed the spatial resolution of input data (max. 10 m), which means that the identification of only those patches is possible that are maximum one scale larger than this. (2) In the case of using optical data, the cloud cover is the biggest in those periods when inland excess waters occur, so very often a lack of data made it impossible to cover the whole area. (3) The strengths of reflected radar signals show great variation in the case of water surfaces with different levels of rough- ness – turbulent water vs. calm water – so the precise definition of the threshold values applied is difficult to give. Surface cover and soil type also have considerable influence on the intensity of the radar sign from the inland excess water that accu- mulated at a given spot.
The method doesn’t differentiate between dry soil, open inland excess water, the vegetation standing in the water and the soil saturated with water, so on the result- ing binary map only the open water surface and dry soil surface categories appear.
In order to be able to identify vegetation standing in the water and soil saturated with water, we need further input data, the integration of which would require lots of resources and could also limit the automation of the work process.
We need to make progress in the fields of acquiring more accurate threshold values in the radar processing method and their calibration for areas with different land covers and soils. Many challenges have also remained in increasing the accu- racy of the cloud masking of multispectral images. If we manage to achieve these goals in the future, the overestimation of inland excess water areas can be reduced further.
It is also necessary to improve the validation methodology: we must engage in on-site and aerial data collection for the days when satellite imagery is available, and we must also ensure the standardisation of interpreting aerial photos.
With the help of the developed method, it becomes possible to map inland excess water inundations regularly, in large areas – at regional or even national level – which is suitable for operational use as a result of automation.
Summary
Earlier inland excess water mapping methods used to rely on the on-site measure- ments from a given point in time, or on aerial or satellite imagery. In this project we developed a method that can be used for permanent monitoring of inland excess water over large areas, with operational use. The radar and optical satellite images that became available in the last few years have a resolution that is getting closer and closer to the spatial and time scales of the inland excess water phenomenon, by this creating new opportunities and challenges at the same time. The maps resulting from the automated work process can contribute to the damage preventing and mitigating work of the national water management authorities and they can supple- ment or adjust the results of the on-site measurements that are performed up to the present day.