Assessing Available Water Content of Sandy Soils to Support Drought Monitoring and Agricultural Water Management
Zsuzsanna Ladányi1 &Károly Barta1&Viktória Blanka1 &Benjámin Pálffy1
Received: 27 January 2020 / Accepted: 21 December 2020/
#The Author(s) 2021
Abstract
In the future, according to regional climate-model simulations, the Carpathian Basin (in Central Europe) is predicted to be exposed to intensifying weather extremes that will exert a growing pressure on water resources. In recent past decades, water already has become a significant limiting factor for the natural environment and many agro-economic sectors in the southern Carpathian Basin. Therefore, there are increasing attempts to develop monitoring systems to detect water stress. In this study, changes in soil moisture conditions were monitored within two Arenosol profiles of extreme water balance during years characterised by different hydrologic conditions and under the impact of irrigation in the Great Hungarian Plain. Hourly data series of hydrometeorological parameters and soil moisture from six different soil depths during 2014–2018 were provided by on-site monitoring stations; humus, carbonate content, porosity, field capacity and wilting point were measured in the laboratory. On the basis of the newly definied so-called‘available water percent’(AW%) and a developed classification method, the rate, time and duration of water-shortage periods were evaluated for the years 2014–2018. The results show that drought monitoring cannot be effective without investigation of soil moisture content.
Detailed analysis of available water percentage (AW%) can be used for real-time drought monitoring and as a precise indicator of the evolution of drought. This can help us prevent and manage damage from drought, and it is extremely important for agriculture.
Keywords Drought . Monitoring . Soil moisture . Available water
https://doi.org/10.1007/s11269-020-02747-6
* Zsuzsanna Ladányi ladanyi@geo.u–szeged.hu
1 Department of Physical Geography and Geoinformatics, University of Szeged, Egyetem u. 2-6, Szeged H-6722, Hungary
Published online: 27 January 2021
these parameters and indicate an increased likelihood of droughts (IPCC2018, Spinoni et al.
2018). These changes directly influence water resources availability, thereby causing increased water stress of land-surface ecosystems and managed systems and also increasing the com- plexity of water scarcity management (Iglesias et al.2007). The use of monitoring data can be a very promising measure to support water scarcity management, such as by making it possible to irrigate only the fields that are under water stress (Iglesias et al.2018). Knowledge gained from monitoring soil moisture can help mitigate the consequences of drought, potentially yielding great economic and societal benefits (Ochsner et al.2013).
Soil moisture can be monitored byin situand proximal sensing techniques, soil moisture remote sensing missions, soil moisture monitoring networks, and applications of large-scale monitoring measurements (Ochsner et al. 2013). Field-based measurement methods using portable or stationary sensors include gravimetry, neutron-probe metrics, time-domain reflec- tometry and other dielectric permittivity (Bilskie2001). Assessment of satellite-derived soil- moisture data dating back to the 1970s is possible by an increasing number of available data sources and improving data resolution, and it has advantages but also several challenges and limitations such as are encountered when downscaling and validating relatively coarse- resolution remotely sensed soil moisture products to describe spatial variability (Ochsner et al.2013, Srivastava2017, Zhou et al.2020). Of high importance for monitoring hydrologic conditions for vegetation is the amount of available water (AW) for plants, which is estimated as the difference between water content at field capacity (FC) and wilting point (WP) (Kirkham2005). Although plants can extract water through the full range of AW, stress can occur before reaching the WP (Datta et al.2017). Yields can be reduced before the WP is reached, indicating that the water is not equally available between the FC and WP. The percentage of the total AW that may be safely depleted before moisture stress occurs is the management-allowable depletion (Ley et al.1994). The point where yields start to decrease varies by crop type (Taylor1952). Increased soil organic-matter content leads to increased soil- moisture availability (Hatfield2007).
According to regional climate-model simulations, the Carpathian Basin is predicted to be exposed to intensifying weather extremes as a consequence of climate change exerting increasing pressure on water resources (Bartoly et al.2008, Krüzselyi et al. 2011, Blanka et al.2013, Mezősi et al.2016). In natural ecosystems and in many agro-economic sectors in the southern Carpathian Basin, because water has already become a limiting factor (Pálfai and Herczeg2011, Fiala et al.2014, Mezősi et al.2016), efficient water use is crucial to relieve harmful consequences. The development of systems for monitoring different parameters to detect extreme hydrological situations and water stress is being attempted on several scales in Europe (e.g., Vogt2011, Bucur et al.2018, Tigkas et al.2020). For agriculture, information on soil moisture as well as temperature and precipitation conditions is important given that even at 70–80-cm-depth soil can get extremely dried out and influence vegetation growth. Instead, of
providing volumetric water content, the calculation of appropriately selected soil moisture indices and anomalies can effectively support the agricultural stakeholders. Effective crop production aims to optimise irrigation time and the amount of applied water to prevent losses and conserve water resources (Datta et al.2017).
The aim of this study has been to analyse the effects of changes in soil moisture conditions on Arenosols, formed from blown sand in the Great Hungarian Plain and characterised by an unfavourable soil moisture regime. These soils are highly exposed to fluctuating weather conditions, and, owing to their high permeability, they tend to dry out rapidly in drought periods; thus the impact of water shortage is relatively temporary. Using a classification of AW content of the soil, we evaluated the rate, time and duration of water shortage for the period 2014–2018 and assessed its efficiency for integration with an online monitoring system.
The degree of a drought is characterised not only by meteorological parameters and measured soil moisture data but also by the relation between soil moisture and significant points along the pF curve. The novelty of this research is the indicator of this connection as available water percentage (AW%), that was AW%, which we tested on long-duration datasets of sandy soils to provide the basis for a complex management system (Fiala et al.2018). AW%
is able to determine the status of the actual soil moisture compared to WP and FC. This study concerns only sandy soils, but the assessment can be extended to other soil textures, and how different soils behave under drought conditions could be compared objectively.
2 Study Area and Methods
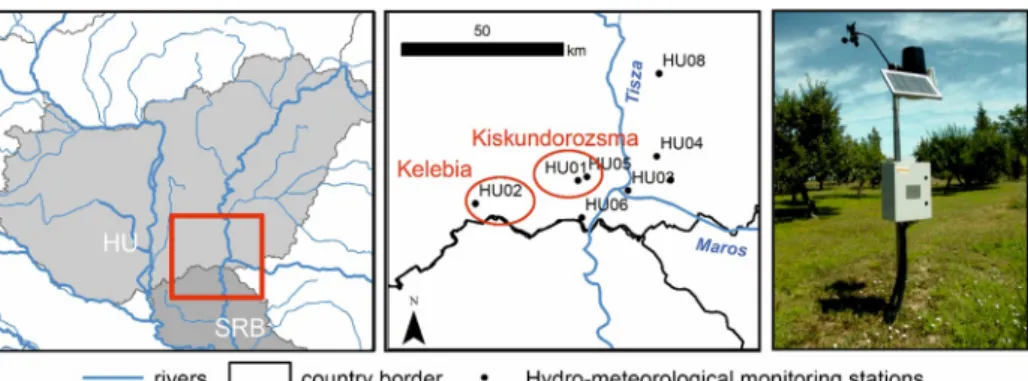
We investigated water availability for agriculture during 2014–2018 in two study areas in southern Hungary (in Kelebia and Kiskundorozsma) where Arenosols had developed from windblown sands (Fig.1). They belong to the Köppen-Cf or Trewartha-D.1 climate zones and are characterised by an annual mean temperature of ~ 11 °C and annual precipitation of 500– 600 mm. In July, the hottest month, the mean temperature is in the range ~ 21 °C–23 °C, and total precipitation for the summer half-year is ~ 300 mm. In past decades, these areas were hit by severe droughts about every three to five years (e.g., 2000, 2003, 2007, 2012, 2015) (Spasov et al. 2002, Djordjević 2008, Fiala et al. 2014), and due to the low water-storage capacity of sandy soils, agriculture is exposed to severe challenges. In an earlier survey, farmers and decision makers in the region indicated concern about the adverse effects of drought and emphasised the significant role of sandy soils and the lowered groundwater table (Blanka et al.2017).
Both stations are on unnatural grasslands that are regularly managed by mowing. The grassland in the Kelebia study area was rainfed during 2014–2018, whereas in the Kiskundorozsma area, it was regularly irrigated during 2014–2015 and was rainfed during 2016–2018. The Kelebia station is on the Danube–Tisza Interfluve and at a higher elevation (120m ASL) compared to the Kiskundorozsma station (79m ASL). The groundwater table was deeper than 2 m below the surface in the Kelebia case throughout the investigated period, whereas in the case of Kiskundorozsma, the groundwater (or capillary zone) could reach the subsoil in humid years.
The soil moisture data used in this study were provided by a hydrometeorological station network installed in 2014 (Fig.1) as part of the WAHASTRAT project (Barta et al.2014), which yields soil moisture data from six different depths (10, 20, 30, 45, 60 and 75 cm). The operation of the applied soil-moisture sensor (EC-5) is based on hourly measurements of soil
dielectric permittivity, which has a known relationship to soil moisture (v/v%). The stations also measure precipitation (mm), air temperature (°C), air humidity (%), average wind power (m/s) and wind direction. We calculated daily averages from the available hourly data for the period 2014–2018. (The dataset was almost continuous; data gaps were due to technical problems.)
Soil properties as humus (%), carbonate content (%) and porosity were measured in the laboratory (Barta et al.2014). FC and WP were measured from undisturbed soil samples from each soil horizon using an Eijkelkamp Sand-/kaolinbox. For FC, the measured pF2 value was applied, and for WP, the value pF4.2 was used. The infiltration and drying-out processes were monitored on soil profiles of extreme water balance in years that experienced different hydrological conditions.
For monitoring and characterising drought, the basic question always concerns where is the soil moisture positioned between FC and WP. In this study available water percentage (AW%) is defined by
AW%¼SMWP
FCWP100; ð1Þ
whereAW% is available water percentage (%),SMis the measured volumetric soil moisture (v/v%),WPis wilting point (v/v%) andFCis field capacity (v/v%).
Water shortage occurs in the soil when AW% < 80%. (100% AW% equals FC.) Table1 shows rate of water shortage in the soil classified into moderate, high and extreme classes based on ranges of AW%. The classification thresholds were confirmed by previous research in the field. According to Datta et al. (2017), at AW% < 50%, crops such as maize and cereals experience water stress and potential growth reduction (consequently yield reduction). When AW% < 30%, it is difficult for plant roots to extract water from soil (Dunay and Kalmár1993).
Fig. 1 Location of soil moisture network in Hungary (HU) and two study areas (Kelebia HU02 and Kiskundorozsma HU01)
Table 1 Classification of water shortage in soil based on available water percentage (AW%)
AW% Rate of water shortage
50–80% Moderate water shortage
30–50% High water shortage
< 30% Extreme water shortage
When AW% < 20%, the plants die because water is no longer available for them; instead, it is linked more to soil particles (Dunay and Kalmár1993).
Using this classification, the time and durations of water-shortage periods were evaluated for the period 2014–2018. Drying-out and infiltration processes in the soil profile can also be studied by the soil moisture data from six depths. By comparing soil moisture and precipitation data, the relation between precipitation and soil moisture changes can be identified.
By multiplying the thickness of the given soil layer by the difference between FC and actual soil moisture, we estimated water scarcity (mm) and summarised the water deficit for the whole 80-cm soil profile:
WD¼XFCSM
100 10t; ð2Þ
whereWDis the soil-water deficit for the investigated soil profile (mm),FCis field capacity (v/v%),SMis the actual soil moisture (v/v%) measured in the field, andtis the thickness of the soil layer related to the given sensor in cm (10 or 15 cm, depending on the density of sensors).
Thus, quantification of water scarcity was done by calculating the necessary infiltration (mm) to reach FC. Because the upper sensors in the area are at 10-cm distances and the lower ones are at 15-cm distances, 1 and 1.5 mm of precipitation would need to infiltrate for a 1-v/v%
moisture increase.
The differences in soil properties and management between the two study areas were quantified by duration curves for both soil profiles. The water-shortage curve shows the duration when a certain AW% level is exceeded (expressed as percentage of a given time period). On the curves, water scarcity conditions exist toward the right; the lowest values (at the extreme right) may represent extreme water scarcity or data failure due to frost.
To determine drought conditions, the duration and timing of high and extreme water shortage in the soil profile was evaluated. We determined the number of days when soil- water shortage was high or extreme during the whole investigated profile, calculated their duration as a percentage of the vegetation period and compared their timing across the investigated years.
3 Results
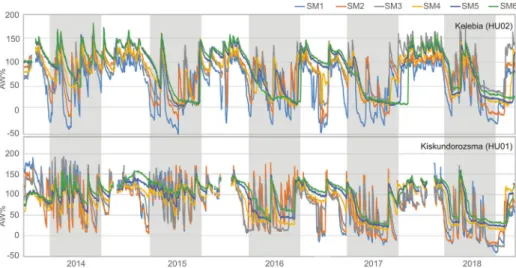
The AW% varied within −50–200% in the soil profiles of the two investigated stations (Fig.2). In Kelebia (HU02), because the only source of water was rainfall, the upper extreme generally is < 150%, and only rarely it is in the range 150–170%. However, the upper two sensors experience extremely dry conditions and show more frequent fluctuations compared to the subsoil sensors, which show steadier water-condition changes. When we compared consecutive years, only 2014 could be characterised by somewhat-favourable soil moisture during the vegetation period, given that soil moisture increases several times while the upper- soil sensors are reaching the critical values owing to the more frequent rains and while the subsoil sensor values are generally fluctuating around the FC. In all the other investigated years, extreme water scarcity is characteristic for a significant portion of the vegetation period, especially as measured by the subsoil sensors. We observed that water mostly reached only the upper 20–30 cm during the experienced rainfalls; also, subsoil sensors are near the WP after the first two months of the vegetation period and thus cannot help the vegetation survive.
Severe drought conditions result in extreme (or even negative) AW%, which means soil moisture under WP in the data series. However, extremely low AW% values in a dataset may have been caused by winter anomalies as well as by drought. The best example of such a winter anomaly was soil frost that occurred in a transition period during 2016–2017 and was readily observable in both the Kelebia (HU02) and the Kiskundorozsma (HU1) data.
In the case of the Kiskundorozsma (HU01) study site, AW% values have varied within
−50–200%, thus in a wider range than Kelebia (HU02). A major difference between the datasets of the two study areas is the impact of irrigation during 2014–2015. In Kiskundorozsma, because soil-water household was improved daily by irrigation, we find hardly any evidence of a long-lasting extreme water shortage in the soil profile. Instead, the subsoil sensors were almost saturated (or even oversaturated) several times, which might mean that groundwater could be another reason for the constantly higher values.
Furthermore, during 2016–2018, when there was no extra water supply from irrigation, subsoil sensors often showed higher values and steadier water conditions compared to the upper-soil sensors. Without input from irrigation, these periodic changes possibly were caused by the seasonal lowering of the capillary zone (groundwater table). During 2016–
2018, Kiskundorozsma’s AW% pattern for the upper-soil sensors were similar to Kelebia’s (as a result of the rainfall source).
When the AW% classification is applied to show the water-shortage rate in the soil profile, the exposure of the vegetation periods becomes readily observable. Figure3 represents the infiltration of rainwater in the soil profile in Kelebia (HU02), and it is clearly visible how water shortage evolves in the subsoil layers in almost all vegetation periods. Because neither groundwater nor capillary water reaches the subsoil layers, soil moisture becomes only minimally available for vegetation for most of the period. According to the summarised soil-water shortage in the investigated soil profile, in the vegetation periods > 50 mm is missing from the soil, which can hardly be refilled by single rain events. Therefore, agriculture (and the inhabitants) in the study area (and also in the wider region with Arenosols) become
Fig. 2 Available water percentage (AW%) during 2014–2018 in Kelebia (HU01) and Kiskundorozsma (HU02) based on soil moisture sensors. [Grey bands represent April–September vegetation period]
really vulnerable to the extreme water conditions. Up to the FC, this soil is able to store 90mm moisture in Kelebia (HU02). It means that within the investigated period in this case one third of the storable water (up to FC) could be reached in a period of drought.
The impact of irrigation on the soil-water household is readily observable in Fig.4in the case of the Kiskundorozsma (HU01) station during 2014–2015: The upper soil and subsoil were saturated enough or slightly influenced by water shortage in the vegetation period, and there were only very short periods that could be problematic for vegetation. During 2016–
2018, as a result of the lack of irrigation, the upper soil experienced extreme water shortage,
Fig. 3 Daily precipitation (mm) and soil-water shortage at different depths through entire investigated soil profile in Kelebia (HU02) [WS, water shortage]
Fig. 4 Daily precipitation (mm) and soil-water shortage at different depths through entire investigated soil profile in Kiskundorozsma (HU01)
but the subsoil was characterised by higher soil moisture content in the spring and early summer due to capillary water. However, toward the end of summer, extreme water shortage was observed in the investigated profile. According to the summarised soil-water shortage based on the profile, it remained within 0–50 mm during 2014–2015 in the vegetation period.
However, based on the 2016–2018 data, the water from the soil profile reached and maintained 50 mm until the end of the vegetation period, comparable to the Kelebia site. Up to the FC, the Kiskundorozsma (HU01) soil was able to store 72mm moisture, which meant that within the investigated period 10% of the storable water (up to FC) was accessible during the drought period. However, comparing the two Arenosols shows higher vulnerability in Kiskundorozsma (HU01). The difference between the soils is the humus content of the upper soil (0–10 cm), which is higher (2.5%) in case of HU02 compared to HU01 (< 1%); this difference influences water retention, as humus content helps the soil particles retain water.
The differences between the two stations that are due to the irrigation at HU01 are evident in the separate duration curves for the two time periods (2014–2015 and 2016–2018) (Fig.5).
In the rainfed Kelebia (HU02) station, the order of the sensors is almost the same in drought
Fig. 5 Duration curves for Kelebia (HU02) and Kiskundorozsma (HU01) for periods 2014–2015 (A and C) and 2016–2018 (B and D) representing non-irrigated period for both stations. Horizontal axis represents duration (days) when soil moisture was higher than percentage shown. Blue, yellow, and red horizontal lines indicate AW% classification representing water-shortage rate [AW%, available water percentage; SM, soil moisture]
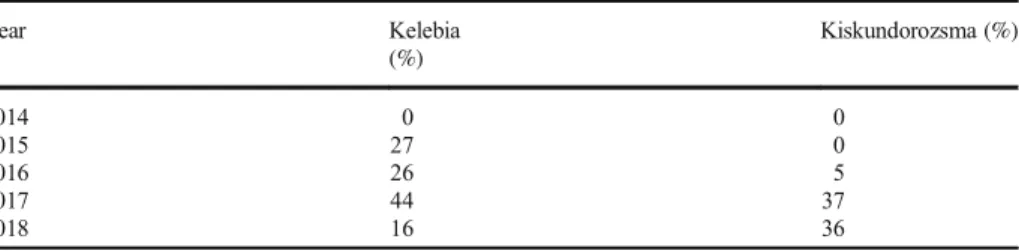
Table 2 Percentage of days in vegetation period (1 April through 30 September) when all soil layers experienced high or extreme water shortage
Year Kelebia
(%)
Kiskundorozsma (%)
2014 0 0
2015 27 0
2016 26 5
2017 44 37
2018 16 36
and wet years. The topsoil generally dries earlier than the subsoil, and in drought years (second time period) the subsoil also shows longer water-shortage periods, thus the sensors of the upper soils and subsoils show less difference. In the years when irrigation was applied (in the case of HU01), the normal order of the duration curves changed, and the upper sensors showed the highest AW contents. In years without irrigation, the order of the sensors is similar for the two areas, and the lowest sensors show higher wetness for longer periods. These data assume downward water input, but the soil may get wet by capillary rise. Also, the values near or below zero may reflect either soil frost or extreme drought.
The duration and timing of high and extreme water shortage in the soil profile are important for determining drought conditions. Based on the AW% dataset and the applied classification (Table2), the most favourable year was 2014, when no high or extreme water shortage was characteristic in the soil profile within the vegetation period. In all other investigated years (Fig. 6), shorter and longer periods of high or extreme water shortage in the soil could be observed. In 2015, in the Kelebia soil profile high and extreme water shortages were observed during more than 25% of the vegetation period. Because this dry year was compensated in the Kiskundorozsma case by irrigation, no days occurred when the whole profile was under high or extreme water shortage. The 2017 vegetation period was the most affected, as the Kelebia profile faced high and extreme water shortage in almost half of the vegetation period, and the Kiskundorozsma profile also faced high or extreme water shortage in 36% of the vegetation period. Water was missing from the whole soil profile for long periods in the cases of rainfed sandy soil, which affected all types of plants and crops. Because the longer water-shortage period in the whole soil profile was shifted to the second part of the vegetation period in 2018, those plants that require water in spring and early summer could survive; however, the long dry period significantly affected plants or other crops.
Fig. 6 Timing of high and extreme water-shortage periods in investigated years (x axis: months)
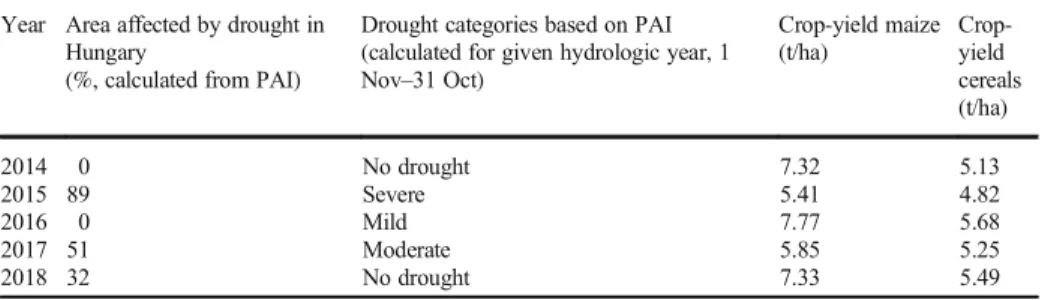
Table 3 Parameters characterising annual spatial extent of drought for Hungary (HCSO2019), rate of drought calculated for investigated stations (ATIVIZIG2019), and crop yields of maize and cereals (two major crops grown in southern Hungary) (HCSO2019)
Year Area affected by drought in Hungary
(%, calculated from PAI)
Drought categories based on PAI (calculated for given hydrologic year, 1 Nov–31 Oct)
Crop-yield maize (t/ha)
Crop- yield cereals (t/ha)
2014 0 No drought 7.32 5.13
2015 89 Severe 5.41 4.82
2016 0 Mild 7.77 5.68
2017 51 Moderate 5.85 5.25
2018 32 No drought 7.33 5.49
scale crop-yield data (Table3) highlight only the extremes of 2015 and 2017, which tends to mask territorial vulnerability. The crop yield of maize falls to < 6 t/ha in cases of moderate and severe drought, whereas it is > 7 t/ha in normal years.
According to our investigations, 2015 was hit by an extreme drought, but owing to the higher AW in the soil as a result of the previous humid year, the period of high and extreme water shortage started later, thereby mitigating early spring conditions for the vegetation. This confirms that soil moisture is an essential parameter to characterise drought conditions.
In this study, total water shortage (mm) in the soil profile was given for both profiles, but the data are not comparable without the detailed knowledge of the soil parameters, given that they highly influence plant-water uptake. The introduced classification of water shortage in the soil may better support agrarian water management. Because the rate and frequency of drought is predicted to increase and summer precipitation is expected to decrease in the future (Bartoly et al. 2008), the exposure of sandlands will increase and agricultural production without effective irrigation systems may be impossible.
As our study reflected, drought monitoring cannot be effective without monitoring of soil- moisture content. Based on this method, a new national drought-monitoring system was put in place in Hungary starting in 2016. The novelty of this system is that the applied drought index (Hungarian Drought Index, HDI) can distinguish between different soil types even under the same meteorological conditions (Fiala et al.2018). Detailed analysis of AW can be used in real-time drought monitoring and can precisely indicate the evolution of drought differentiated by various soil types, which can help us manage or prevent damage from drought. The installed complex monitoring stations already exceeded 100 in 2020, and the provided data form the basis of daily updated drought information for the whole country (ODWMS2020).
Acknowledgements Open Access funding provided by University of Szeged. The paper is OA funded by the University of Szeged Open Access Fund, Grant Number: 4578. The research was supported by the Interreg-IPA Cross-border Cooperation Programme Hungary-Serbia and co-financed by the European Union (IPA) under the project HUSRB/1602/11/0057 entitled WATERatRISK.
Author Contributions All authors contributed to the study conception and design. Material preparation, data collection and analysis were performed by Zsuzsanna Ladányi, Károly Barta, Viktória Blanka and Benjámin Pálffy. The first draft of the manuscript was written by Zsuzsanna Ladányi and all authors commented on previous versions of the manuscript. All authors read and approved the final manuscript.
Funding The paper is OA funded by the University of Szeged Open Access Fund, Grant Number: 4578. The research was supported by the Interreg-IPA Cross-border Cooperation Programme Hungary-Serbia and co- financed by the European Union (IPA) under the project HUSRB/1602/11/0057 entitled WATERatRISK.
Data Availability The authors confirm that the data supporting the findings of this study are available within the article or could be requested from the corresponding author, upon reasonable request.
Compliance with Ethical Standards
Conflicts of interest/Competing Interests The authors have no conflicts of interest to declare that are relevant to the content of this article.
Ethical Approval Not applicable.
Consent to Participate Not applicable.
Consent to Publish Not applicable.
Open AccessThis article is licensed under a Creative Commons Attribution 4.0 International License, which permits use, sharing, adaptation, distribution and reproduction in any medium or format, as long as you give appropriate credit to the original author(s) and the source, provide a link to the Creative Commons licence, and indicate if changes were made. The images or other third party material in this article are included in the article's Creative Commons licence, unless indicated otherwise in a credit line to the material. If material is not included in the article's Creative Commons licence and your intended use is not permitted by statutory regulation or exceeds the permitted use, you will need to obtain permission directly from the copyright holder. To view a copy of this licence, visithttp://creativecommons.org/licenses/by/4.0/.
References
ATIVIZIG (2019) Lower-Tisza District Water Directorate. Hydrological database for stations, Available at:
https://www.ativizig.hu/. Accessed 13 Dec 2020
Barta K, Crnojevic VB, Blanka V, Ladányi Zs, Fiala K, Vukobratovic D (2014) Possibilities of field measure- ment of soil moisture. In: Blanka V, Ladányi Zs (eds) Drought and water management in South Hungary and Vojvodina. University of Szeged, Szeged, pp 308–311
Bartholy J, Pongrácz R, Gelybó G, Szabó P (2008) Analysis of expected climate change in the Carpathian Basin using the PRUDENCE results Időjárás 112:249–264
Bilskie J (2001) Soil water status: content and potential. Campbell Scientific, Inc.https://s.campbellsci.com/
documents/us/technical-papers/soilh20c.pdf. Accessed 12 Nov 2020
Blanka V, Mezősi G, Meyer B (2013) Changes in the drought hazard in Hungary due to climate change. Időjárás 117:219–237
Blanka V, Ladányi Z, Szilassi P, Sipos Gy, Rácz A, Szatmári J (2017) Public perception on hydro-climatic extremes and water management related to environmental exposure, SE Hungary. Water Resour Manag 31:
1619–1634.https://doi.org/10.1007/s11269-017-1603-z
Bucur A, GregoričG, Grlj A, KokaljŽ, Sušnik A (2018) Tool for drought monitoring in the Danube region– methods and preliminary developments. J Environ Geol 11:67–75.https://doi.org/10.2478/jengeo-2018- 0014
Chaves MM, Costa JM, Madeira Saibo NJ (2011) Recent advances in photosynthesis under drought and salinity.
In: Turkan, I. (Ed.) Plant responses to drought and salinity stress. Developments in a Post-Genomic Era.
Advances in Botanical Research 57:49–104
Datta S, Taghvaeian S, Stivers J (2017) Understanding soil water content and thresholds for irrigation manage- ment. Oklahoma Cooperative Extension Service, BAE-1537 1–8.https://doi.org/10.13140/RG.2.2.35535.
89765
DjordjevićSV (2008) Temperature and precipitation trends in Belgrade and indicators of changing extremes for Serbia. Geographica Pannonica 12:62–68
Dunay S, Kalmár E (1993) A talajvízszint szerepe a talajok vízháztartásában. Éghajlati és agrometeorológiai tanulmányok sorozat. Országos Meteorológiai Szolgálat, Budapest, pp 43–84
Fiala K, Blanka V, Ladányi Z, Szilassi P, Benyhe B, Dolinaj D, Pálfai I (2014) Drought severity and its effect on agricultural production in the Hungarian-Serbian cross-border area. J Environ Geol 7:43–51.https://doi.org/
10.2478/jengeo-2014-0011
Fiala K, Barta K, Benyhe B, Fehérváry I, Lábdy J, Sipos Gy, Győrffy L (2018) Operatív aszály-és vízhiánykezelőmonitoring rendszer. Hidrológiai Közlöny 98:14–24
Kirkham MB (2005) Principles of soil and plant water relations. Elsevier Academic Press, Cambridge, 520 p Krüzselyi I, Bartholy J, Horányi A, Pieczka I, Pongrácz R, Szabó P, Szépszó G, Torma C (2011) The future
climate characteristics of the Carpathian Basin based on a regional climate model mini-ensemble. Adv Sci Res 6:69–73.https://doi.org/10.5194/asr-6-69-2011
Ley TW, Stevens RG, Topielec RR, Neibling WH (1994) Soil water monitoring and measurement. A Parcific Northwest Publication, Washington State University. PNW0475. http://irrigation.wsu.edu/Content/Fact- Sheets/Soil-Monitoring-and-Measurement.pdf. Accessed 12 Nov 2020
Mezősi G, Blanka V, Bata T, Ladányi Zs, Kemény G, Meyer BC (2016) Assessment of future scenarios for wind erosion sensitivity changes based on ALADIN and REMO regional climate model simulation data. Open Geosci 8:465–477.https://doi.org/10.1515/geo-2016-0033
ODWMS (2020) Operational drought and water scarcity management system. Available online at:https://
aszalymonitoring.vizugy.hu/index.php?lang=eng. Accessed 13 Dec 2020
Ochsner TE, Cosh MH, Cuenca RH, Dorigo WA, Draper CS, Hagimoto Y, Kerr YH, Larson KM, Njoku EG, Small EG, Zreda M (2013) State of the art in large-scale soil moisture monitoring. Soil Sci Soc Am J 77:
1888–1919.https://doi.org/10.2136/sssaj2013.03.0093
Pálfai I, Herceg Á (2011) Droughtness of Hungary and Balkan Peninsula. Riscuri si Catastrofe 9:145–154 Spasov P, Spasov D, Petrović P (2002) Changes in drought occurrences in Serbia. In: Proceedings of
International Conference on Drought Mitigation and Prevention of Land Desertification. Bled, Slovenia, 21–25 April 2002. International Commission on Irrigation and Drainage (ICID): Ljubljana, Slovenia. (CD- ROM)
Spinoni J, Naumann G, Vogt JV (2017) Pan-European seasonal trends and recent changes of drought frequency and severity. Glob Planet Chang 148:113–130.https://doi.org/10.1016/j.gloplacha.2016.11.013
Spinoni J, Vogt JV, Naumann G, Barbosa P, Dosio A (2018) Will drought events become more frequent and severe in Europe? Int J Climatol 38:1718–1736.https://doi.org/10.1002/joc.5291
Srivastava PK (2017) Satellite soil moisture: review of theory and applications in water resources. Water Resour Manag 31:3161–3176.https://doi.org/10.1007/s11269-017-1722-6
Taylor SA (1952) Use of mean soil moisture tension to evaluate the effect of soil moisture on crop yields. Soil Sci 74:217–226.https://doi.org/10.1097/00010694-195209000-00004
Tigkas D, Vangelis H, Tsakiris G (2020) Implementing crop evapotranspiration in RDI for farm-level drought evaluation and adaptation under climate change conditions. Water Resour Manag 34:4329–4343.https://doi.
org/10.1007/s11269-020-02593-6
Vicente-Serrano SM, Lopez-Moreno J-I, Beguería S, Lorenzo-Lacruz J, Sanchez-Lorenzo A, García-Ruiz JM, Azorin-Molina C, Morán-Tejeda E, Revuelto J, Trigo R, Coelho F, Espejo F (2014) Evidence of increasing drought severity caused by temperature rise in southern Europe. Environ Res Lett 9(4):044001.https://doi.
org/10.1088/1748-9326/9/4/044001
Vogt JV (2011) The European Drought Observatory. Proceedings Article published Apr 2011 in 2011 GEOSS Workshop XL - Managing Drought through Earth Observation.https://doi.org/10.1109/geoss.2011.5948940 Zhou Y, Dong X, Chen H, Cao L, Shao Q, Sun S, Yang B, Rao J (2020) Sub-seasonal variability of surface soil
moisture over eastern China. Clim Dyn 55:3527–3541.https://doi.org/10.1007/s00382-020-05464-3
Publisher’s Note Springer Nature remains neutral with regard to jurisdictional claims in published maps and institutional affiliations.
![Fig. 3 Daily precipitation (mm) and soil-water shortage at different depths through entire investigated soil profile in Kelebia (HU02) [WS, water shortage]](https://thumb-eu.123doks.com/thumbv2/9dokorg/961837.56786/7.659.72.590.78.388/daily-precipitation-shortage-different-investigated-profile-kelebia-shortage.webp)