Research Article
The role of water and compression in the genesis of alkaline basalts:
Inferences from the Carpathian-Pannonian region
I. Kovács
a,b,⁎ , L. Patkó
a,c,d, N. Liptai
a, T.P. Lange
a,c, Z. Taracsák
a,e, S.A.P.L. Cloetingh
b,f, K. Török
g, E. Király
g, D. Karátson
h, T. Biró
g, J. Kiss
h, Zs. Pálos
b, L.E. Aradi
c, Gy. Falus
c, K. Hidas
i, M. Berkesi
a,c, A. Koptev
j, A. Novák
a,b, V. Wesztergom
b, T. Fancsik
g, Cs. Szabó
b,caMTA CSFK Lendület Pannon LitH2Oscope Research Group, Sopron, Hungary
bCSFK Geodetic and Geophysical Institute, Sopron, Hungary
cEötvös University, Department of Petrology and Geochemistry, Lithosphere Fluid Research Lab, Budapest, Hungary
dInstitute for Nuclear Research, Isotope Climatology and Environmental Research Centre, Debrecen, Hungary
eUniversity of Manchester, Department of Earth and Environmental Sciences, Manchester, UK
fUtrecht University, Tectonics Research Group, Utrecht, Netherlands
gMining and Geological Survey of Hungary, Budapest, Hungary
hEötvös University, Department of Physical Geography, Budapest, Hungary
iInstituto Andaluz de Ciencias de la Tierra, CSIC-UGR, Granada, Spain
jUniversity of Tübingen, Department of Geosciences, Tübingen, Germany
a b s t r a c t a r t i c l e i n f o
Article history:
Received 2 June 2019
Received in revised form 25 November 2019 Accepted 4 December 2019
Available online 10 December 2019
We present a new model for the formation of Plio-Pleistocene alkaline basalts in the central part of the Carpathian-Pannonian region (CPR). Based on the structural hydroxyl content of clinopyroxene megacrysts, the‘water’content of their host basalts is 2.0–2.5 wt.%, typical for island arc basalts. Likewise, the source region of the host basalts is‘water’rich (290–660 ppm), akin to the source of ocean island basalts. This high‘water’con- tent could be the result of several subduction events from the Mesozoic onwards (e.g. Penninic, Vardar and Magura oceans), which have transported significant amounts of water back to the upper mantle, or hydrous plumes originating from the subduction graveyard beneath the Pannonian Basin.
The asthenosphere with such a relatively high‘water’content beneath the CPR may have been above the
‘pargasite dehydration’(b90 km) or the‘nominally anhydrous’ (N90 km) solidi. This means that neither decompressional melting nor the presence of voluminous pyroxenite and eclogite lithologies are required to ex- plain partial melting.
While basaltic partial melts have been present in the asthenosphere for a long time, they were not extracted dur- ing the syn-rift phase, but were only emplaced at the onset of the subsequent tectonic inversion stage at ~8–5 Ma.
We propose that the extraction has been facilitated by evolving vertical foliation in the asthenosphere as a re- sponse to the compression between the Adriatic indenter and the stable European platform. The vertical foliation and the prevailing compression effectively squeezed the partial basaltic melts from the asthenosphere. The over- lying lithosphere may have been affected by buckling in response to compression, which was probably accompa- nied by formation of deep faults and deformation zones. These zones formed conduits towards the surface for melts squeezed out of the asthenosphere.
This implies that basaltic partial melts could be present in the asthenosphere in cases where the bulk‘water’con- tent is relatively high (N~200 ppm) at temperatures exceeding ~1000–1100 °C. These melts could be extracted even under a compressional tectonic regime, where the combination of vertical foliation in the asthenosphere and deep fractures and deformation zones in the folded lithosphere provides pathways towards the surface.
This model is also valid for deep seated transpressional or transtensional fault zones in the lithosphere.
© 2019 The Author(s). Published by Elsevier B.V. This is an open access article under the CC BY-NC-ND license (http://creativecommons.org/licenses/by-nc-nd/4.0/).
Keywords:
Alkaline basalts
Carpathian-Pannonian region Asthenosphere
Lithosphere Deformation Melting Water
1. Introduction
The genesis of the Plio-Pleistocene alkaline basalts in the Carpathian-Pannonian region (CPR) is still a controversial topic. This is mainly because the paroxysm of alkaline basaltic volcanic activity
⁎ Corresponding author at: MTA CSFK Lendület Pannon LitH2Oscope Research Group, Sopron, Hungary.
E-mail address:kovacs.istvan.janos@csfk.mta.hu(I. Kovács).
https://doi.org/10.1016/j.lithos.2019.105323
0024-4937/© 2019 The Author(s). Published by Elsevier B.V. This is an open access article under the CC BY-NC-ND license (http://creativecommons.org/licenses/by-nc-nd/4.0/).
Contents lists available atScienceDirect
Lithos
j o u r n a l h o m e p a g e :w w w . e l s e v i e r . c o m / l o c a t e / l i t h o s
(~ 5–2 Ma) post-dated the main phase of extension (~17–11 Ma) in the CPR. The latter phase was not associated with this type of volcanic activ- ity, instead massive areal calc-alkaline magmatism took place at this time (Horváth, 1993; Horváth et al., 2006, Seghedi et al., 2004;
Pécskay et al., 2006;Szakács et al., 2018). The extension is generally considered capable of producing basaltic melts due to decompressional melting (e.g.Embey-Isztin et al., 1993). The timing of the onset of alka- line basaltic volcanic activity is enigmatic, coinciding with the collision of the main tectonic units with the stable European platform in the Carpathian embayment at ~11 Ma (e.g.Matenco et al., 2003). This means that the onset of alkaline basaltic volcanic activity generally took place in the post-rift phase after the cessation of extension and ac- tive subduction along the Carpathians. Even more interestingly, the par- oxysm of alkaline basaltic volcanic activity is coeval with the onset of tectonic inversion in the CPR at ~8–5 Ma (e.g.Bada et al., 2007;Balázs et al., 2016). Consequently, alkaline basalts were produced mainly in a compressional tectonic regime, which is usually considered unfavourable for basalt genesis.
Volatiles, especially‘water’(if not otherwise specified, the term
‘water’refers to all hydrous species in rocks: H+, OH−and H2O), have an unprecedently large impact on the physical properties of rocks and melts at temperatures and pressures typical for the upper mantle (i.e., conductivity, anisotropy, effective viscosity and seismic velocity, see Kovács et al., 2018 for a review). In this paper within the term
‘water’, we also distinguished structural hydroxyls, which are hydrogen ions (H+) attached to oxygens occupying different crystallographic sites in nominally anhydrous minerals (referred to as NAMs for short) forming hydroxyl groups. Note that both the‘water’and structural hy- droxyl concentrations in melts and NAMs are expressed in molecular water (H2O) equivalent either in ppm (wt.) or wt.%. respectively.
In particular,’water’significantly lowers the solidus temperature of upper mantle peridotites (Green et al., 2010). However, such informa- tion on the concentration of‘water’in the asthenospheric source of alka- line basalts in the CPR is not yet available (e.g.Harangi et al., 2015;
Seghedi et al., 2004). Consequently, without this piece of information it may be rather challenging to understand why partial melting could have occurred in the upper mantle. Recentfindings have demonstrated that at depths shallower than 100 km (~3 GPa) of the upper mantle the solidus is the‘pargasite dehydration solidus’at ~1050–1150 °C (~150 °C lower than previously anticipated) (Kovács et al., 2017) even at very low bulk‘water’contents (~200 ppm) typical for the MORB upper man- tle (Dixon et al., 1988;Saal et al., 2002). This is due to the stability of pargasitic amphibole even at such low bulk‘water’concentrations (Green et al., 2010, 2014;Kovács et al., 2012a, 2017). At deeper levels in the upper mantle (N90 km), the solidus temperature is mainly con- trolled by the concentration of structural hydroxyl in NAMs among other variables such as pressure, oxygen fugacity and bulk composition.
The effect of structural hydroxyls on the solidus can be taken into ac- count by different melting models (Hirschmann et al., 2009;Katz et al., 2003). These models seem to be consistent in the sense that the depression of the solidus temperature with respect to the dry solidus is ~150 °C lower when there is ~500 ppm bulk structural hydroxyl in the upper mantle peridotite. The presence of pyroxenite and eclogite li- thologies in the upper mantle are also known to lower the solidus tem- perature with respect to the‘dry solidus’(e.g.Hirschmann and Stolper, 1996;Lambart et al., 2016;Rosenthal et al., 2014). So far, however, no detailed quantitative analysis has been undertaken to estimate the con- tribution of such lithologies to melting in the asthenosphere.
The two main goals of our study are:
(1.) To provide thefirst estimate on the structural hydroxyl content in the source region of alkaline basalts from the Bakony–Balaton Highland Volcanic Field (BBHVF) in the central CPR. To this pur- pose, the structural hydroxyl content of co-genetic clinopyroxene megacrysts was analysed by micro-FTIR spectrometry. From this, the‘water’content of the host basaltic melt and its source region
is approximated using experimentally determined partition coef- ficients and the empirically constrained degree of partial melting (seeXia et al., (2013)for the details of the applied methodology).
(2.) Assuming that melt is present in the asthenosphere, a model is presented for how and why this melt was extracted from the as- thenosphere in the tectonic inversion/compressional stage of the CPR. Regional seismic anisotropy data, lattice preferred orienta- tion of upper mantle xenoliths, the concept of lithospheric- scale folding, the direction of geomagnetic induction vectors and focal mechanisms of earthquakes in the central Pannonian Basin provide additional support for the model.
In addition, we quantitatively estimate the contribution of pyroxe- nite and eclogite lithologies to the formation of alkaline basaltic melts in the upper mantle using bulk major and trace element compositions of alkaline basalts in the CPR with a focus on‘fingerprint’elements such as Mn, Fe, Zn, Co, and Ni (Le Roux et al., 2011).
2. Geological background and previous models for alkaline basaltic volcanic activity in the CPR
A brief overview on the genesis of Plio-Pleistocene alkaline basalts in the CPR is provided below, as this topic has been covered in great detail in previous studies (e.g.Ali et al., 2013;Ali and Ntaflos, 2011;Embey- Isztin et al., 1993;Harangi et al., 2015;Kereszturi et al., 2010, 2011;
Németh et al., 2001;Seghedi et al., 2004;Szabó et al., 1992). The follow- ing main alkaline basaltic volcanicfields are located in the CPR from west to east: Styrian Basin (SBVF); Burgenland; Little Hungarian Plain (LHPVF); Bakony–Balaton Highland (BBHVF); Nógrád-Gömör (NGVF) and Perşani Mts. (PMVF) (Fig. 1). In these volcanic areas basaltic pyro- clastic successions (Szentbékkálla, BBHVF) and effusive basalts building up lava plateaus (Medves, NGVF) or small shield volcanoes (Kab Mt., BBHVF) occur as well. Furthermore, there are several smaller isolated occurrences of alkaline basalts in the CPR at Kecel,Štiavnica and Lucareţ. The basaltic activity started at ~11 Ma at the western margins of the CPR (Burgenland) and lasted till sub-recent times atŠtiavnica (few hundred ka;Balogh et al., 1981;Chernyshev et al., 2013) with the main phase of volcanism taking place between 5 and 2 Ma (Pécskay et al., 2006;
Wijbrans et al., 2007). Since the PMVF is generally younger than the other localities (b2 Ma) and situated on a geodynamically distinct part of the CPR outside the Pannonian Basin (e.g.Harangi et al., 2013;
Seghedi et al., 2004, 2016), its detailed investigation is beyond the scope of our study.
The earliest models (e.g.Embey-Isztin et al., 1993;Szabó et al., 1992) proposed that the basaltic activity was generated in the post- extensional phase during the period of thermal relaxation. The thermal relaxation led to the cooling and contraction of the asthenospheric dome creating deep fractures in the overlying lithosphere, which channelled melts from the partially molten asthenosphere to the sur- face. While this model seems to provide a reasonable explanation for how the melt may have been extracted from the asthenosphere, it fails to explain why and how partial melting occurred in the cooling as- thenospheric dome. In addition, it is difficult to reconcile how deep frac- tures were‘opened up’in the subsiding lithosphere over the thermally shrinking asthenospheric dome in a compressional tectonic regime when both the lithosphere and asthenosphere were under compression between the Adriatic indenter and the stable European platform.
In subsequent papers,Wilson and Downes (2006)andSeghedi et al.
(2004)argued that deep thermal plumefingers may exist under the major volcanicfields in the CPR. This scenario was ruled out by Harangi and Lenkey (2007)andHarangi et al. (2015). Their studies demonstrated that the upper mantle beneath the volcanicfields is ther- mally not anomalous (i.e. shows potential temperatures typical for am- bient mantle: ~1300–1450 °C) which is at least 100 °C lower than what
would be considered characteristic for mantle plumes (e.g.Green and Falloon, 2005). As recently shown by seismic tomography, there is a
‘graveyard’of subducted slabs beneath the CPR (Dando et al., 2011;
Hetényi et al., 2009) where remnants of previously subducted rocks are accumulated at the mantle transition zone between ~410 and
~660 km. This also makes the existence of deep-rooted thermal plume (s) (fingers) rather unlikely beneath the CPR, as plumes wouldfirst have to penetrate these slab remnants before rising to the shallower levels of the upper mantle. During the last decade, seismic tomography has provided increasing evidence for the existence of‘baby plumes’ris- ing from depth levels from 670 to 440 km in the upper mantle underly- ing western and central Europe (Ritter and Christensen, 2007).
Harangi et al. (2015)has recently proposed that asthenosphericflow could also be responsible for melting in the asthenosphere beneath the CPR. In their model, asthenosphericflow is induced at locations where the lithosphere-asthenosphere boundary is steep by‘thin spot’suction of the extending lithosphere. The thinned lithosphere exerts suction on the ambient asthenosphere and promotes itsflow into the CPR from beneath the surrounding areas, especially from the Alps and the Bohemian Massif. These authors point out that thisflow might occur in particular along the relatively steep lithosphere-asthenosphere boundary at the western and northern edges of the CPR. The driving force for melting is assumed to be decompression in the uprising as- thenosphere. This model, however, raises several questions concerning space and time. Most importantly, there is obviously a problem with the timing as the main phase of the extension (syn-rift phase) in the south- western and eastern part of the CPR ceased at ~11 and ~8 Ma,
respectively (Horváth et al., 2006;Márton and Fodor, 2003). The parox- ysm of the alkaline basaltic volcanic activity in the CPR occurred
~5–2 Ma, which is considerably younger than the supposed‘thin spot’ suction generated by the thinning of the lithosphere. During‘thin spot’suction the extension of the lithosphere and the uprise of the un- derlying asthenosphere should be simultaneous. While this‘thin spot’ model was argued to account for the formation of all but the PMVF ba- salts, there are alkaline basalts in the LHPVF and BBHVF (and smaller oc- currences in the central Pannonian Basin) (Fig. 1), which are distant from locations with a steep lithosphere-asthenosphere boundary (LAB,Horváth, 1993). It follows that even if the‘thin’spot model was true, it would fail to explain the genesis of alkaline basalts in these cen- tral locations where the LAB is relativelyflat. It is possible, however, that the formation of the oldest alkaline basalts in Burgenland where the syn-rift stage was almost coeval with the timing of the eruptions and where the lithosphere-asthenosphere boundary is indeed steep, may be explained by this‘thin spot’model.
Further uprising of the asthenosphere following the syn-rift stage also seems unlikely. In fact, it is more probable that following the syn- rift stage the lithosphere may have started thickening immediately as the asthenospheric dome began to cool. During this thermal relaxation, the uppermost part of the asthenospheric dome was gradually con- verted into new and juvenile lithosphere. This‘lithospherisation’pro- cess is discussed in detail byKovács et al. (2012b, 2017)and its main driving force is that at lower temperatures (b1050 °C) the pargasitic amphibole becomes a stable mineral phase in the upper mantle. This hydrous chain silicate (containing ~2 wt.% H2O) lowers the activity of Fig. 1.Schematic geological map of the Carpathian-Pannonian region (CPR) with location of main alkaline basaltic localities (BBHVF: Bakony-Balaton Highland Volcanic Field; LHPVF: Little Hungarian Plain Volcanic Field; NGVF: Nógrád-Gömör Volcanic Field; PMVF: Perşani Mts. Volcanic Field; SBVF: Styrian Basin Volcanic Field). The map is modified afterKovács et al.
(2012b). Abbreviations for major faults are (with bold italic): PF–Periadriatic fault, BF–Balaton fault.
‘water’and incorporates freefluids and melts (Green et al., 2010, 2014;
Kovács et al., 2012a, 2017). The consequent (partial) disappearance of fluids and melts (e.g.Berkesi et al., 2019) and the decreasing solubility of structural hydroxyl in NAMs of the upper mantle (Kang et al., 2017) both increase the effective viscosity of the upper mantle, making it rhe- ologically stronger (e.g.Dixon et al., 2004;Li et al., 2008). Thus, the ther- mal relaxation following the main phase of extension is not favourable for melt formation and preservation in the cooling asthenospheric dome. Based on upper mantle peridotite xenoliths,Kovács et al.
(2012b)concluded that in the central part of the CPR (BBHVF), the lith- osphere may have thickened from its‘original’40 km thickness at the end of the syn-rift stage to ~60 km at the time of the alkaline basaltic volcanic activity.
In summary, previous models do not appear to provide a compre- hensive and self-consistent explanation for the genesis of Plio- Pleistocene alkaline basalts in the CPR, raising the need for alternative explanations. Key questions remain on the cause for melting in the as- thenosphere and on the mode of melt extraction. Below we present a new conceptual model based on the estimated‘water’content in the as- thenospheric source of alkaline basalts and deformation in the lithosphere-asthenosphere system during the tectonic inversion stage of the CPR.
3. Constraining the‘water’content in the source of alkaline basalts from the BBHVF
3.1. Selecting suitable samples
In recent years it has become a common practice to estimate the
‘water’content in the source region of alkaline basalts based on the structural hydroxyl content in their co-genetic and geochemically prim- itive clinopyroxene megacrysts (e.g.Liu et al., 2015;Xia et al., 2013). It is widely accepted that these clinopyroxenes form at the very early stage of crystallization, and consequently they are expected to be in equilib- rium with pristine, near liquidus basaltic melts.Demouchy et al.
(2006)andPeslier and Luhr (2006)demonstrated that basaltic melts usually reach the surface within a few tens of hours, and, thus, if the size of the megacrysts is large the chance for structural hydroxyl loss is limited. The size of the selected megacrysts is several centimetres in diameter.
In our present study, the structural hydroxyl concentrations of 5 clinopyroxene megacrysts from Szentbékkálla and Szigliget (both from BBHVF) reported byKovács et al. (2016)were found to be suitable for this methodology from a larger pool of available megacrysts. These clinopyroxenes are primitive enough in composition (high mg#:
N0.75) and display no chemical zonation or any evidence for syn- or post-eruptive structural hydroxyl loss.Liu et al. (2015)demonstrated, based on modelling of magma evolution, that clinopyroxenes with mg# higher than 0.75 can still be a relatively reliable source of informa- tion (within 30%) for the host magma regarding its original‘water’con- tent. In addition, primitive mantle (PM) normalised trace element patterns of the selected clinopyroxenes in the rare earth element (REE) (Fig. 2a) and spider (Fig. 2b) diagrams are very similar to colourless megacrysts described for the BBHVF byJankovics et al.
(2016). All clinopyroxenes show enrichment in light and middle REE with respect to the heavy REE (Fig. 2a), and light REE are relatively de- pleted compared to middle REE. In the spider diagram (Fig. 2b), clinopyroxenes are mostly depleted in Ba, Th, Nb, Pb and Cr with respect to the PM and show negative anomalies for Ba, Nb, Pb, Sr, Zr and Cr.
Jankovics et al. (2016)argued that the colourless megacryst is the early product of fractional crystallization representing a near-liquidus phase.
In addition, the selected clinopyroxenes also show similarity in the REE and spider diagrams (Fig. 2) to some clinopyroxenes from cumu- lates (Kovács et al., 2004) and clinopyroxene megacrysts in alkaline ba- salts from the NGVF (Dobosi and Jenner, 1999). The latter are also
interpreted to represent products of very early stage fractional crystallisation. These latter samples, however, sometimes display slightly higher trace element concentrations than those from the BBHVF. Furthermore, the light REE are not or only slightly depleted compared to middle REE (Fig. 2a) and Th and U are considerably enriched (Fig. 2b).
InKovács et al. (2016), all but the‘Szigliget cpx1’clinopyroxene have high mg# (N75) indicating that they are primitive in composition and in equilibrium with the host basalt in the early stage of its crystallisation.
‘Szigliget cpx1’has, however, much lower mg# (~58) and its structural hydroxyl content is also lower (285 ppm). This implies that this clinopyroxene might have formed in a more advanced stage in the evo- lution of the basaltic magma, by which time the melt may have suffered some degassing. For this reason, only clinopyroxenes with higher mg#
(76–81) were selected for the calculation of the‘water’content of the primitive basaltic melts (e.g.Chen et al., 2015, 2017;Liu et al., 2015). Among the samples with sufficiently high mg#, however, clinopyroxene samples from the Kapolcs locality were also omitted be- cause of their appreciably lower structural hydroxyl contents and anomalous infrared spectra. The lower structural hydroxyl concentra- tion and the anomalous infrared spectra (seeFig. 1inKovács et al., 2016) may refer to pre-, syn- or post-eruptive modification of the orig- inal structural hydroxyl contents of clinopyroxenes in equilibrium with their host alkaline basalts (Patkó et al., 2019) which could be due to sev- eral factors including decreasing‘water’activity, annealing or oxidation.
In case of the Kapolcs clinopyroxenes, the annealing at low‘water’activ- ity appears to be the most plausible explanation as these crystals are originated from basaltic lava rocks, whereas those from Szigliget and Szentbékkálla are from basaltic pyroclasts (e.g.Jankovics et al., 2012).
This means that the Kapolcs lava rocks may have cooled more slowly staying at higher temperatures for a longer period of time which may have facilitated to reach equilibrium quicker at low‘water’activities (Lloyd et al., 2016). Absorption bands correspond to different substitu- tion mechanisms of structural hydroxyl into clinopyroxene which all have their characteristic stoichiometry (e.g.Tollan et al., 2017for oliv- ine). As different stoichiometries do have different dependences on water activity, this also affects the relative contributions of the differ- ent bands in NAMs with changing water activity. Clinopyroxenes displaying their maximum absorption bands at the higher and lower wavenumbers are typical for higher and lower‘water’activity, respec- tively (Patkó et al., 2019). Consequently, clinopyroxenes crystallised in the early stage of fractional crystallisation at high pressure (and there- fore higher‘water’activity prior to significant degassing) should have their maximum bands at the highest wavenumbers, whereas for those crystallised later at lower pressure or after considerable degassing the maximum band is expected to appear at lower wavenumber.
The two clinopyroxenes from Kapolcs have only 97–112 ppm of structural hydroxyl, whereas those selected from Szentbékkálla and Szigliget are in the range of 391–476 ppm (seeTable 1inKovács et al., 2016). In addition, in the Kapolcs clinopyroxenes, the intensity of the 3520 cm−1absorption band is predominant, whereas the 3625 cm−1 band is almost invisible. This is in contrast with the‘general’trend shown by other clinopyroxenes in equilibrium with their environment, where the ~3630 cm−1band is the most intensive and the other bands at lower wavenumbers show gradually lower absorbance (Aradi et al., 2017;Bonadiman et al., 2009;Ferriss et al., 2016;Kovács et al., 2012a;
Pintér et al., 2015;Sundvall and Stalder, 2011;Weis et al., 2015).
In summary, great care must be taken when selecting suitable clinopyroxene grains for estimating the‘water’content in their equilib- rium basaltic melt. The geochemistry, infrared spectra and structural hydroxyl content of clinopyroxenes, as well as their pre- and post- eruptive history must be examined to ensure that their structural hy- droxyl concentration represents equilibrium conditions with their host melt. The structural hydroxyl contents of clinopyroxenes are deter- mined from unpolarised micro-FTIR spectrometry (seeKovács et al., 2016for details of the analytical technique) and are accurate within
15% (Table 1). The measured concentration range defined by the suit- able clinopyroxenes from Szentbékkálla and Szigliget is rather narrow from 391 to 476 ppm implying homogenous‘water’concentration in their parental melt.
3.2.‘Water’content of the parental melt
In the second step, the ‘water’content of the basaltic melt in equilibrium with the selected clinopyroxenes can be calculated using the composition dependent partition coefficient of O'Leary et al. (2010). The partition coefficient can be calculated using Equa- tion (10) inO'Leary et al. (2010) which includes the Al(IV)and Ca cation fractions of clinopyroxenes and depends mainly on the Al(IV) content (Eq.1):
lnDcpxH −melt
2O ¼−4:2þ6:5∙Xcpx
AlIV−1∙XcpxCa ð1Þ
note that Al(IV)is calculated as (Eq.2):
IVAl3þ¼1 2
XAl3þ−Naþ
ð2Þ
As partition coefficients do not depend strongly on pressure and temperature, abandoning these factors has only negligible effect on the partition coefficient. The cation numbers are calculated based on the major element compositions of clinopyroxenes provided in Table 1(extracted from Supplementary Table 1 ofKovács et al., 2016).
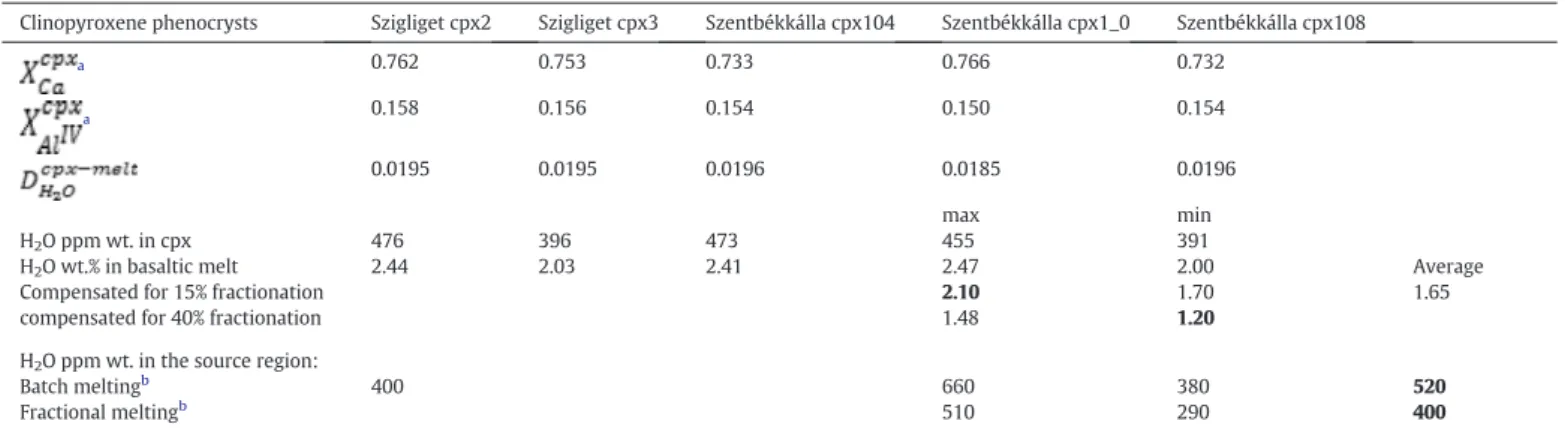
The determined DH2OCpx−melt values range from ~0.018 to 0.020 (Table 1). With these partition coefficients, the‘water’content of the ba- saltic melt in equilibrium with the clinopyroxenes was calculated and the results vary between 2.0 and 2.5 wt.% (Table 1).
3.3. Effects of fractionation on parental melt‘water’contents
‘Water’content in equilibrium with the clinopyroxene megacrysts can be modified by fractionation, which increases the‘water’content Fig. 2.Rare Earth Element (REE) (a) and spider (b) diagrams for clinopyroxene megacrysts from the BBHVF (Jankovics et al., 2016) and NGVF (Dobosi and Jenner, 1999) and clinopyroxenes from Type-II cumulate xenoliths from the NGVF (Kovács et al., 2004) all hosted in alkaline basalts. For comparison, the compositions of the studied clinopyroxenes fromKovács et al. (2016)are also highlighted. The diagrams are all normalised to primitive mantle composition based on Sun and McDonough (1995).
of the melt if degassing does not occur at the same time. Therefore, using clinopyroxene-melt equilibrium‘water’contents can overesti- mate the‘water’content of the parental melt. As clinopyroxenes in this study cover a range of mg# values, they presumably represent the magmatic system after various degrees of crystallisation. To estimate the degree of fractionation required to produce clinopyroxenes with similar composition to those megacrysts, we performed isobaric frac- tionation modelling in rhyolite-MELTS 1.2.0 (Ghiorso and Gualda, 2015; Gualda et al., 2012). As starting composition, a primitive (mg#N0.66) whole-rock composition from Szigliget (SZ-651,Embey- Isztin et al., 1993) was used. The pressure was set at 1 GPa (equal to
~35 km depth, representative to the uppermost lithospheric mantle be- neath the BBHFV), while the oxygen fugacity was set at FMQ+1.3. To estimate the‘water’content of the primitive melt, between 1.5 and 2.0 wt.% H2O was added to the system.
Results are shown inFig. 3. The MELTS model predicts two various clinopyroxene compositions: a diopside-poor one (CaO/Al2O3b1.6, CaOb7 wt.%) and a diopsidic one (CaO/Al2O3N1.8; CaON16 wt.%;
Fig. 3c). The latter provides a good match to the compositions of the clinopyroxene megacrysts. Furthermore, spinel is also predicted by MELTS to appear in the system. From a comparison of the mg# of the clinopyroxene megacrysts with the clinopyroxene compositions calcu- lated in MELTS, the degree of fractionation can be estimated between
~15% for most Mg-rich crystals. In the case of the crystal with the lowest mg# (Szentbékkálla cpx104) this value is ~40% (Fig. 3a). After taking the effect of crystallization into account, parental magma‘water’contents can be estimated to be between 1.5 and 2 wt.% by MELTS (Fig. 3b).
Note that if the 15 or 40% fractionation is taken into account for the es- timations based on the structural hydroxyl content of clinopyroxene megacryst (i.e., 2–2.5 wt.%), the range defined by the minimum and maximum‘water’contents spans from 1.2 to 2.1 wt.%. This range agrees very well with estimates obtained from MELTS (i.e., 1.5–2 wt.%).
3.4.‘Water’content in the mantle source
The‘water’content of the mantle source region for the alkaline ba- salts can be calculated if bulk partition coefficients for‘water’between basaltic melts and their peridotitic sources are known, and if informa- tion is available on the degree of partial melting. The partition coeffi- cient for‘water’between basaltic melts and their peridotitic source rock (DH2Osolid−melt) has been constrained by experimental and theoret- ical studies and is in the range between 0.005 and 0.013 (e.g.Aubaud
et al., 2004;Hao et al., 2014;Hirschmann et al., 2009;Tenner et al., 2009).
The degree of partial melting for the BBHVF alkaline basalts was constrained by the critical melting model ofSobolev and Shimizu (1992)as parameterised inHarangi et al. (2015)using the trace ele- ment composition of bulk alkaline basalts from the CPR (Fig. 4). In Fig. 4, samples from the BBHVF fall mostly on or close to the trend de- fined by the partial melting of garnet-peridotite (see alsofigFig. 9 in Harangi et al., 2015). The degree of partial melting is between 2 and 3%, closer to the latter. InFig. 4the non-modal equilibrium partial melt- ing model for the PMVF alkaline basalts as parameterised byHarangi et al. (2013)is also highlighted. The alkaline basalts from the BBHVF also fall on the garnet-lherzolite melting trend. However, the degree of partial melting in this case is higher and ranges between 3 and 5%.
For the sake of simplicity we applied an average degree of partial melt- ing within the broad range defined by earlier studies discussed above based on trace element modelling (f = 0.0225, i.e. 2.25% partial melt- ing) and an average partition coefficient (DH2Osolid−melt=0.009) to calcu- late the‘water’content in the source region, which is a conservative approach providing estimates closer to the minimum.
Using modal batch (Eq.3) or fractional (Eq.4) melting models, the
‘water’concentration in the source region can be calculated as follows:
CH02O¼CHmelt2O∙ðDþf∙ð1−DÞÞ 3Þ CH02O¼CHmelt2O∙f=1−ð1−fÞ1=D
4Þ
For these calculations, fractionation corrected (taking into account the modelled degrees of fractionation between 15 and 40%;Table 1) minimum, maximum and average‘water’contents were adopted for the basaltic melts (CmeltH2 O). The batch melting model gives‘water’con- centrations which are higher than those obtained from the fractional melting model (Table 1). The batch melting model provides minimum and maximum‘water’contents of 380 and 660 ppm, respectively, whereas the fractional model results in values of 290 and 510 ppm, re- spectively. The‘average’water contents by the batch and fractional model are 520 ± 200 and 400 ± 150 ppm, respectively.
The calculated average‘water’content in the source increases both with the degree of partial melting and the increasing partition coeffi- cient (i.e. more‘water’is partitioned into the solid phase). Accordingly, the source region would be the richest in‘water’(~700 and ~550 ppm Table 1
Parameters used to calculate the water content in the source region of alkaline basalts.
Clinopyroxene phenocrysts Szigliget cpx2 Szigliget cpx3 Szentbékkálla cpx104 Szentbékkálla cpx1_0 Szentbékkálla cpx108
a 0.762 0.753 0.733 0.766 0.732
a 0.158 0.156 0.154 0.150 0.154
0.0195 0.0195 0.0196 0.0185 0.0196
max min
H2O ppm wt. in cpx 476 396 473 455 391
H2O wt.% in basaltic melt 2.44 2.03 2.41 2.47 2.00 Average
Compensated for 15% fractionation 2.10 1.70 1.65
compensated for 40% fractionation 1.48 1.20
H2O ppm wt. in the source region:
Batch meltingb 400 660 380 520
Fractional meltingb 510 290 400
Bold characters in the min and max columns of the table display the possile minimum and maximum H2O content of the host basalt after 40 and 15% fractionation respectively. Bold char- acters in the average column mean the average 'water' content of the source for batch and fractional melting respectivel.
aChemical compositions and water contents of clinopyroxenes are fromKovács et al. (2016). Cation numbers are calculated following the routine outlined in Table A5 ofO'Leary et al.
(2010).
b Water concentration in the source region is calculated by assuming either batch or fractional melting. The minimum degree of melting (f) for the Bakony–Balaton Highland is taken fromHarangi et al. (2015)and it is f = 0.025±0.0075. The partition coefficient (D) between basaltic melt and its source rock is taken as the average fromAubaud et al. (2004),Hirschmann et al. (2009)andTenner et al. (2009), and its value is 0.009 ± 0.004. The cumulative 2σuncertainity in the calculated water contents is ~40% inlcuding all possible sources of unsureness (i.e. partition coeffecicients of water, degrees of partial melting, 'water' content of pyroxene phenocrysts).
for modal batch and fractional melting respectively) if the degree of par- tial melting was ~3% and the partition coefficient was 0.013 (both values are at their maximum, although the degree of partial melting could be
even higher). In contrast, there would be‘only’~330 and 260 ppm
‘water’(for modal batch and fractional melting respectively) in the source when the degree of partial melting was ~1.5% and the partition coefficient was 0.005. Thus we can argue that the minimum‘water’con- centration in the source region is 260 ppm, but more likely in the aver- age range between 400 and 520 ppm. For extreme parameters,‘water’ contents could even reach values up to 700 ppm.
4. Discussion
4.1. Structural hydroxyl content of clinopyroxenes,‘water’content of their equilibrium basaltic melts and their source region
Clinopyroxenes show intermediate to high structural hydroxyl con- centrations (391–476 ppm;Kovács et al., 2016) compared to the range defined by clinopyroxenes from upper mantle peridotite xenoliths, mega- and megacrysts from igneous rocks worldwide (e.g.Aradi et al., 2017;Bonadiman et al., 2009;Demouchy and Bolfan-Casanova, 2016;
Denis et al., 2015;Hao et al., 2016;Kovács et al., 2012a;Patkó et al., 2019;Peslier et al., 2017;Pintér et al., 2015;Sundvall and Stalder, 2011;Xia et al., 2019).
We compared the fractionation corrected‘water’concentrations (1.2–2.1 wt.% assuming 40 and 15% fractionation, respectively) in the equilibrium basaltic melt with typical ranges for mid-ocean ridge ba- salts (b~0.5 wt.%; MORB), ocean island basalts (0.5–1.0 wt.%; OIB), back-arc basin basalts (0.5–2.0 wt.%; BABB) and island arc basalts (2.0–8.0 wt.%; IAB). From this it appears that they exceed those of MORB and OIB, but fall on the higher end of BABB and the lower end of IAB (Dixon et al., 2004;Xia et al., 2013). This concentration range rep- resents intermediate to high values compared to those estimated for the Eastern Chinese alkaline basalts (Xia et al., 2013, 2019).
The‘water’content of the source regions has been estimated to be in the average range of 400–520 ppm after fractionation correction (Table 1). This range is significantly higher than what is typical for MORB (50–250 ppm, e.g.,Dixon et al., 1988;Saal et al., 2002) and more in line with the estimates for OIB and E-MORB mantle source (300–1000 ppm, e.g.Dixon et al., 2002;Asimow et al., 2004). Therefore, we conclude that the asthenospheric source region of alkaline basalts beneath the CPR is considerably enriched in‘water’relative to MORB.
In the next paragraph we present possible explanations for the‘wet’na- ture of the asthenosphere beneath the CPR.
4.2. Possible explanations for relatively‘water’-rich asthenosphere beneath the BBHVF
Prior to and partially during the Oligocene-Miocene extrusion of the Alcapa and Tisza-Dacia microplates (Fig. 1), the Carpathian embayment was surrounded by active subduction zones of oceanic or highly ex- tended continental lithosphere (i.e.Balázs et al., 2016;Csontos and Vörös, 2004;Horváth et al., 2006, 2015;Schmid et al., 2008). These sub- ductions may have been capable of transferring considerable amounts of volatiles back to the upper mantle beneath the CPR over geological times. The Penninic Ocean on the NE started subducting in the Mesozoic and its closure took place in the Eocene (Schmid et al., 2004). Almost si- multaneously in the SW, the Vardar subduction may have transferred volatiles beneath the Carpathian embayment (Karamata, 2006). To the E and NE, the eastern continuation of the Penninic Ocean, the Magura Ocean started subducting in the Eocene (Oszczypko, 1992) and was closed by Late Miocene times (Kováčet al., 1994). Furthermore, on the western edge of the Pannonian Basin the Penninic subduction during the Eocene could have also affected the lithospheric mantle beneath the SBVF (Aradi et al., 2017). The time span of several tens of million years of continuous subduction below the Carpathian embayment must have been sufficiently long for extensive hydration of the overly- ing mantle wedge (Arcay et al., 2005, 2006;Gerya et al., 2002), and for allowing the subducting slabs to reach the 660 km discontinuity Fig. 3.Results of the isobaric crystallisation model carried out in rhyolite-MELTS 1.2.0
(Ghiorso and Gualda, 2015;Gualda et al., 2012) using whole-rock sample SZ-651 (Embey-Isztin et al., 1993) as a starting composition. The degree of fractional crystallisation vs. mg# number diagram (a) indicates clinopyroxenes with mg# = 76–82 are in equilibrium with liquids after ~15–40% fractionation. In (b), the change in
‘water’contents as a function of mg# is shown, indicating that‘water’content of the melt steadily increases as the magma becomes more evolved. Melt‘water’contents of 2–2.4 wt% based on clinopyroxene megacrysts’structural hydroxyl concentrations can be derived from parental melts with 1.5–2 wt% H2O. In (c) the major element composition of the two clinopyroxenes (blue: Ca-poor, clinoenstatite, green: Ca-rich, diopside) is shown: the studied crystals are a good match in both #mg range and CaO/
Al2O3ratio with the modelled diopsidic clinopyroxene compositions.
beneath the CPR (Hetényi et al., 2009), where migrated receiver func- tion profiles suggest an accumulation of formerly subducted slabs.
It is generally accepted that subducted slabs can transport significant amounts of volatiles (especially‘water’) back to the deep upper mantle (e.g.Fumagalli and Klemme, 2015). There is also a growing number of observations that this‘water’can be accumulated between major geo- physical discontinuities at depths of 410 and 660 km in‘water’-rich minerals such as K-hollandite, wadsleyite and ringwoodite, which can have up to a few wt.%‘water’incorporated in their mineral structure (Mazza et al., 2019;Pearson et al., 2014). Recent studies introduced the concept of‘hydrous plumes’which originate from the top of this
‘wet’transition zone and rise to the bottom of the lithosphere causing extension and magmatism but without thermal anomalies (Chen et al., 2015, 2017;Freitas et al., 2017;Kuritani et al., 2019;Liu et al., 2016;Wang et al., 2015). The negative buoyancy of‘hydrous plumes’ comes from their elevated melt and volatile content provided by the presumably global‘melt layer’at the 410 km boundary (Freitas et al., 2017). The existence of such‘hydrous’plume underneath the CPR can- not be ruled out since the Penninic subducted slab reached this transi- tion zone in the Cretaceous, while the Vardar slab reached it in the Paleogene (Hetényi et al., 2009). Thus, there was still a time interval of several tens of myr for ‘this’ hydrous plume to rise from the
~410 km discontinuity to the bottom of the lithosphere at
~100–120 km (e.g.Falus et al., 2000). This provides a rationale for fur- ther exploration of the potential role of‘hydrous plumes’in the geodynamical and geochemical evolution of the CPR (seeKoptev et al., 2017). Note, however, that Cenozoic alkaline basalts in the CPR are characterised by OIB-like trace element patterns (e.g.Harangi et al., 2015;Seghedi et al., 2004) and positive Nb and Ta anomalies in the cen- tral part of the area. This implies that the‘water’in the source region is not directly liberated from subducted slabs. Instead, it is likely an inherited enriched mantle component originating from slab derived fluid and mantle wedge interaction and subsequent redistribution/
recycling in the upper mantle (i.e.,Bali et al., 2007;Berkesi et al., 2012). In addition, the Sr and Pb isotopic systematics indicates the pres- ence of ancient enriched components in some alkaline basalts. This highlights the possibility that at least a portion of the‘water’in the source region may have had an even older component in the mantle than the one resulting from Mesozoic subduction.
In summary, prior subduction of the Penninic, Magura and Vardar Oceans beneath the CPR may have played an important role in hydrat- ing the overlying mantle wedge (including the asthenosphere). The younger‘hydrous plumes’rising from the‘subduction graveyard’of
these earlier oceanic slabs could also have a role in hydrating the upper mantle.
4.3. Effect of high‘water’content on the melting properties of the upper mantle
It appears crucial to evaluate whether the estimated‘water’concen- tration is sufficient to trigger partial melting in the asthenospheric source beneath the BBHVF. InFig. 5, different empirically and theoreti- cally determined solidi for peridotitic upper mantle (Green, 2015;
Green et al., 2010, 2014;Katz et al., 2003;Kovács et al., 2012a, 2017) are highlighted along with a depth-temperature curve representative for the BBHVF (Kovács et al., 2017).Harangi et al. (2015)estimated that the partial melting under the BBHVF took place at depths between
~70 and 100 km (~2.2–2.9 GPa). InFig. 5, the shaded region shows the estimated range of‘water’concentrations in the source region following the concentration outlines in the melting model ofKatz et al. (2003).
The three different solidi were determined experimentally byGreen et al. (2010, 2014),Green (2015)andKovács et al. (2012a). The‘water saturated solidus’(Fig. 5) highlights the temperature at which the upper mantle begins to melt when the bulk‘water’concentration ex- ceeds ~0.4 wt.% and ~200 ppm‘water’above and below ~100 km, re- spectively. The‘water saturated solidus’is at ~1000 °C between 70 and 100 km, which is significantly exceeded by the temperature (~1100–1250 °C) in this depth range based on the area specific geotherm (Fig. 5). This implies that the upper mantle would be in a par- tially molten state if there was more than ~0.4 wt. %‘water’in the bulk rock at depths above ~100 km. Since our estimations give‘only’ 290–660 ppm‘water’in the source, this means that the‘water saturated solidus’cannot explain the presence of partial melt in the astheno- sphere. The‘dry solidus’(Fig. 5), for which the bulk‘water’is less than 200 ppm, cannot explain the presence of partial melt at this depth ei- ther, because the temperature beneath the BBHVF remains considerably below that of the‘dry solidus’(i.e. ~1300–1400 °C). The‘pargasite dehy- dration solidus’(Fig. 5), which is the solidus if bulk‘water’concentration is between ~200 ppm and 0.4 wt.%, is at 1050–1100 °C between 70 and 100 km depth. The‘pargasite dehydration solidus’temperature is higher for geochemically more fertile and lower for more refractory upper mantle (Niida and Green, 1999). This is because Na-rich amphibole in more fertile upper mantle is stable to higher temperatures. Because the composition of the upper mantle is at least moderately refractory beneath the BBHVF, the‘pargasite dehydration solidus’should be closer to ~1050 °C (e.gDobosi et al., 2010;Embey-Isztin et al., 2014;Kovács Fig. 4.Estimated degrees of partial melting in upper mantle source regions of alkaline basalts based on La/Y vs. Zr/Nb ratios, following two different methodologies explained inHarangi et al. (2013, 2015)for spinel- and garnet lherzolite assemblages with and without the presence of amphibole. Modelled melting trajectories and degrees are fromHarangi et al. (2013, 2015). Data for different alkaline basaltic occurrences are from the following references: Burgenland:Embey-Isztin et al. (1993);Ali and Ntaflos (2011); SBVF:Embey-Isztin et al.
(1993);Seghedi et al. (2004);Ali et al. (2013); BBHVF and LHPVF:Embey-Isztin et al. (1993);Harangi et al. (2015); NGVF:Embey-Isztin et al. (1993);Dobosi and Jenner (1999);
Harangi et al. (2015); PMVF:Embey-Isztin et al. (1993);Downes et al. (1995);Harangi et al. (2013).
et al., 2012a;Szabó et al., 2004). The geotherm exceeds the‘pargasite de- hydration solidus’in the entire depth range between 70 and 100 km from where alkaline basalts in the BBHVF originate (Fig. 5). Since the es- timated range of‘water’concentrations in the source region almost per- fectly overlaps with bulk‘water’contents where the solidus is the
‘pargasite dehydration solidus’, it is very likely that the asthenosphere must have been in a partially molten state at the time of alkaline basaltic volcanism. This means that the‘water’concentration alone would have been sufficient to trigger partial melting in the asthenosphere without the need for decompressional melting, thermal plumes or the direct ef- fect of geochemical heterogeneities (i.e. eclogite or pyroxenite litholo- gies) in the mantle source.
The possible contribution of eclogite or pyroxenite lithologies to the basaltic melts was estimated following the experimentally developed methodology ofLe Roux et al. (2011). These authors argue that the bulk concentration of a few major and trace elements (i.e., Fe, Mn, Co, Zn, Ni) in basalts and their particular ratios can distinguish effectively between peridotite, eclogite and mixed source lithologies based on their distinct partitioning into eclogites and peridotites (Fig. 6). In these diagrams, average whole-rock compositions of alkaline basalts from the CPR (including the BBHVF) are plotted. As the alkaline basalts may have gone through fractional crystallisation (see also our MELTS modelling above), we also plotted bulk assemblages to which both 10 and 20% of cumulates were added (i.e.Zajacz et al., 2007). This calcula- tion serves the purpose of illustrating how the trace element composi- tions changed during fractional crystallization of alkaline basalts and how much contribution from eclogite and pyroxenite lithologies can be expected. The composition of cumulates was estimated by mixing 70 wt.% olivine (Type I olivine core fromJankovics et al., 2019) and 30 wt.% clinopyroxene (primitive colourless megacrysts fromJankovics et al., 2016). Both phases represent near liquidus minerals crystallising from almost unfractionated basaltic melts. InFig. 6a ((Mn/Fe)∙100 vs.
(Co/Fe)∙100), the average compositions all fall in the eclogite range.
However, the recalculated less fractionated bulk compositions in this calculation (assuming 20% fractionation) is on the mixing line between 60% eclogite and 5% spinel peridotite partial melt in 30 and 70%
proportions respectively. In contrast, inFig. 6b (Mn/Zn vs. Ni/Co) almost all but the original (uncorrected) basalt compositions reside in or are very close to the peridotitefield. The less fractionated average basalt composition of the BBHVF is on the garnet peridotite melting curve cor- responding to a higher degree of partial melting without any contribu- tion from eclogite melts. If the original and 10% fractionation corrected compositions are taken into account, implying contributions of 30%
and 60% partial melts originating from eclogite (degree of which partial melting is as high as ~80%) and spinel peridotite (with significantly lower degree of partial melting). Average compositions of other alkaline basalticfields from the CPR show similar patterns apart from moving to- wards either the spinel or garnet peridotite melting curves from that of eclogite. InFig. 6c ((Mn/Fe)∙100 vs. (Zn/Fe)∙100), all basalts from the CPR are in the peridotitefield. Both the original and fractionation corrected compositions fall in the continuation of the garnet peridotite melting trend. In summary, there is only one diagram where the 20%
fractionation corrected composition from the BBHVF is in the eclogite field (Fig. 6a), but it indicates only 30% contribution of eclogite derived melts. In the other two scenarios (Fig. 6a and5b) the same 20% fraction- ation corrected compositions of basalts from the BBHVF reside on the pure garnet peridotite melting curve. Even in case a lower degree of fractionation occurred, the contribution of eclogite melt remains below 30%. If, as indicated by the MELTS modelling, a higher degree of fractionation occurs (up to 40%), the trends move more towards the pe- ridotitefield indicating a reduced contribution from eclogite and pyrox- enite lithologies. The diagrams point to a minor direct contribution of eclogite or pyroxenite derived melts to the basalts, which is also con- firmed by the presence of subducted slab derived melts beneath the BBHVF (Bali et al., 2008). In contrast, garnet peridotite derived melts predominate in agreement with other geochemical trace element modelling (seeFig. 4). It follows that the role of eclogite lithologies in decreasing the solidus temperature of the upper mantle may have been only subordinate to that of‘water’.
From the above, it appears that the asthenosphere was sufficiently
‘wet’to contain partial melt at the time of alkaline basaltic volcanism, and presumably also prior to this stage. Note that changing bulk Fig. 5.Effect of water on solidus temperature of the upper mantle. Thefigure is modified and completed afterGreen (2015)andKovács et al. (2017). Various solidi are indicated by solid black lines. Thei) water saturated solidusis valid if the bulk water content in the upper mantle isN0.4 wt.%; Theii) (pargasite) dehydration solidiare the solidi when the bulk water content is between ~0.02 wt.% (~200 ppm) and 0.4 wt.% (~400 ppm) at depths shallower than ~100 km. Temperatures of thepargasite dehydration solidiare higher for more fertile and lower for more refractory compositions of the upper mantle. The solidus is theiii) dry soliduswhen the bulk water content is below ~0.02 wt.% (200 ppm). Calculated solidi positions fromKatz et al. (2003) are also highlighted. Note that this calculation only includes the effect of hydrogen stored in nominally anhydrous minerals but does not incorporate the impact of hydrous minerals and excessfluid. Calculated solidi curves are determined for 500, 1000 and 3000 ppm water in the bulk rock. Pressure was converted to depth assuming lithostatic pressure only, with a 30 km thick crust (Bielik et al., 2018;Wéber, 2002) and crustal and upper mantle densities set at 2700 and 3300 kg/m3respectively. The geotherm is marked by a dashed bold black line and corresponds to 100 mW/m2surface heatflow typical for the central part of the Pannonian Basin as taken fromKovács et al. (2017). The grey shaded area indicates the minimum range of bulk water contents (~260–660 ppm wt. including 40% uncertainty and assuming 20% fractionation) in the source region of the studied alkaline basalts superimposed on the solidi positions calculated byKatz et al. (2003). Horizontal light grey lines indicate the pressure/depth range (between ~70 and ~90 km) of partial melting determined for the BBHVF basalts byHarangi et al. (2015).
geochemistry of the upper mantle with special respect to other volatiles (i.e. CO2, Cl-, F-and N2) can slightly influence the temperature of the dif- ferent solidi as well. The effect of the changing bulk geochemistry of the upper mantle (i.e. more refractory or more fertile) has been already ad- dressed by experimental studies (e.g.Green, 2015) and seems to only subordinately modify the solidus temperature (±~50 °C) at a given pressure. The most important volatile component besides‘water’is CO2(e.g.Berkesi et al., 2012) with an effect indirectly taken into account since a trace amount of CO2is always present during experiments.
It is important to emphasise the novelty of our approach, based on the effect of a small amount of‘water’on the solidus. Some of the earlier experimental studies on the melting properties of the upper mantle (e.g.Grove et al., 2006;Mysen and Boettcher, 1975) simply omitted the role played by trace amounts of‘water’and hydrous phases, most importantly, pargasitic amphibole. It has been demonstrated only rela- tively recently (Green et al., 2010), that pargasitic amphibole is a stable phase of the upper mantle even from as low as ~200 ppm bulk‘water’ contents up to ~0.4 wt.% at depths shallower than 100 km. Under these conditions the solidus is the‘pargasite dehydration solidus’at ~ 1050–1100 °C; approximately 100–150 °C lower than without consider- ing the effect of trace amount of‘water’and the stability of pargasitic amphibole.
Other experimental and theoretical studies (e.g.Hirschmann et al., 2009;Katz et al., 2003), however, simply assumed that the‘(nominally anhydrous) NAMs solidus’temperature changes continuously with the concentration of structural hydroxyl in NAMs between the‘water satu- rated’and‘dry’solidi (seeFig. 5).Katz et al. (2003)proposed that the po- sition of the‘NAMs solidus’shifts to lower temperatures in the P-T space more or less parallel to the‘dry solidus’(Fig. 5). According to this model at a given pressure (depth), 500 ppm‘water’incorporated as structural hydroxyl in NAMs lowers the solidus temperature by 100–150 °C with respect to the‘dry solidus’(Fig. 5). The geotherm beneath the BBHVF would even intersect this‘NAMs solidus’for higher (600–800 ppm) bulk‘water’contents which are still in the upper range of our estimates.
Thus, even these theoretical models would predict the presence of par- tial melt in the upper mantle beneath the BBHVF.
At this stage there is still some uncertainty whether our results only concern the BBHVF or they could equally be relevant for other alkaline basaltic localities in the CPR. Since the BBHVF is one of the most distant alkaline basaltic sites–in its present position–from the suture zones of prior subductions (i.e. Penninic, Vardar and Magura) it is reasonable to assume that beneath other localities closer to these former subduction zones the degree of hydration may have been even more pronounced.
Consequently, the asthenosphere should have been in partially molten Fig. 6.Discrimination diagrams for Zn/Fe×104vs Mn/Fe×100 (a), Ni/Co vs Mn/Zn (b) and Co/Fe vs Mn/Fe×100 (c) based onLe Roux et al. (2011). Average compositions for different alkaline basaltic volcanicfields were calculated based on the references listed inFig. 4. Measured basalt compositions were corrected for fractional crystallization assuming 10 and 20%
fractionation of a cumulate consisting of 70 wt.% olivine and 30 wt.% clinopyroxene. Compositions of olivine and clinopyroxene used in the model are averages of Type I olivine cores fromJankovics et al. (2019)and primitive colourless megacryst fromJankovics et al. (2016), respectively.
state under all alkaline basaltic localities of the CPR prior to and during the alkaline basaltic volcanic activity.
Therefore, it may not be the main question anymore why partial melting occurred in the asthenosphere beneath the BBHVF, but instead why the partial melt was extracted only in the tectonic inversion stage of the CPR?
4.4. What could drive melt extraction from the asthenosphere during the tectonic inversion and how?
If partial melt was present in the‘wet’asthenosphere beneath the central CPR, then the question arises what was unique in the tectonic in- version stage which facilitated its extraction from the asthenosphere and led to the formation of alkaline basaltic volcanoes on the surface.
To address this issue, wefirst have to resolve which geodynamic pro- cesses characterised the tectonic inversion stage. Thefirst regional tec- tonic process preceding the tectonic inversion stage was the‘docking’ or‘soft collision’of the two major tectonic units (Alcapa and Tisza- Dacia) with the European platform in the Carpathian embayment at
~11 Ma (e.g.Csontos et al., 1992;Matenco et al., 2003). After this major tectonic event, the stressfield did not change immediately to compression in the lithosphere since smaller scale block rotations, slip along major tectonic lines and nappe stacking could have taken up the shortening for a while. The tectonic inversion began at 8 and 5 Ma in the SW and E part of the Pannonian Basin, respectively (e.g.Bada et al., 2007;Balázs et al., 2016;Horváth and Cloetingh, 1996). The tec- tonic inversion and the accompanying shortening and compression were driven by the counter-clockwise rotation of the Adriatic indenter and its convergence to the stable European platform (e.g.Bada et al., 2007;Bus et al., 2009;Caporali, 2009). As a consequence, in the central part of the CPR, the compression is predominantly SW–NE directed since at least the onset of the inversion stage. Our main objective is to identify whether there are any geophysical and geological conse- quences of this compression in the lithosphere and asthenosphere which could facilitate the extraction of basaltic partial melts from the as- thenosphere and their rise to the surface.
4.5. Deformation and stress regime in the asthenosphere and lithospheric mantle at the time of alkaline basaltic volcanic activity
A topic of prime importance concerns the role of the asthenosphere and the deeper lithospheric mantle. The direction of shear wave split- ting (SKS) in the central part of the CPR is NW–SE directed which is per- pendicular to the direction of main compression, with delay times around or less than 1 s (Fig. 7;Kovács et al., 2012b;Qorbani et al., 2016). An important question is how this information can be utilised to infer the deformation state of the asthenosphere and the lithospheric mantle. The splitting of seismic shear waves in the Earth’s interior is due to anisotropy which originates from the lattice preferred orientation of rock forming minerals developing in response to stress. Consequently, olivine–the most deformable mineral of the asthenosphere (e.g.
Tommasi et al., 1999;Vauchez et al., 2012)–usually develops lattice preferred orientations (LPO), for instance by its‘a’crystallographic axis turning into the foliation plane and parallel to the lineation. This is, however, not generally true since at different bulk‘water’contents and degrees of stress, various slip systems can also be active, resulting in different alignments of the major crystallographic axes with respect to the direction of the compression (Jung, 2009). The main point is that the less viscous asthenosphere (and also, to a smaller extent the lithospheric mantle) can develop LPO of minerals often generating mac- roscopic foliation and lineation in the upper mantle.
The degree of shear wave anisotropy can be constrained from the statistical analysis of electron backscatter diffraction (EBSD) deter- mined LPO of the rock forming major silicate minerals and their physical properties (e.g.Mainprice et al., 2000). In the BBHVF, alkaline basalts brought up a significant amount of upper mantle xenoliths to the sur- face, providing an opportunity to determine the orientation and degree of their shear wave anisotropy (Falus, 2004). As geophysically deter- mined SKS splitting delay time data are also available for the BBHVF (Kovács et al., 2012b;Qorbani et al., 2016), the thickness of the aniso- tropic layer and the orientation of the xenoliths in this layer can be esti- mated. As the original orientation of peridotite xenoliths in the upper mantle is unknown, several scenarios should be explored for how the foliation and lineation of these upper mantle rocks are aligned with
Fig. 7.Schematic map showing the direction of measured shear wave splitting in the region modified afterQorbani et al. (2016)(a), and a model explaining both the orientation of SKS splitting and the formation of alkaline basalts at the late-Neogene tectonic inversion stage of the Carpathian-Pannonian region (b).