www.nature.com/scientificreports
Near cut‑off wavelength operation of resonant waveguide grating
biosensors
Balint Kovacs 1,2,3*, Fabio Aldo Kraft4, Zsolt Szabo5, Yousef Nazirizadeh6, Martina Gerken4 & Robert Horvath1
Numerical simulations and analytical calculations are performed to support the design of grating‑
coupled planar optical waveguides for biological sensing. Near cut‑off and far from cut‑off modes are investigated, and their characteristics and suitability for sensing are compared. The numerical simulations reveal the high sensitivity of the guided mode intensity near the cut‑off wavelength for any refractive index change along the waveguide. Consequently, it is sufficient to monitor the intensity change of the near cut‑off sensing mode, which leads to a simpler sensor design compared to those setups where the resonant wavelength shift of the guided mode is monitored with high precision. The operating wavelength and the sensitivity of the proposed device can be tuned by varying the geometrical parameters of the corrugated waveguide. These results may lead to the development of highly sensitive integrated sensors, which have a simple design and therefore are cost‑effective for a wide range of applications. These numerical findings are supported with experimental results, where the cut‑off sensing mode was identified.
Optical biosensors based on the evanescent field of surface plasmons1–4, optical waveguide interferometers2,3, photonic crystals2 or resonant waveguide gratings (RWG)3,5 are widely utilized to directly analyze biochemi- cal and cellular interactions without the need of any biomolecular labels. Recent developments increased the sensitivity of these sensors and made them especially popular not only in drug discovery, but also for biological measurements involving even single cells1–5.
The most common evanescent wave biosensors are the surface plasmon resonance (SPR) devices, which employ the evanescent field of the light-excited surface plasmon polaritons on the boundary of metal-dielectric interfaces1,6. Usually the sensitivity of these devices is limited to the nanomolar range, which is appropriate for diverse biochemical applications7–9. However, further research is required to miniaturize these sensors for port- able clinical applications10.
Optical waveguide interferometers utilize the phase difference between the two arms of the sensor, which is caused by the presence of the sample in the evanescent field of the measuring section. These biosensors can offer a broad sensing range, but the modes at different wavelengths have different sensitivity due to their differ- ent propagation speed and penetration depth. This behavior can decrease the information content of the signal.
Therefore, this technique is more appropriate for biomolecular detection11,12.
Photonic crystals13,14 are periodic structures usually made of two dielectrics with characteristic dimensions comparable to the working wavelength region. The multiple reflections due to the periodic refractive index con- trast can completely cancel the wave propagation, and can lead to photonic bandgaps15. Photonic crystal wave- guides and cavities have been applied for cell adhesion research16,17 and also in cellular-level drug discovery18.
The steady increase of cell-based assays for early drug discovery with high throughput and sensitivity in the picomolar range made the RWG one of the most used optical biosensor in our days5,19. Due to its sim- ple structure, it can be easily combined with other biosensor devices, which enables even single-cell adhesion measurements20,21. Like other biosensors, it measures the refractive index changes near the sensor surface by following the changes of the resonant wavelength, but it has the advantage that for TM0 mode the penetration depth is strongly confined to the cell-substrate contact zone, which is crucial for cell adhesion measurements22,23. Measurements with the lowest limit of detection have been achieved using interferometric readout24,25. However,
OPEN
1Nanobiosensorics Laboratory, ELKH EK MFA, Budapest, Hungary. 2Division of Medical Image Computing (MIC), German Cancer Research Center (DKFZ), Heidelberg, Germany. 3Medical Faculty Heidelberg, Heidelberg University, Heidelberg, Germany. 4Institute of Electrical Engineering and Information Technology, Kiel University, Kiel, Germany. 5Faculty of Information Technology and Bionics, Pázmány Péter Catholic University, Budapest, Hungary. 6Byonoy GmbH, Hamburg, Germany.*email: balint.kovacs@dkfz-heidelberg.de
the interferometric method as well as the common measurement method with wavelength analysis significantly increase the cost of this biosensor and makes its miniaturization difficult. This limits its applicability in the everyday clinical practice. To overcome this limitation, an intensity-based measuring method has been devel- oped by operating the sensor near the so-called cut-off frequency. In this case, the change of the assay (cover) refractive index has a significant impact on the intensity of the guided mode26–28. The guided mode disappears when the effective refractive index N reaches the cut-off point. For a normal-symmetry waveguide the relation nF >nS>nC holds for the relative magnitude of the high-index waveguide-film refractive index nF , the substrate refractive index nS and the cover refractive index nC29. For a reverse-symmetry waveguide we have nF>nC>nS and N is limited by the refractive index of the waveguide film nF and of the cover media nC . The guided mode disappears when N reaches one of the boundaries of this range30. The disappearance of the mode could be fol- lowed by a simple intensity measurement26,28.
There are already miniaturized readout systems available, which can convert a wavelength shift into an intensity change31,32. Integration of the RWG, which operates near the cut-off point with such readout systems can provide commercially available clinical sensors within foreseeable time because their sensitive and flexible measurement method for a wide sensing range33,34. Despite of the advantages of the RWG sensors, which could be operated near the cut-off point, their operational conditions have never been in-depth analyzed.
In this work, we present the electromagnetic design of RWG sensors, which operate near the substrate cut-off point. Simulations are performed with commercial electromagnetic solvers and the guided-mode resonances are also calculated analytically with the equations of the 3-layer model. The changes of the position and of the intensity for ‘far from cut-off’ and ‘near cut-off’ reflection resonant peaks as a function of the waveguide thick- ness and of the refractive index of the cover media are investigated. The electromagnetic field distributions of the sensor are visualized near the resonances, the penetration depth of the evanescent field is determined and the sensitivity is also calculated. The simulations demonstrate that by changing only one geometrical parameter, the grating depth of the RWG sensor can be conveniently tailored to the needs of different applications. We also perform experimental reflection measurements with grating waveguides to validate the key numerical findings.
Methods
The modeled waveguide structure. The cross-section of the modeled corrugated planar optical wave- guide is presented in Fig. 1a. The substrate has a refractive index of nS=1.54 , and it is covered by a Nb2O5
(niobium pentoxide) film with refractive index nF and thickness dF . The calculations take into account the wave- length dependence of the Nb2O5 film refractive index as it shown in Fig. 1b35,36. The waveguide film is considered to be covered by an aqueous medium with refractive index nC . The period of the square profiled grating is Λ = 480 nm, the depth is σ = 50 nm and it is located at the substrate–film boundary.
Simulation environment and implementation. The electromagnetic simulations are performed by the Frequency Domain Solver of the commercial simulation environment CST Studio Suit37. This solver is based on the finite element method with tetrahedral mesh, and it is suitable for the simulations of electrically small periodic resonant structures. It can provide the electromagnetic near- and far-fields as well as the S-parameters (transmission and reflection data). The finite element solver is equipped with Floquet boundary conditions, which is called Unit Cell Boundary condition in the settings, therefore it is enough to simulate one period of the corrugated waveguide for a plane wave excitation with any wave vector confined in the x–z plane. To keep the mesh size as small as possible, in the y direction only a thin portion of the geometry as compared to the wave- length is considered. Along the horizontal boundaries (x and y directions) the Floquet boundary conditions, while in the vertical z direction open boundaries implemented with the Floquet ports are set. The TE modes or the TM modes can be set by selecting the proper excitation of the Floquet ports.
Plane wave excitation of the structure with transverse magnetic (TM) and transverse electric (TE) light—
where the magnetic/electric field vector is parallel to the interfaces of the media, respectively—is introduced Figure 1. (a) The cross-section of the modeled corrugated waveguide. The electromagnetic simulations apply Floquet boundary conditions along the x- and y-axis and open boundaries with Floquet ports in the vertical z direction. (b) The frequency dependence of the Nb2O5 film refractive index.
www.nature.com/scientificreports/
by the Floquet port with an incidence angle of 26°. For sensing purposes, it is beneficial to use the TM mode over the TE mode due to its larger sensitivity for any refractive index change close to the sensor surface38. The Epic® RWG biosensor, which is a leading product among RWG based biosensors19,39 also measures the resonant wavelength of the zeroth order TM mode.
During the numerical simulations, the reflection spectra (S1,1 parameter) and the electromagnetic field dis- tribution are investigated. The reflection is calculated at four different waveguide film thicknesses dF = 175 nm, 180 nm, 185 nm, 190 nm with varying nC from 1.27 to 1.45 with steps 0.01 using the parameter sweep function.
Moreover, simulations are run for σ = 20nm, 50 nm, 80 nm grating depths. Field monitors are set at the wave- length of the reflection peaks to examine the distribution of the electromagnetic field near the surface of the sensor. A detailed discussion of the relative wavelength position of the reflection peak with respect to the mode wavelength is given in Ref.40. In case of the TM excitation the magnetic field is continuous over the boundaries of different media therefore it can provide an insight of the RWG sensor functionality. However, the biomolecules and the cells are nonmagnetic structures therefore they interact with the electric field. Consequently, the electric field distributions are visualized when the penetration depth into the cover media is investigated.
Results and discussion
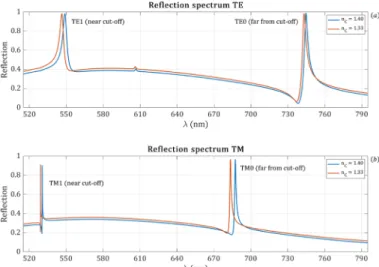
Investigation of the RWG modes suitable for sensing. First, the reflection spectra are simulated by employing the settings discussed in “Simulation environment and implementation” for both TE and TM excita- tion with dF = 185 nm and for two different cover refractive indices. The obtained reflection spectra are shown in Fig. 2. As it can be observed in the simulated wavelength range, the reflection curves have two dominant peaks each. In the TE spectrum a small peak is visible at ~ 600 nm. It can also be seen that the resonant peaks are shifted due to the cover refractive index change but not only the wavelength shift of the TM1 peak is smaller compare to the other resonant peaks but it became also narrower.
For further analysis, the reflection spectrum is calculated for various waveguide film thicknesses in the range of 175–190 nm and the position of the resonant peaks are compared with the peak positions directly calculated from the equation of the 3-layer model38
where ρ = 0 for TE polarization, ρ = 1 for TM polarization and an integer m is the order of excited mode. In order to calculate the wavelengths of the guided modes for a given illumination angle α , the effective refractive index of Eq. (1) is calculated from the grating equation:
where α is the incidence angle of the excitation, l is the coupled diffraction order, is the excitation wavelength and is the grating period. From this analysis it follows that the right peaks correspond to the 0th order mode (1) dF2π
�
n2F−N2−arctan
�nF nC
�2ρ� N2−n2C
� n2F−N2
−arctan
�nF nS
�2ρ� N2−n2S
� n2F−N2
=πm
(2) N=sin(α)+l·
�
Figure 2. Simulated reflection spectra of the sensor for TE and TM excitation with dF = 185 nm and for two different cover refractive indices with an incidence angle of 26°. (a) The TE reflection spectrum of the sensor.
The right peak corresponds to the TE0 mode, while the left peak corresponds to the TE1 mode. (b) The TM reflection spectrum of the sensor. The right peak corresponds to the TM0 mode, while the left peak corresponds to the TM1 mode. It can be seen that the resonant peaks are shifted due to the cover refractive index change but not only the wavelength shift of the TM1 peak is smaller compare to the other resonant peaks but it became also narrower.
in the first diffraction order (m = 0, l = 1), while the left peaks correspond to the 1st order mode (m = 1, l = 1). The small TE peak at ~ 600 nm is the second diffraction order of the 0th order mode (m = 0, l = 2). There is a resonant wavelength shift of the peaks caused by the changed cover refractive index. However, the wavelength shift of the TM1 peak is much smaller compared to the other resonant peaks and its form is also changed for the refractive index change. In the followings, we are investigating this behavior of the TM1 resonant peak focusing on the TM excitation of the sensor structure. In all the following calculations the first diffraction order is considered ( l=1).
The cut-off waveguide film thickness is calculated for the two TM modes using the equation:
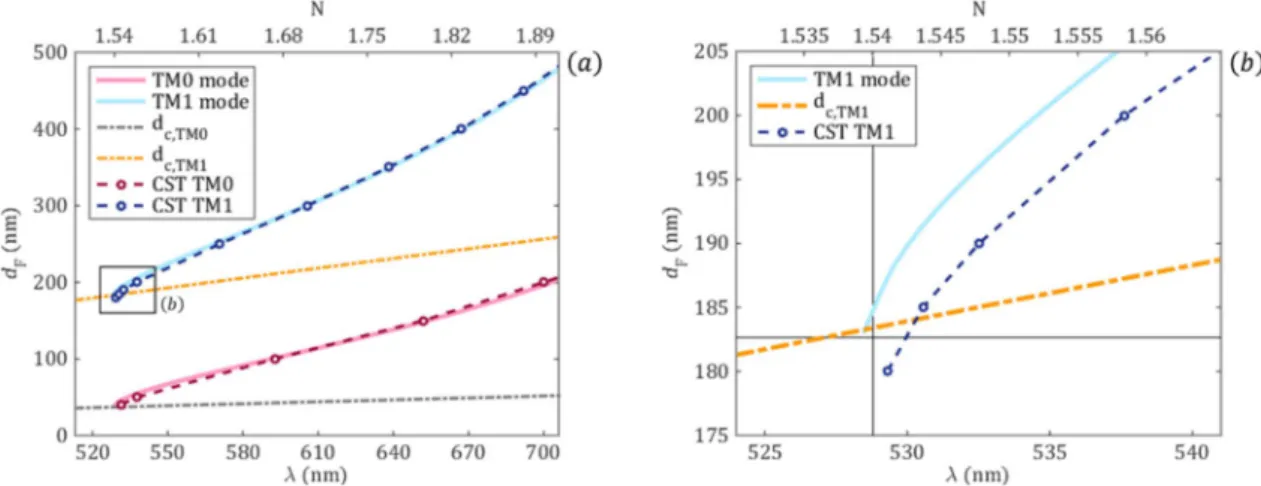
where nmin=min{nS,nC} , nmax=max{nS,nC}30. For the modeled structure we consider nmax=nS and nmin=nC . It is important to note that the specified mode cannot exist in the structure if dF <dc . The results of the analytical calculations and a comparison with numerical simulations are summarized in Fig. 3. The numeri- cally obtained left and right peaks of Fig. 2 correspond to the TM1 and TM0 mode, respectively. More importantly, by decreasing the thickness of the waveguide film, the TM1 resonance shifts closer and closer to the cut-off point and this mode cannot exist when the waveguide thickness is less than 183 nm. This thickness corresponds to the cut-off of the TM1 mode, where it turns from a propagating to evanescent wave. However, the TM0 mode stably exists even for decreased film thicknesses. Therefore, we refer to the TM1 mode as near cut-off and to the TM0
mode as far-from-cut-off resonances. The cut-off points are dF = 183 nm in case of TM1 and dF = 40 nm for TM0. The magnetic field distribution of the RWG sensor corresponding to the wavelengths at the maximum ampli- tudes of the reflection peaks are plotted in Fig. 4. For comparison off-resonance magnetic field distributions are plotted as well. The operating wavelengths are λTM0 = 678, 688, 698 nm and λTM1 = 521, 531, 541 nm. At resonance, the exiting TM wave couples to the waveguide mode resulting in field enhancement in the waveguide as well as an evanescent field at the sensor surface. Constructive interference in reflection and destructive interference in transmission is present. The exciting wave passes the grating structure at the off-resonance wavelengths. The second row of the field distributions reveals the difference between the two guided modes. The TM0 mode is much stronger localized inside the waveguide film compared to the TM1 mode, which is a consequence of the mode profile caused by the geometry of the waveguide28–30. To better visualize the effect, the electromagnetic field animations at the resonances can be found in the Supplementary materials.
An essential parameter of surface-sensitive sensor applications is the penetration depth into the aqueous cover media. The analyte biomolecules and living cells on top of the sensor are monitored by the evanescent field of the excited mode. Consequently, for larger penetration depths larger objects or a larger portion of the objects is sensed by the evanescent wave41. Therefore, it is important to tailor the penetration depth to needs of the actual application. The penetration depth into the cover medium can be calculated from the following equation30
where kz denotes the component of the wave vector in the z-direction (the direction of mode propagation). In Fig. 5 the penetration depth and the magnetic field distribution of the TM0 and TM1 modes are plotted. As it (3)
dc= 1
kz
n2F−n2max
·
arctan
nF
nmin
2ρ
·
nmax2 −n2min n2F−n2max
+πm
�zF,C= 1−̺ (4) kz
N2−n2C
+
̺
N nF
2
+ N
nC
2
−1 −1
kz
N2−n2C
Figure 3. (a) TM0 and TM1 mode curves calculated with the 3-layer model (continuous lines) and the numerical electromagnetic simulations (open circles) with an incidence angle of 26°. The graph shows the waveguide thicknesses as function of the corresponding illumination wavelength and effective refractive index when the cover refractive index is nC=1.4 . The dashed lines are the thicknesses corresponding to the cut-off wavelengths. (b) Magnification of the TM1 curve near the cut-off point. The black vertical line is located at N=nS=1.54 , which is the cut-off point.
www.nature.com/scientificreports/
Figure 4. The magnetic field distributions before, at and after the resonant peak of the TM0 and TM1
resonances. The TM wave incident from the substrate side with an incidence angle of 26° produces field enhancement in the waveguide and an evanescent field at the sensor surface at the resonant wavelengths upon full reflection. It transmits through the grating structure at the off-resonance wavelengths. The stronger localization of the mode power inside the waveguide film for the TM0 far-from cut-off mode is observed. The magnetic field distributions are calculated by CST Studio Suit37.
can be observed a larger penetration depth is obtained for the TM1 mode (203 nm vs. 61 nm). Therefore, the TM1 mode is more suitable to sense larger biological objects and can monitor the changes of the refractive index further away from the waveguide surface.
Sensitivity analysis of the sensor. After investigating the main characteristics of the two dominant reso- nance peaks, in this section the sensitivity of the sensor is evaluated in function of the refractive index of the cover. The effective refractive index N can be decreased to ns by decreasing nc , therefore the normal symmetry waveguide can operate close to the cut-off point26.
The cut-off waveguide thickness and the resonance wavelength of the modes are calculated using the analytical Eqs. (1–3) by changing nC=1.28−1.45 and keeping dF = 185 nm. The wavelength shift for the two TM modes is shown in Fig. 6a. As it can be observed the cut-off point of the TM1 mode is at nC=1.3857 . The guided wave- length at the cut-off point of the TM1 mode is λ = 528.78 nm. The reflection spectrum of the modes calculated with the full/wave electromagnetic solver for different nc values is plotted in Fig. 6b,c. As it can be observed the wavelength shift is continuous, and the intensity of the peeks are constant in case of the TM0 mode. However, by approaching the cut-off point at λ ≈ 529.1 nm the wavelength shift of the TM1 mode decreases and this peak disappears.
The positions of the resonant peaks are calculated for the waveguide film thicknesses dF = 175 nm, 180 nm, 185 nm, 190 nm by varying the refractive index of the cover medium from 1.27 to 1.45 in steps of 0.01. The wavelength shifts are calculated as the difference to the guided wavelength at nC=1.27 . Polynomial fittings—
order of 8 for the near cut-off and 2 for the far from cut-off—are also performed for a better visualization and to determine how the sensitivity of peak position depends on the cover refractive index as it is plotted in Fig. 7.
The numerically obtained wavelength shifts are shown with circle markers while the continuous lines are the fitted polynomial curves. The first derivatives of the fitted polynomial curves represent the RI sensitivity and are shown in Fig. 8. It can be observed that the sensitivity is almost constant in case of TM0 the mode, which is far from the cut-off, while the sensitivity of the TM1 mode decreases to zero as it reaches the cut-off point.
Figure 5. The penetration depth into the cover medium as a function of wavelength for dF = 185 nm and cover refractive index nC=1.4 and with an incidence angle of 26°. The penetration depth of the TM0 mode is 61 nm and of the TM1 mode is 203 nm as indicated with the cross marks. These values are also visualized on the corresponding magnetic field distributions with orange dashed lines. The magnetic field distributions are calculated by CST Studio Suit37.
Figure 6. (a) The dc cut-off curves and the resonance wavelengths for the TM0 and TM1 modes with an incidence angle of 26° for decreasing nC from the analytical calculations. (b,c) The reflection spectra of the TM0
and TM1 modes for several values of the cover refractive indices from the numerical simulations. Changing the cover refractive index not only shifts the location of the resonant peaks, but approaching the cut-off point at λ ≈ 529.1 nm the intensity of the TM1 mode decreases sharply while the wavelength shift became less significant.
It can also be seen that the TM1 mode disappears continuously around the cut-off point in a certain range of nC.
www.nature.com/scientificreports/
The numerical calculations reveal that the wavelength position of the peaks is highly influenced by the changes of the cover refractive index when the resonant peaks are far from the cut-off point. However, in case of near to the cut-off operation, the wavelength change becomes less significant and it reaches zero at the cut-off point. By modifying the waveguide thickness the operation of the sensor can be shifted. The simulations indicate that due to its linear behavior it is beneficial to use the far-from cut-off resonance for wavelength shift measurements.
In the following the intensity change of the reflection peaks is investigated. The intensity values are calculated by integrating a 0.25 nm wide range of the reflection peaks with an excitation amplitude of 1. This range is suit- able because it is negligibly influenced by the reflection baseline and it can be easily implemented by a bandpass optical element in a measurement setup. In Fig. 9 the integrated peak intensity values are plotted in the function of the cover refractive index for different waveguide film thicknesses. The numerically obtained peak intensity values are shown with circle markers and the polynomial fittings—order of 9 for the near cut-off and 1 for the far from cut-off—with continuous curves. The first derivatives of the fitted polynomial curves, which represent the sensitivity of the intensity are shown in Fig. 10.
The numerical calculations revealed that far from the cut-off the refractive index changes of the cover medium has almost no effect on the intensity of the reflection peak. However, when the peak is near the cut-off the intensity is highly influenced by the changes of the cover refractive index. By decreasing the refractive index of the cover medium, the intensity of the reflection peak also decreases near the cut-off and it reaches the base reflection intensity at the cut-off point at certain nc values. Between these two points, the intensity change has Figure 7. The guided-mode resonance wavelength shifts obtained from full wave electromagnetic simulations (circle markers) are fitted with polynomials (continuous curves) for the near cut-off (a) and far-from cut-off (b) modes in function of the refractive index of the cover medium for different waveguide film thicknesses. The wavelength shifts are relative to the resonant peak at nC=1.27 . The wavelength shift is linear in case of the TM0
mode. However, the wavelength shift of the TM1 peak becomes less significant approaching the cut-off point.
Figure 8. The sensitivity of the wavelength shift as a function of the refractive index of the cover medium for the near cut-off (a) and far from cut-off (b) resonant peaks at four different waveguide film thicknesses.
The curves were created with derivation of a polynomial fitted curves of Fig. 6. It is clearly seen that while the wavelength sensitivity is almost constant in case of TM0 (far from cut-off) peak, the sensitivity in case of TM1
(near cut-off peak) decreases to zero approaching the cut-off point.
a remarkably high sensitivity. The maximal sensitivity and the sensing range can be further tuned by changing the thickness of the waveguide film. Based on these results, we recommend using the TM1 peak near cut-off in setups, which measure the intensity.
The waveguide mode does not exists for wavelengths larger than the cut-off point, therefore the resonant peak also disappears at the cut-off point, which results in a large penetration depth into the substrate medium28–30. As the mode penetrates further into the substrate the overlap with the corrugation decreases. Thus, the scattering efficiency decreases and an increase in the quality factor is expected. This is observed in Fig. 6b. Numerical simu- lations near the cut-off resonance are performed for dF = 185 nm while the cover refractive index is decreased to illustrate the behavior of the magnetic field through the cut-off point. The simulated magnetic field distributions for six different nC values, which correspond to the intensity curves of Fig. 9a are shown in Fig. 11. The cover refractive index values are selected in such a way to clearly illustrate the characteristics of the field distributions before, at and after the cut-off point. The guided mode disappears around nC=1.33−1.32 and the localization of the magnetic field decreases as the wave is not confined anymore in the waveguide.
The bulk refractive index sensitivity is an important parameter in refractometry and in living cell based applications. Next, we demonstrate that the near cut-off mode can be also potentially employed to monitor the presence of thin biological layers on the surface of the waveguide. For this purpose, we simulated the same structure with a standard puffer solution for biological measurements with cover refractive index nC=1.33 and we changed the thickness ( dA ) of an additional biological layer on the surface of the sensor with refractive index nA=1.45 , which value is general for biological samples. The resulted wavelengths and intensities can be seen in Fig. 12.
We have applied linear regression on the simulated values of maximum wavelengths and intensities of reflec- tion (see Fig. 12 black dashed line) to determine the surface sensitivity of the sensor:
Figure 9. The intensity of the reflection peaks obtained from full wave electromagnetic simulations (circle markers) are fitted with polynomials (continuous curves) for the near cut-off (a) and far-from cut-off (b) modes in function of the refractive index of the cover media for different waveguide film thicknesses. Far from cut-off the cover refractive index negligibly influences the intensity, while near cut-off the intensity of the mode is highly influenced by the cover refractive index.
Figure 10. The sensitivity of the intensity difference for the near cut-off (a) and far from cut-off (b) modes as a function of the refractive index of the cover layer for different waveguide film thicknesses.
www.nature.com/scientificreports/
Figure 11. (a) The intensity of the near cut-off peak as a function of the refractive index of the cover layer for dF = 185 nm waveguide film thickness. The magnetic field distributions corresponding to the refractive index values marked with circles are shown in (b). Decreasing the cover refractive index, the localization of the magnetic field decreases, and after the cut-off point, which is around nC=1.33−1.32 the wave propagates through the waveguide. The magnetic field distributions are calculated by CST Studio Suit37.
where the maximum wavelength of the reflection and the thickness dA are measured in nm, while the intensity is normalized to the intensity of the incident light. Figure 12 confirms the linearity of the sensor response, an important feature in kinetic measurements and further evaluation42.
As we have already shown in this section that the tuning of dF has a huge effect not only on the location of the cut-off point but also on the sensitivity of the peak intensity. It is already shown that the shallower the grating, the narrower the peak, which results in a higher quality factor due to the decreased scattering efficiency29. We found it important to show also the peak behavior in case of different grating depths. We extended the Supplementary materials with these informations.
Experimental demonstration of cut‑off sensing. To validate the key numerical finding that the inten- sity decreases near cut-off and the wavelength shift vanishes, we performed experimental reflection measure- ments on grating waveguides embedded in the bottom of a microplate (Epic 96-well plate by Corning), which enables an easy exchange of the fluid on top of the grating waveguide. The grating waveguides have a periodicity of ~ 500 nm and a high index layer of ~ 120 nm. The experimental setup is shown in Fig. 13a. A halogen lamp is used as excitation light source. It is coupled into a multimode fiber. After exiting the fiber the excitation light is collimated with a collimation lens to a divergence angle of smaller than 1° (checked by beam diameter of ~ 5 cm in projection to a wall in ~ 2 m distance). The incidence angle α of the excitation light is varied. The excitation and reflected light are passed through a circular polarization filter. We used this circular polarization filter to obtain solely the guided-mode resonance and suppress the off-resonance background light43,44. The reflected light is coupled with a second lens into a second fiber and guided to a spectrometer. The spectrum is measured from 444 to 796 nm with a resolution of 0.34 nm. Two sets of experiments are conducted. In the first set of experiments the incidence angle is varied from α = 0° to α = 70° in 2° steps for water as the analyte. In the second sets of experiments spectra are measured for a fixed incidence angle of 26° for different analytes. To investigate the wavelength shift with changing refractive index, we used a water-glycerin dilution for tuning the refractive index from 1.33 (pure water) to 1.47 (pure glycerin). In typical biosensors, the refractive index of interest indeed starts at 1.33, as most biological reagents are water based, and goes up to values similar to the refractive index of glycerin.
Figure 13b shows the reflected intensity as a function of incidence angle and wavelength with water as analyte as a heat map. The values are normalized to the lamp spectrum and interpolated. Due to the circular polar- izer, both TE and TM resonances are clearly observed and the background is suppressed. The resonances were identified by using a linear polarizer at different angles. It is clearly visible that the TE1 wavelength is at cut-off around 26° incidence angle. The mode is not supported at smaller incidence angles and the resonance intensity is reduced upon approaching the cut-off. These results are in line with our intensity results presented in Ref.26 and the numerical results in this paper. Compared to the simulation results the experimental results are shifted and the TM1 resonance is not observed. This can be explained by the uncertainty in the refractive index properties.
Figure 13c,d show the TE1 and TM0 spectra for four different analyte refractive indices. These spectra are not normalized to the lamp spectrum and the decreasing lamp intensity for higher wavelengths is clearly visible in the TM0 intensity. Note that the change in intensity is highly setup dependent. It would require a more precise calibration to remove the system response. The system response can be used as an advantage to get a higher (5) (nm)=0.0134·dA+529.1455 nm
(6) Intensity (a.u.)=0.0101(1/nm)·dA+ 0.4211
Figure 12. The maximum wavelengths (a) and the intensity (b) of the reflection peaks for the near cut-off mode in function of the additional biological layer thickness. We also fitted a line on the simulated data (black dashed lines). We used nC = 1.33 as a standard cover refractive index of the puffer solution for biological measurements and dF = 185 nm as before for the main experiments with incident angle of 26°. We changed the thickness (dA) of an additional biological layer from 0 to 10 nm on the surface of the sensor with refractive index nA = 1.45, which refractive index value is common for biological samples.
www.nature.com/scientificreports/
Figure 13. (a) Experimental setup for reflection measurements with grating waveguides with an incidence angle of 26°. (b) Intensity results as a function of incidence angle and wavelength (normalized to lamp spectrum and interpolated) for nc = 1.33. (c) Spectra of TE1 mode near cut-off for four different refractive indices and (d) spectra of TM0 more far-from cut-off. (e) Wavelength shift for the near cut-off TE1 resonance and (f) far from cut-off results for the TM0 mode for a refractive index sweep.
is approached. The combined increase in quality factor and reduction of amplitude leads to an overall decrease in the mode intensity as predicted by the simulations.
Conclusions
We have investigated the near cut-off operation of resonant waveguide gratings for sensing by simulation tech- niques. Near cut-off and far from cut-off waveguide modes are investigated and their typical characteristics for sensing purposes are compared. The results of the numerical simulations performed by full wave electromagnetic solvers correspond with the simplified analytical calculations.
First, we presented the magnetic field distribution of two resonant peaks, which are suitable for sensing. The electromagnetic field is localized into the waveguide much stronger in case of the reflection peak, which cor- responds for the far-from cut-off mode. By contrast, the reflection peak of the near cut-off resonance produces more than three times larger penetration depth into the sensing space. This larger sensing depth allows the sensing of larger biological objects and can monitor the changes of the refractive index further away from the waveguide surface.
Furthermore, parameter sweeps were performed to analyze the guided wavelength and the intensity of the reflection peak for different waveguide thicknesses and cover material parameters. The simulations indicate that new types of sensors can be developed by measuring the intensity near the cut-off point. This type of measure- ment allows a remarkably high sensitivity for the refraction index variations of the waveguide cover media com- pared to the traditional wavelength shift measurement. Integrating the guided-mode resonance with light emit- ting diodes can be one solution to create cost-effective and straightforward sensors based on intensity readout10. We have demonstrated the flexibility of the design, which can be tailored to the needs of different applica- tion with different sensitivity and cut-off point by changing the parameters of the waveguide. To support these theoretical results we compared the numerical findings with experimental reflection measurements and found a reasonable match regarding the cut-off behavior.
The proposed sensing mechanism using the near cut-off resonance offers an exceptionally simple design in intensity interrogation measurements. The measurement setup has high sensitivity near to the cut-off point without a need of a wavelength cut-off filter. This compact solution could potentially eliminate vibration noises and it can lead to increased Q-factor. Moreover, such a sensor is an excellent candidate for miniaturization and for low cost production for a wide range of applications.
Data availability
The dispersion of the waveguide parameter, which is used to support the findings of this study can be found on the webpage of Mikhail Polyanskiy35. The other sensor structure parameters are included within the article. Two of the animations of the wave propagations for near cut-off and far from cut-off resonances can also be found in the Supplementary materials.
Received: 1 April 2021; Accepted: 7 June 2021
References
1. Estevez, M.-C. et al. Trends and challenges of refractometric nanoplasmonic biosensors: A review. Anal. Chim. Acta 806, 55–73 (2014).
2. Nirschl, M., Reuter, F. & Vörös, J. Review of transducer principles for label-free biomolecular interaction analysis. Biosensors 1(3), 70–92 (2011).
3. Fan, X. et al. Sensitive optical biosensors for unlabeled targets: A review. Anal. Chim. Acta 620(1–2), 8–26 (2008).
4. Fang, Ye. Label-free cell-based assays with optical biosensors in drug discovery. Assay Drug Dev. Technol. 4(5), 583–595 (2006).
5. Wegener, J. Label-Free Monitoring of Cells in vitro (Springer Nature, 2019).
6. Soler, M., Huertas, C. S. & Lechuga, L. M. Label-free plasmonic biosensors for point-of-care diagnostics: A review. Expert Rev.
Mol. Diagn. 19(1), 71–81 (2019).
7. Mauriz, E., García-Fernández, M. C. & Lechuga, L. M. Towards the design of universal immunosurfaces for SPR-based assays: A review. TrAC Trends Anal. Chem. 79, 191–198 (2016).
8. Fang, Ye. Ligand–receptor interaction platforms and their applications for drug discovery. Expert Opin. Drug Discov. 7(10), 969–988 (2012).
9. Piliarik, M., Bocková, M. & Homola, J. Surface plasmon resonance biosensor for parallelized detection of protein biomarkers in diluted blood plasma. Biosens. Bioelectron. 26(4), 1656–1661 (2010).
10. Estevez, M. C., Alvarez, M. & Lechuga, L. M. Integrated optical devices for lab-on-a-chip biosensing applications. Laser Photonics Rev. 6(4), 463–487 (2012).
www.nature.com/scientificreports/
11. Agocs, E. et al. Grating coupled optical waveguide interferometry combined with in situ spectroscopic ellipsometry to monitor surface processes in aqueous solutions. Appl. Surf. Sci. 421, 289–294 (2017).
12. Patko, D. et al. Label-free optical monitoring of surface adhesion of extracellular vesicles by grating coupled interferometry. Sens.
Actuators B 188, 697–701 (2013).
13. Joannopoulos, J. D., Villeneuve, P. R. & Fan, S. Photonic crystals: Putting a new twist on light. Nature 386(6621), 143–149 (1997).
14. Sakoda, K. Optical Properties of Photonic Crystals (Springer Science & Business Media, 2004).
15. Cunningham, B. T. et al. Recent advances in biosensing with photonic crystal surfaces: A review. IEEE Sens. J. 16(10), 3349–3366 (2015).
16. Shamah, S. M. & Cunningham, B. T. Label-free cell-based assays using photonic crystal optical biosensors. Analyst 136(6), 1090–
1102 (2011).
17. Chen, W. et al. Planar photonic crystal biosensor for quantitative label-free cell attachment microscopy. Adv. Opt. Mater. 3(11), 1623–1632 (2015).
18. Fu, F. et al. Cells cultured on core–shell photonic crystal barcodes for drug screening. ACS Appl. Mater. Interfaces 8(22), 13840–
13848 (2016).
19. Fang, Y. Label-free biosensors for cell biology. Int. J. Electrochem. https:// doi. org/ 10. 4061/ 2011/ 460850 (2011).
20. Sztilkovics, M. et al. Single-cell adhesion force kinetics of cell populations from combined label-free optical biosensor and robotic fluidic force microscopy. Sci. Rep. 10(1), 1–13 (2020).
21. Zaytseva, N. et al. Microfluidic resonant waveguide grating biosensor system for whole cell sensing. Appl. Phys. Lett. 98(16), 163703 (2011).
22. Ferrie, A. M., Wu, Q. & Fang, Y. Resonant waveguide grating imager for live cell sensing. Appl. Phys. Lett. 97(22), 223704 (2010).
23. Fang, Y. et al. Resonant waveguide grating biosensor for living cell sensing. Biophys. J. 91(5), 1925–1940 (2006).
24. Sahoo, P. K., Sarkar, S. & Joseph, J. High sensitivity guided-mode-resonance optical sensor employing phase detection. Sci. Rep.
7(1), 1–7 (2017).
25. Barth, I. et al. Common-path interferometric label-free protein sensing with resonant dielectric nanostructures. Light 9, 1–9 (2020).
26. Nazirizadeh, Y. et al. Intensity interrogation near cutoff resonance for label-free cellular profiling. Sci. Rep. 6, 24685 (2016).
27. Horvath, R. et al. Monitoring of living cell attachment and spreading using reverse symmetry waveguide sensing. Appl. Phys. Lett.
86, 071101 (2005).
28. Horvath, R., Skivesen, N. & Pedersen, H. C. Measurement of guided light-mode intensity: An alternative waveguide sensing principle. Appl. Phys. Lett. 84(20), 4044–4046 (2004).
29. Horvath, R. et al. Analytical and numerical study on grating depth effects in grating coupled waveguide sensors. Appl. Phys. B 81(1), 65–73 (2005).
30. Horvath, R., Lindvold, L. R. & Larsen, N. B. Reverse-symmetry waveguides: Theory and fabrication. Appl. Phys. B 74, 383–393 (2002).
31. Jahns, S. et al. Handheld imaging photonic crystal biosensor for multiplexed, label-free protein detection. Biomed. Opt. Express 6(10), 3724–3736 (2015).
32. Paulsen, M., Sabrina, J. & Martina, G. Intensity-based readout of resonant-waveguide grating biosensors: Systems and nanostruc- tures. Photonics Nanostruct. Fundam. Appl. 26, 69–79 (2017).
33. Nazirizadeh, Y. et al. Low-cost label-free biosensors using photonic crystals embedded between crossed polarizers. Opt. Express 18, 19120–19128 (2010).
34. Deb, H. et al. Enhanced sensitivity of guided mode resonance sensor through super-mode excitation at near cut-off diffraction.
Opt. Laser Technol. 132, 106517 (2020).
35. Polyanskiy, M. N. Refractive index database. https:// refra ctive index. info (2008).
36. Gao, L., Lemarchand, F. & Lequime, M. Exploitation of multiple incidences spectrometric measurements for thin film reverse engineering. Opt. Express 20(14), 15734–15751 (2012).
37. CST Studio Suite. Electromagnetic Field Simulation Software, Release version 2021.3. https:// www. 3ds. com/ produ cts- servi ces/ simul ia/ produ cts/ cst- studio- suite/ (2021).
38. Tiefenthaler, K. & Lukosz, W. Sensitivity of grating couplers as integrated-optical chemical sensors. JOSA B. 6(2), 209–220 (1989).
39. Orgovan, N. et al. Bulk and surface sensitivity of a resonant waveguide grating imager. Appl. Phys. Lett. 104, 083506 (2014).
40. Tien, P. K. V. Light waves in thin films and integrated optics. Appl. Opt. 10(11), 2395–2413 (1971).
41. Desfours, C. et al. Development and characterization of ultra-porous silica films made by the sol–gel method Application to biosensing. Appl. Phys. A 114(2), 435–443 (2014).
42. Saftics, A. et al. Data evaluation for surface-sensitive label-free methods to obtain real-time kinetic and structural information of thin films: A practical review with related software packages. Adv. Colloid Interface Science 2021, 102431 (2021).
43. Nazirizadeh, Y. et al. Optical characterization of photonic crystal slabs using orthogonally oriented polarization filters. Opt. Express 16(10), 7153–7160 (2008).
44. Lüder, H., Paulsen, M. & Gerken, M. Photonic crystal slab between orthogonal polarizers: Details on the guided mode resonance wavelength. Opt. Quant. Electron. 52(3), 1–14 (2020).
Author contributions
B.K. performed the analytical calculations regarding the waveguide modes with the supervision of R.H. who initiated the work; B.K. set up the proper numerical simulation environment and performed the electromagnetic simulations with the supervision of Zs.Sz.; B.K. evaluated and compared the analytical with the numerical results and gave explanations regarding biosensing based on the intensity measurement with the supervision of R.H.
and Zs.Sz.; Y.N., F.K. and M.G. designed and evaluated the experiments with the RWG sensor regarding the peak intensity measurements.; B.K. designed the figures; B.K., Zs.Sz., Y.N., F.K., M.G. and R.H. wrote and edited the manuscript. All of the authors read and approved the final manuscript.
Funding
The present work was supported by the Hungarian Academy of Sciences [Lendület (Momentum) Program], the projects of National Research, Development and Innovation Office of Hungary (NKFIH) [ERC_HU, KH_17, KKP_19 and K-132050]. The work at Kiel University was supported in part by ZIM (Project VAMP, ZF4558806SB9).
Competing interests
The authors declare no competing interests.
Creative Commons licence, and indicate if changes were made. The images or other third party material in this article are included in the article’s Creative Commons licence, unless indicated otherwise in a credit line to the material. If material is not included in the article’s Creative Commons licence and your intended use is not permitted by statutory regulation or exceeds the permitted use, you will need to obtain permission directly from the copyright holder. To view a copy of this licence, visit http:// creat iveco mmons. org/ licen ses/ by/4. 0/.
© The Author(s) 2021