SZENT ISTVÁN EGYETEM
BUDAI CAMPUS
ÉLELMISZERTUDOMÁNYI KAR
ÉLELMISZERIPARI MÛVELETEK ÉS GÉPEK TANSZÉK
SEPARATION OF OIL-IN-WATER EMULSION FOR ENVIRONMENTAL PROTECTION
PhD thesis
Xianguo HU
Budapest, 2002
1. INTRODUCTION AND OBJECTIVES
The food processing industry seeks effective technologies to remove fats, oils and greases from food processing wastewater at acceptable costs. The baking and dairy industries, oil extraction (e.g., olive, soybean, cotton seed oil), fish processing, meat and poultry industries, as well as manufacturers of oil-containing foods (e.g., margarine and salad dressing) face the problem of reducing the oil contaminant load in downstream wastewater systems. Oily waste emulsions are also generated by various industries (such as mechanical, petroleum, cosmetics, pharmaceutical, agriculture, leather and so on) and subsequently discharged into the natural environment, and create major ecological problems throughout the world. It is of great significance to study the separation of oil-in-water emulsion.
The traditional methods for the separation of oily emulsions can be classified as chemical, mechanical and thermal. These methods of oily wastewater treatment are frequently not efficient enough, especially when the oil droplets are finely dispersed and their concentration is very low.
The ultrafiltration (UF) membrane techniques related to polymeric material science and engineering, lubrication science, applied surface chemistry and chemical engineering etc, seem to be a promising method for the separation of emulsions in order to meet the needs of emulsion, dispersion, cooling and lubrication etc. Its advantage is a high efficiency in conjunction with a high quality of the permeate, not achievable by other methods, and beside the low operating costs. UF is also a physical treatment process to remove contaminants from an oily wastewater and permits sewer discharge, and can be used to comply with strict environmental laws as well as provide a first step towards water recycling and oil recovery.
Until now the basis for selecting membranes and membrane operating conditions remains largely empirical, which includes the choice of molecular weight cut-off (MWCO), pore size and distribution, transmembrane pressure, temperature, flow velocity, cleaning of membrane and others to achieve adequate rejection of emulsified oil and chemical oxygen demand (COD) in the permeate while maintaining permeate flux.
Therefore, the first objectives of this investigation are the establishment of operation conditions and selection of membrane parameters to minimize concentration polarization and membrane fouling, the achievement of adequate rejections of COD and oil, and the development of a suitable pilot scale-up procedure involving membrane module arrangements, operation parameters and membrane nature to obtain high water recovery essential in oil-in-water emulsion treatment.
On the other hand, flux decline due to concentration polarization and membrane fouling is a serious problem in membrane filtration. Some models, especially film theory and the resistance-in-series model, have been modified for ultrafiltration of oil-in-water emulsion by some authors. However, there is no generally accepted, simple and practical comprehensive model, because of the large membrane variety and composition complexity of oil-in-water emulsions.
The second goal of this research is to introduce a calculation method of gel concentration and to develop a model which can describe the flux decline behavior due to membrane fouling during cross-flow UF of oil-in-water emulsions.
To summarize the objectives of this work: These researches were motivated by an increasing interest in employing membrane technologies for removing water from oily water supplies and wastewater streams, and try to solve the problem in which the theoretical results were not in a good agreement with the experimental values in actual ultrafiltration process.
2. MATERIALS AND METHODS
2.1 Apparatuses
The experiments were carried out on laboratory and pilot scale ultrafiltration apparatuses.
The experiments were performed with two kinds of laboratory scale experimental set-up:
the first one (TZA 944 ultrafiltration cell) was used to evaluate the effects of membrane nature and feed concentration and the other one (model ND-2) that of the operation conditions. The membrane areas of TZA 944 and ND-2 were 44 and 35 cm2 respectively.
The transmembrane pressure was varied in a range of 1-6 bar. The variation of temperature was between 20-60oC. The cross-flow velocity selected were 0.5, 0.9 and 1.5 m/s.
A pilot-scale MA-CO ultrafiltration unit was equipped with industrial size spiral-wound ultrafiltration membrane modules. Pressure data were taken from pressure transducers located at the membrane inlet and outlet. The recycled retentate and the permeate flow rates were measured by variable section flowmeters. The pilot scale measurement were performed at 5 × 10³ l/h recycle flow rate, 3 bar feed pressure and 40oC temperature.
2.2 Investigated membranes and emulsion properties
Tables 1 and 2 show the physical and filtration properties of the investigated membranes.
Table 1 Properties of UF membranes in UTZ 944 apparatus Membrane
Trademark Membrane Material1) MWCO2) [kD]
Water Flux3) [l/m² h]
Max. Temp.
[°C]
Mavibran FS 102-05 PES 10 550 60 Mavibran FS 202-09 PES 20 700 60 Mavibran FF 20-K5 PVDF 20 500 60 Mavibran FF 502-04 PVDF 60 1 000 60
Celfa CMF-DY-010 PAN 10 250 45
Celfa CMF-DY-040 PAN 40 700 45
Celfa CMF-DS-040 PES 40 400 95
Celfa CMF-DS-100 PES 100 800 95
Dow FS 50PP PVDF 50 300-700 60
Dow FS 40PP PVDF 100 300-800 60
Dow RC 70PP Cellulose4) 10 150-250 60 Dow ETNA 20A Coating5) 20 250-450 60 1: PES: polyethersulfone; PVDF: polyvinylidene fluoride; PAN: polyacrylonitrile. 2: MWCO: molecular
weight cut-off. 3: feed pressure 3 bar and temperature at 20°C. 4: regenerated cellulose. 5: coated, hydrophilic.
Table 2 Properties of UF membranes in ND-2 set-up Membrane
Trademark
Membrane Material MWCO [kD]
Water Flux1) [l/m² h]
Max. Temp.
[°C]
Hochest TS 6V-205 PES 100 800 60 Mavibran FP 055 A PVDF 60-80 1 000 60
Mavibran FS 202-09 PES 20 700 60 1: Feed pressure 3 bar and temperature at 20°C.
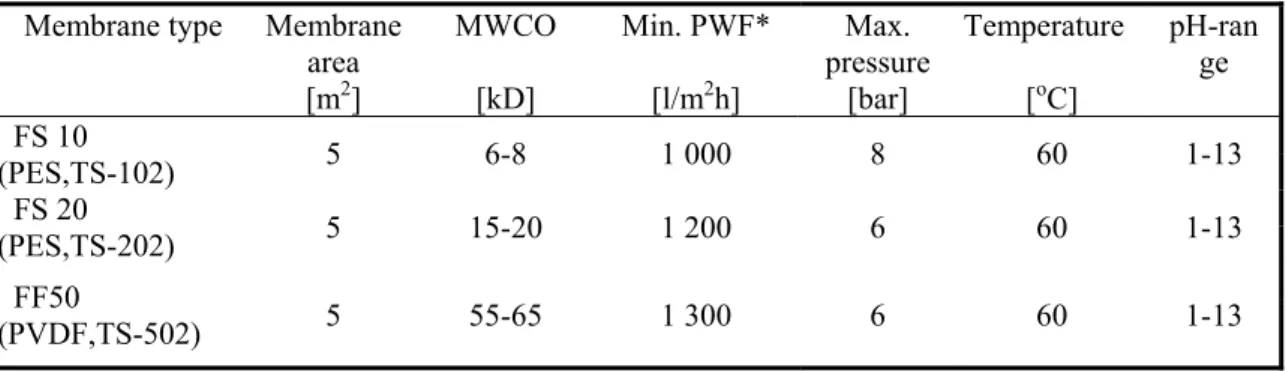
The pilot-scale unit was operated with three industrial spiral-wound membrane modules, denoted as TS-102 (PES), TS-202 (PES) and TS 502 (PVDF) manufactured by Zoltek Magyar Viscosa Corporation. TS-102, TS-202 and TS 502 membranes had a MWCO of 6-8, 15-20 and 55-65 kD, respectively. Each membrane had a transfer area of 5 m2.
Table 3 Properties of industrial spiral wound modules used in the pilot scale Membrane type Membrane
area [m2]
MWCO [kD]
Min. PWF*
[l/m2h]
Max.
pressure [bar]
Temperature [oC]
pH-ran ge FS 10
(PES,TS-102) 5 6-8 1 000 8 60 1-13 FS 20
(PES,TS-202) 5 15-20 1 200 6 60 1-13 FF50
(PVDF,TS-502) 5 55-65 1 300 6 60 1-13
* pure water flux.
2.3 Materials and Methods
A stable oil-in-water emulsion was used by dispersing the engine oil with emulsifier in deionized water.
The COD values (mg/l) were measured using Potassium Dichromate Method. The oil concentrations (mg/l) were determined by Mineral Oil--Ultraviolet Spectrophotometry. The topography of membrane surface and compositions of fouling substances were analyzed with the help of Fourier Transform Infrared (FT-IR) and Scanning Electron Microscopy (SEM) respectively.
For data acquisition and fitting of mathematical models the LEASQ-Memb program was used.
3. RESULTS
3.1 Influence of membrane nature and operation parameters on filtration characteristics in laboratory scale
3.1.1 Effect of membrane intrinsic nature in laboratory units
Twelve types of polymeric ultrafiltration membranes with different MWCO and pore size were used to separate contaminant oils from emulsions. With the same nominal MWCO, 40 kD, the permeate flux of PAN is much higher than that of hydrophobic PES. The rejection coefficients of Celfa and Dow membranes were more than 99%; the rejection coefficients of Mavibran membranes were about 98-99%. The permeate flux was higher in case of membrane with high MWCO at low feed oil concentration
3.1.2 Effect of operation parameters in laboratory units
The permeate flux was directly proportional to the transmembrane pressure at a higher emulsion concentration and lower pressure. When the operation pressure was over a critical value, the flux was not influenced by the operating pressure and then reached a plateau.
The experimental membranes have satisfactory results in COD and oil concentration in permeate at low feed concentration (0.5 vol.%). At high feed concentration (5.0 vol.%) their COD values increased, whereas their oil concentrations were lower.
The increase of the temperature from 20oC to 60oC caused 20-100 % increase in the permeate flux. An increase in the flow velocity improved the shear state at the membrane surface, reduced concentration polarization and enhanced flux to a certain extent.
3.2 Evaluation of pilot unit scale results
The permeate flux of TS-202 (PES) with a higher MWCO was much higher than that of TS-102 (PES) with lower MWCO. The PVDF membrane was more suitable for treating oil-in-water emulsion than PES membrane due to high permeate flux. Their oil rejections were about 99%. The COD rejection in pilot was lower than that in laboratory, but they were over 95%.
The flux in pilot operation increased with the transmembrane pressure, either on TS-102 or on TS-202 membranes. The permeate flux was almost proportional to the transmembrane pressure at lower feed concentration (0.5%).
3.3 Cleaning and characterization of membrane
The FT-IR spectra of substances on the different membrane surfaces before and after ultrafiltration, and their subtraction spectrum were analyzed. It was found that the peaks are the typical peaks of hydrocarbon. Using SEM the analysis results from IR were confirmed.
The main foulants are oil droplets and in a certain extent the surfactants.
Using micellar solution during membrane cleaning produces a microemulsion combined with the oil adsorbed on the membrane structure, therefore removed the foulants completely. The results show that using micellar solution the process achieved recovery of the fouled membrane.
3.4 Mathematical modeling of gel concentration and membrane fouling
A model used to predict the oil concentration at the membrane surface was presented on the base of resistance-in-series model and mass transfer theory.Another new model for membrane fouling was introduced for oil-in-water emulsion. This model was expected to have a wider application because it was based on the membrane properties and application system, and the effects of the operation parameters. It reflects not only the effects of membrane fouling caused by the membrane nature on the flux, but also the operation parameters.
3.5 New scientific results
1.
It was found that the chemical nature of membrane influences the separation performance. From hydrophilic property towards hydrophobic characteristic the investigated membranes can be arranged as follows: Cellulose > PAN > PES > PVDF. The permeate flux at 0.5 vol.% feed oil concentration reached higher values on hydrophilic than on hydrophobic membranes. The next table shows that PAN membrane with hydrophilicgroup (−CN) has high permeate flux. With the same nominal MWCO, the permeate fluxes of PAN membrane (DY-040 and DY-010) are higher than those of hydrophobic PES membranes (DS-040 and FS102-05) at feed oil concentration of 0.5%. This is probably an effect of the expected superior oil-repelling nature of the former membranes. Similar behaviour was observed comparing PES (DS-100) and PVDF (FS-40PP) membranes with 100 kD of MWCO.
Membrane Material MWCO [kD] Average permeate flux at feed concentration of 0.5%, [l/m² h]
DY-040 PAN 40 300.8
DS-040 PES 40 138.2
DY-010 PAN 10 177.9
FS102-05 PES 10 153.2
DS-100 PES 100 296.4
FS 40PP PVDF 100 185.1
2.
The effects of MWCO on flux depends on feed oil concentration. Comparing membranes of the same material but with different MWCO it can be established that high MWCO may lead to high flux at lower feed oil concentration; while its influence becomes weaker at high feed oil concentration. PES membranes have the same tendency at low feed concentration.At high feed concentration the flux of PES decreased with increasing MWCO, because the flux of PES membrane was easy to be influenced by gel layer. The higher the MWCO of PES is, the more serious the gelling tendency is.
Membrane Material MWCO [kD] Flux, [l/m² h]a) Flux, [l/m² h]b)
DY-010 PAN 10 177.9 81.5
DY-040 PAN 40 300.8 91.7
DS-040 PES 40 138.2 55.6
DS-100 PES 100 296.4 81.3
a) Feed oil concentration 0.5 vol. %; b) Feed oil concentration 5 vol. %
3.
Complete separation of oil from emulsion was not attained if the pure water flux of the hydrophilic membrane exceeded a critical value, because this low viscosity compound was easily sheared into small droplets which might pass the membrane freely. The permeate flux was better in case of PAN membrane with a higher pure water flux at low feed oil concentration, however, its oil concentration and COD in permeate were higher.Membrane Material MWCO [kD]
Pure water flux, [l/m2h]
Flux [l/m² h]
COD*
[mg/l]
OIL**
[mg/l]
DY-010 PAN 10 250 177.9 120 5.5 DY-040 PAN 40 700 300.8 155 46 DS-040 PES 40 400 138.2 135 13.3 DS-100 PES 100 800 296.4 140 2 Feed oil concentration: 0.5 vol. %; pressure: 3 bar; temperature: 40oC
COD* means the COD in permeate; OIL** means the oil concentration in permeate
4.
The effect of transmembrane pressure was based on the variation of membrane resistance which was related to the concentration polarization and gel polarization. At lower emulsion concentration (0.5 vol.%), the permeate flux increased almost linearly with the transmembrane pressure. At higher emulsion concentration (5.0 vol.%) the effect of pressure on the permeate flux depended on the magnitude of pressure. As the transmembrane pressure is over a critical value, the flux is controlled by gel layer. The critical transmembrane pressure was about 2 bar for FS 202-09 and FP 055A, about 3 bar for TS 6V membrane with the experimental set up of ND-2.5.
The effect of pressure on the flux is still controlled by the temperature. At different temperatures the extent of pressure-effect is different. The flux increases with temperature at either lower or higher feed concentration because of the enhancement of diffusion coefficient. This kind of synergic effect for pressure and temperature on the permeate flux (l/m2h) can be identified by the results of FP 055A at feed concentration of 5 vol.%:Transmembrane pressure, [bar]
Flux, [l/m2h]
Temp.
[oC] 1 2 3 4 5 6
30 85.8 90 103 103 119 130
50 94.2 98.6 106.1 111.4 133 144
60 102.8 107.2 114.5 120 141.5 148.6
6.
The scale up experiments substantially proved that using the same membrane there is no significant difference in the oil rejection and COD rejection either in laboratory or in pilot scale. However the permeate flux of pilot was lower than that of laboratory, which is believed to be caused by the different membrane modules (the spiral wound module was used in pilot and plate and frame module with flat sheet membranes was used in laboratory scale).Membrane Type Permeate flux [l/m2h]
Oil rejection [%]
COD rejection [%]
Lab. 153.2 99.9 98.9
FS 10 (PES, TS-102)
Pilot 77.7 99.6 95.2
Lab. 243.7 98.6 98.2
FS 20 (PES, TS-202)
Pilot 128.2 99.7 95.6
Lab. 246.4 99.9 98.6
FF 50 (PVDF, TS-502)
Pilot 196.2 99.7 97.0
* Feed emulsion concentration 0.5 vol. %
7.
Using Infrared (IR) and Scanning Electron Microscopy (SEM) techniques for the investigation of membrane surface it was found that there are lots of oil drops adsorbed on the membrane surface after the oil-in-water emulsion runs were taken. The most foulants were oil droplets and surfactants under the present experimental conditions. The cleaning procedure, using micellar solution, removed the oil droplets from the surface.8.
With respect to the mass transfer theory and resistance-in-series equation of ultrafiltration, a calculation model for oil concentration in boundary layer was expressed by the following equation:) (
) ln (
P R
P R
R P C
K C
m g
m b
m
∆ +
= ∆ +
= ∆
α η
η
where K is the coefficient of mass transfer, (m h-1); Cm, (vol.%) and Cb, (vol.%) are the oil concentrations at the membrane surface and in the bulk emulsion of feed respectively; η is the permeate viscosity, (N s m-2); ∆P is transmembrane pressure, (bar); Rm is the intrinsic membrane resistance, (m-1) and Rg, (m-1) is the gel-layer resistance; α is constant, (m-1 bar-1).
After rearranging the above equation, the oil concentration at the membrane surface (Cm) can be attained, as follows:
∆ +
= ∆
) (
exp 1
P R
P C K
C
m b
m η α
On the basis of the above equation the oil concentration can be calculated approximately within the concentration polarization region at different pressures and the gel concentration (Cg) on the membrane surface at critical pressure. As the operating pressure increases, Cm
approaches to Cg. The Cg (vol.%) was about 30 vol.% in the present experimental conditions:
Transmembrane pressure, [bar]
Cm, [vol.%]
Cb, [vol.%] 1 2 3 4 5 6
5.0 13.94 19.99 24.04 26.88 28.98 30.58 Validity of the equation: feed temperature 20-60oC, transmembrane pressure 1-6 bar. The average percent deviation is less than 0.5%.
9.
An empirical model in a form of exponential decay function was introduced to model UF membrane fouling:bt m
n b bt m
g m n
b m
w e
P R
B P C AU R e
R B P C AU
J − −
∆ + + ∆
+ = + ∆
= η( ) η( α )
Where Jw is permeate flux, (l m-2h-1); Rm is the intrinsic membrane resistance (m-1) and Rg is the gel-layer resistance, (m-1); η is the viscosity of permeate, (N s m-2); ∆P is transmembrane pressure, (bar); U is the cross-flow velocity, (m s-1); and Cb is concentration of bulk emulsion, (vol.%); t is time, (hour); A, B and b are constants for the specified ultrafiltration membrane and application system. Both constants of m and n varies between 0.3-0.8 and 0.05-0.6, respectively.
For FP 055A membrane the model of membrane fouling had the next form:
t
w b e
P P
C
J U 0.62
5 . 0
0078 . 0 0052 . 37 0 . 0 42
.
171 −
∆ +
+ ∆
=
Validity of the equation: flow velocity 0.5-1.5 m/s; transmembrane pressure difference 1-6 bar; temperature 20-60oC; feed emulsion concentration 0.5-5 vol.%. The average percent deviation is less than 16%.
4. CONCLUSIONS AND PROPOSALS 4.1 Conclusions
1. The ultrafiltration process is a feasible way to remove water from oil-in-water emulsion.
The permeate flux, oil rejection and COD in permeate of ultrafiltration performance of oil-in-water emulsion depend on the membrane nature [material, nominal molecular weight cut-off (MWCO) and pore size], membrane module type, feed emulsion components and operation conditions (feed oil concentration, transmembrane pressure, flow velocity and feed temperature).
2. The polymeric UF membranes can be used for treating oily wastewater. The hydrophilic towards hydrophobic property of the investigated membranes strongly influenced permeate
flux in this order: Cellulose > PAN > PES > PVDF. The influence of MWCO on flux depends on feed oil concentration. At lower feed oil concentration the flux increases with MWCO, while at higher feed oil concentration the growth can be neglected.
3. An increase in the transmembrane pressure, flow velocity and temperature can improve the permeate flux. At lower emulsion concentration (0.5 vol. %), the gel polarization is not obvious, the permeate flux is almost increased linearly with the transmembrane pressure. At higher emulsion concentration (5 vol. %) the effect of pressure on the permeate flux depends on the magnitude of pressure. As the transmembrane pressure is over a critical value, the flux is controlled only by gel layer. The critical pressure of investigated membranes was about 2-3 bar. In addition, increasing flow velocity and temperature enhance the flux to certain extent due to the development of shear rate at the membrane surface and the enhancement of diffusion coefficient.
4. Using Scanning Electrical Microscopy and Infrared techniques the surface of fouled membrane is analyzed. The most foulants on the membrane surfaces are oil droplets and surfactants in case of industrial oil-in-water emulsion. The membrane fouling is mainly due to the adsorption of oil on to the membrane structure which modifies the wettability of the membrane and the effective pore diameter. Complete membrane regeneration may be almost performed with a micellar solution of the sodium dodecyl sulfate − n-pentanol − water system.
5. The scale up experiments proved that there is no significant difference in the oil rejection and COD rejection either in laboratory or in pilot scale. Using industrial spiral wound module of membrane its permeate flux is a bit lower than that of flat-sheet membrane module, which is believed to be caused by the difference in hydrodynamics.
6. A new equation for calculation the oil concentration in boundary layer is introduced. The oil concentration in gel layer at the membrane surface can be calculated approximately according to the critical pressure.
7. A form of exponent equation used for describing membrane fouling was also developed.
With the help of this model it can be studied the effects of operation parameters (transmembrane pressure, feed concentration, temperature, flow velocity, viscosity) and membrane properties (intrinsic membrane resistance and gel resistance) on membrane fouling.
4.2 Proposals
1. In the industrial oil-in-water emulsions there is always a tendency of air-bubble-formation. The effect of bubbles on the mass transfer coefficient and formation of gel-layer is still a very opened research content.
2. There are solid particles and components, such as scraps, sand particles in the industrial oil-in-water emulsions. For further studies, therefore, more attention should be paid on the two or three-phase UF performance.
5. PUBLICATIONS RELATED TO THE DISSERTATION
Articles
1. X. Hu, E. Bekassy-Molnar, Gy. Vatai, L. Meiszel and J. Olah, Removal of water from oil-water emulsion by ultrafiltration membrane, Hungarian Journal of Industrial Chemistry, 24 (2) (1996), 241-246. (Indexed by EI, Impact factor: 0.250)
2. X. Hu, E. Bekassy-Molnar, Gy Vatai, L. Meiszel and J. Olah, The study of oil/water separation in emulsion by ultrafiltration membranes, Chemische Technik, 50 (3) (1998), 119-123. (Indexed by SCI and EI, Impact factor: 0.413)
3. Gy. Vatai, E. Bekassy-Molnar and X. Hu, Ultrafiltration for separation of oil-water emulsions, Olaj, Szappan, Kozmetika, 46 (6) (1997), 228-230 (in Hungarian).
4. X. Hu and L. Jiang, Preparation and characterization of oil-containing POM/PU blends, Journal of Synthetic Lubrication, 15 (1) (1998), 19-29. (Indexed by EI) 5. X. Hu, Friction and wear behaviours of toughened polyoxymethylene blend under
water lubrication, Polymer-Plastics Technology Engineering, 39 (1) (2000), 137-150.
(Indexed by SCI and EI, Impact factor: 0.310)
6. X. Hu, Study of friction and wear performance of zinc dialkyldithiophosphate in the presence of trace ketone, Tribology Letters, 12 (2002), 67-74. (Indexed by SCI, Impact factor: 1.816)
7. X. Hu, E. Bekassy-Molnar and Gy. Vatai, Characterization of gel concentration in ultrafiltration of oil-in-water emulsion, Hungarian Journal of Industrial Chemistry, 30 (1) (2002), (in press) (Impact factor: 0.250)
8. X. Hu, E. Bekassy-Molnar and Gy. Vatai: Study of ultrafiltration behaviour of emulsified metalworking fluids, Desalination, 14 (2002), (to be published) (Impact factor: 0.285)
Lectures
9. X. Hu, Gy. Vatai, E. Bekassy-Molnar and L. Meiszel, Development and application of ultrafiltration membrane in the separation of oil-water emulsion, Proceedings of the Annual Meeting on Technical Chemistry’95, Veszprém, Hungary, (1995), 80.
10. X. Hu, E. Bekassy-Molnar, L. Meiszel, J. Olah and Gy. Vatai, Separation of oil-water emulsion on UF in laboratory and pilot scale, 7th National Congress on Membrane Technology, Nyergesújfalu, Hungary, (1995).
11. X. Hu, E. Bekassy-Molnar and Gy. Vatai, Modeling of membrane fouling during crossflow ultrafiltration of oily wastewater, Hungarian Annual Meeting on Technical Chemistry’02, Veszprém, Hungary, (2002).
Posters
12. X. Hu, E. Bekassy-Molnar, Gy. Vatai and L. Meiszel, Oil-water emulsion separation by ultrafiltration, 12th International Congress of Chemical and Process Engineering, Praha, Czech Republic, (1996), P 3.56.
13. E. Bekassy-Molnar, L. Meiszel, J. Olah, Gy. Vatai and X. Hu, Investigation of ultrafiltration characteristics of oil-emulsions on laboratory and pilot scale units, 7th World Filtration Congress, Budapest, Hungary, (1996), X42.
14. X. Hu, E. Bekassy-Molnar and Gy. Vatai, Evaluation of oil concentration on the membrane surface in ultrafiltration of oil-in-water emulsion, Hungarian Annual Meeting on Technical Chemistry’02, Veszprém, Hungary, (2002)
15. X. Hu, E. Bekassy-Molnar and Gy. Vatai, Study of ultrafiltration behaviour of emulsified metalworking fluids based on environmental protection, ICOM 2002, International Congress on Membranes and Membrane Processes, Toulouse, France, (2002).