Biosensors and Bioelectronics 191 (2021) 113469
Available online 30 June 2021
0956-5663/© 2021 The Authors. Published by Elsevier B.V. This is an open access article under the CC BY-NC-ND license
(http://creativecommons.org/licenses/by-nc-nd/4.0/).
Label-free real-time monitoring of the BCR-triggered activation of primary human B cells modulated by the simultaneous engagement of
inhibitory receptors
Kristof Kliment
a,b,1, Inna Szekacs
b,1,*, Beatrix Peter
b, Anna Erdei
a,c, Istvan Kurucz
c, Robert Horvath
baDepartment of Immunology, Eotvos Lorand University, Budapest, Hungary
bNanobiosensorics Laboratory, Institute of Technical Physics and Materials Science, Centre for Energy Research, 29-33 Konkoly-Thege Mikl´os út, Budapest, Hungary
cMTA-ELTE Immunology Research Group, Eotvos Lorand University, Budapest, Hungary
A R T I C L E I N F O Keywords:
Resonant waveguide grating biosensor Real-time kinetics
Cell-based assay Label-free
Primary human lymphoid cells Activated and resting immune cells
A B S T R A C T
Today, there is an intense demand for lab-on-a-chip and tissue-on-a-chip applications in basic cell biological research and medical diagnostics. A particular challenge is the implementation of advanced biosensor techniques in point-of-care testing utilizing human primary cells. In this study, a resonant waveguide grating (RWG)-based label-free optical biosensor technique has been applied for real-time monitoring of the integrated responses of primary human tonsillar B cells initiated by B cell receptor (BCR) and modified by FcγRIIb and CR1 engagement.
The BCR-triggered biosensor responses of resting and activated B cells were revealed to be specific and dose- dependent, in some cases with strong donor dependency. Targeted inhibition of Syk attenuated the label-free biosensor response upon BCR stimulation. Indifferent protein human serum albumin (HSA) did not interfere with the recorded signal to BCR stimulation. Simultaneous engagement of BCR and FcγRIIb modulated the ki- netic signal of the cells. Activated and resting B cells exhibited different response profiles upon simultaneous engagement of BCR and CR1. This advanced approach has the potential to decipher interfering signaling events in human B cells, manage differences between activated and resting B cell states, helping to understand the actual integrated response of these immune cells, and could be useful in the point-of-care diagnostic testing on human primary cells.
1. Introduction
One of the most important aspects in modern directions in applied biotechnology is the application of the latest technologies for the study of biological processes. A particular challenge is the implementation of advanced biosensor techniques in point-of-care testing utilizing primary cells.
The immune system reacts immediately upon pathogen exposure, and the response of various immune cells – including antigen-specific lymphocytes – can provide vital information in disease diagnostics and health monitoring through their activation. Proper and on time performed diagnosis is a key to successful disease prevention and treatment. Traditional laboratory methods for studying lymphocyte activation and the role of different receptors in this process rely on
assessing signal transduction, cell proliferation, cytokine production, or antibody secretion (Brauweiler and Cambier, 2003; Jozsi et al., 2002; ´ Kremlitzka et al., 2016; Ott et al., 2002). The execution of these – in most cases – endpoint assays may take days, and need to use physiological conditions to detect average signals in cell populations examined.
Moreover, the majority of current cell-based assays require the appli- cation of molecular labeling to achieve detection of given cellular events, but this can result in the alteration of protein expression and further, non-physiological, modifications in the cells. In addition, these methods commonly focus on the measurement of certain selected mol- ecules in appropriate signaling pathways at predetermined time points.
Label-free biosensor-based testing can overcome the potential disad- vantages of laboratory-based measurements and allow non-invasive in situ recording of cellular activities with high sensitivity. In contrast,
* Corresponding author.
E-mail address: szekacs.inna@ek-cer.hu (I. Szekacs).
1 Equal contributions.
Contents lists available at ScienceDirect
Biosensors and Bioelectronics
journal homepage: www.elsevier.com/locate/bios
https://doi.org/10.1016/j.bios.2021.113469
Received 21 April 2021; Received in revised form 25 June 2021; Accepted 27 June 2021
novel label-free biosensor techniques provide valuable kinetic data on primary human cells in real time, and even have possibility for single-cell measurements i.e. sorting, screening, characterization, and assessment of signalization at the level of individual cells (Sztilkovics et al., 2020). Therefore, the development and application of label-free methods applicable for point-of-care testing of medical diagnostics are on the rise.
The resonant waveguide grating (RWG)-based optical biosensor technique employs an evanescent electromagnetic field to characterize integrated cellular responses, and measures changes in the local refractive index within the sensing depth (~150 nm) close to the sensor surface (Fang et al., 2006; Orgovan et al., 2014a). Cell-to-surface adhesion process, protein trafficking, reorganization of the cytoskel- eton are taking place in the sensing volume, thus contribute to the local refractive index shift. The signal detected is an integrated dynamic mass redistribution (DMR) response, dependent on the dynamic behaviors of cells, occurring at the sensor surface (Debreczeni et al., 2020; Fang et al., 2006; Kanyo et al., 2020; Kurucz et al., 2017; Orgovan et al., 2014b;
Peter et al, 2017, 2018; Szekacs et al, 2018a, 2018b).
DMR detection technology can be used for adherent and suspension cells as well. This method has been successfully applied for studying several protein receptor responses including receptors with tyrosine kinase activity (Fang et al., 2005), G protein-coupled receptors (Schroder et al., 2010), the formyl peptide receptor signaling in primary ¨ human neutrophils (Christensen et al., 2017), B cell activation (Rex et al., 2015), and receptor-triggered integrated cellular responses in different B cell lines detected by our group (Kurucz et al., 2017).
Recently, we also employed this technique for the cell-based assays to investigate cell adhesion (Orgovan et al., 2014b) (Szekacs et al., 2018a) (Kanyo et al., 2020), cytotoxicity (Farkas et al., 2018) (Sz´ek´acs et al., 2019), primary endothelial cell signaling (Debreczeni et al., 2020), and RWG biosensor signal was calibrated to adhesion force and energy, demonstrated for single-cell level adhesion force measurements of large cell populations (Sztilkovics et al., 2020).
The adaptive immune response depends on the action of lympho- cytes (antigen-specific T cells and B cells) that respond to pathogens and other “non-self” antigens. B cells arise from hematopoietic stem cells in the bone marrow and, following maturation, migrate to secondary lymphatic organs (e.g., spleen, lymph nodes, and tonsils). Upon antigen binding by the B cell receptor (BCR), rapid redistribution of BCRs occurs in the cell membrane, involving intracellular signaling and the subse- quent reorganization of the cytoskeleton (Dal Porto et al., 2004; Lee et al., 2017; Pierce, 2002; Seda and Mraz, 2015; Song et al., 2014; Ste- panek et al., 2013). BCR engagement-driven B cell activation is regu- lated by a wide variety of cell membrane receptors. The BCR signaling pathway is initiated by phosphorylation of the cytoplasmic domain of Igα/CD79A and Igβ/CD79B, the signaling subunit of the BCR complex (Dal Porto et al., 2004) by Lyn, the Src-family kinase, followed by the binding of cytoplasmic spleen tyrosine kinase (Syk). The phosphorylation-dependent activation of Syk is positively regulated by product feedback that generates robust activation signals and the recruitment of downstream signaling elements, essential for signal propagation and diversification while also affects the oligomerization of BCR complexes (Dal Porto et al., 2004; Gold and Reth, 2019; Kl¨asener et al., 2014; Mukherjee et al., 2013; Rolli et al., 2002; Stepanek et al., 2013). Due to the indispensable role of Syk in early signal transduction events, its targeted inhibition would lead to the immediate termination of B cell activation.
Tonsils are peripheral lymphoid organs that provide an environment for antigen presentation and lymphocyte activation and are an ideal source of lymphocytes for various studies. Upon antigen binding, naïve
resting and activated B cells enable their separation.
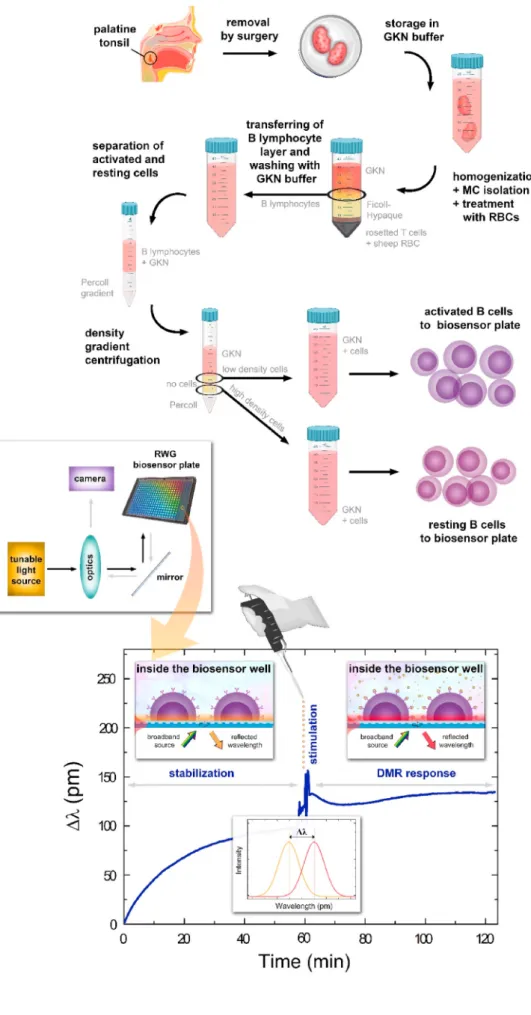
In the present work we analyzed the signaling mediated by primary human tonsil B cells stimulated via the BCR, – and in addition – we monitored the effect of simultaneous engagement of the BCR and the inhibitory receptors, FcγRIIb and CR1. The integrated response profiles of whole cells were followed kinetically by using an RWG-based optical biosensor (see Fig. 1 for the illustrated explanation of the measurement setup).
2. Materials and methods 2.1. Chemicals and test compounds
The quality and the source of the specific reagents and chemicals are detailed in the Supplementary Information.
2.2. B lymphocyte isolation from human tonsils (see also Fig. 1) Tonsils were obtained from young donors undergoing routine ton- sillectomy at the Szent Istvan and Szent L´ ´aszl´o Hospital (Budapest, Hungary). This study was carried out in accordance with the Helsinki Declaration and was approved by the Ethics Committee of the Medical Research Council in Hungary (TUKEB), 52 088/2015/EKU. Following the homogenization of the tonsillar tissue, Ficoll-Hypaque (GE Health- care, Chicago, IL, USA) density gradient centrifugation was performed and peripheral mononuclear cells were collected. The cells were incu- bated with 2-aminoethylisothiouronium bromide-treated sheep eryth- rocytes. After rosette formation, B lymphocytes were isolated by centrifugation over Ficoll-Hypaque solution. B cells of activated and resting phenotype were separated on a Percoll gradient. Experiments were performed with the low-density activated and the high-density resting populations (Note, resting cells are smaller in size and denser due to the low cytoplasm: nucleus ratio (De Groot et al., 1990; Kim and Guck, 2020)). B cells were only used for further measurements if purity was higher than 95%, verified by CD19 expression (FITC-conjugated anti-human CD19, Immunotools, Friesoythe, Germany). The isolation procedure was based on the method described by M´acsik-Valent et al.
(2019).
2.3. The resonant waveguide grating (RWG) imager biosensor
The label-free assay was performed using the RWG (see Supple- mentary Fig. S1). Each well of the microplate contain an individual RWG biosensor with a 2 ×2 mm2 sensing area. Each sensor has a character- istic resonant wavelength (λ) which is sensitive to refractive index (density) variations in the closed vicinity of the sensor surfaces (in a sensing depth of around 100–200 nm). The primary signal output of the biosensor is the shift of the resonant wavelength (Δλ =λ′-λ) in each well.
This shift in the resonant wavelength is often termed as the DMR signal.
The working principles of the biosensor instrument are explained in Supplementary Information and are schematically shown in Fig. 1.
2.4. Biosensor analysis: general protocol and data analysis (see also Fig. 1)
For temperature equilibration (room temperature), 30 μl 10 mM HEPES HBSS assay buffer was added to the wells of the 384-well biosensor microplate and baseline reading was taken until signal stabi- lization (for approximately 60 min). Afterwards, the buffer was removed and isolated B lymphocytes of active and resting phenotype diluted in
4
Fig. 1. Schematic overview illustrating the major steps of the biosensor assay: surgery material collection, storage in glucose po- tassium nutrient (GKN) buffer, mononuclear cells (MC) isolation through rosetting with 2- aminoethylisothiouronium bromide-treated sheep red blood cells (RBCs) by centrifuga- tion over Ficoll-Hypaque solution, with further B cells fractionation on a Percoll gradient. In the end, activated and resting cells were used for the biosensor measure- ment. The bottom part represents the actual biosensor arrangement and data collection.
The schematic readout of the biosensor microplate with incorporated sensor wells and the label-free primary signal (shift in resonant wavelength or DMR response) originating from the cells adhering on the surface is also shown. (For interpretation of the references to colour in this figure legend, the reader is referred to the Web version of this article.)
heat-aggregated human C3 (CR1-ligand) in 10 μl assay buffer. Heat- aggregation has been known for long to generate ligands that can crosslink various receptors, and thus are able to activate various cells in contrast to the non-aggregated ligands. Aggregation of IgG generates ligands that crosslink Fc-gamma receptors (Bich-Thuy and Revillard, 1985), and aggregation of C3 generates ligands that crosslink comple- ment receptor type 1 and activate CR1-bearing cells (Jozsi et al., 2002). ´ Control cells received assay buffer or control proteins (human serum albumin (HSA)), diluted in assay buffer) in the same volume. The shift of resonant wavelength relative to the baseline value (Δλ) was recorded for 1-h post-treatment (DMR-phase) and was used for further calculations.
Optimal cell number was found to be 9 ×10⁴ cells/well in preliminary pilot experiments applying a range of cell numbers (7 ×, 8 ×, 9 ×, and 10 × 104 cells/well) and a range of different concentrations of BCR-specific antibody fragments (Data not shown).
Analysis of the recorded biosensor data was based on the real-time biosensor signal (the recorded Δλ values, for details see Supplemen- tary Information). Averaging every 5 subsequent data points, the
effective sampling rate was 1/15 s−1. The effect of receptor stimulation was measured as the resonant wavelength change in picometers compared to the values before compound addition. All treatments were replicated three times within each experiment. As the analyzed biosensor kinetic signals originated from a 1 ×1 mm2 sensing area, containing approximately 22 500 B cells, in each experiments we ob- tained results from 12 parallels.
2.5. Statistical analysis
Where shown, data are represented as mean ±SD. The effect of BCR- stimulation was measured as the wavelength shift relative to the base- line value (Δλ, in picometers) at a specific time point (e.g. 30 or 60 min post-treatment). The impact of Syk inhibition or the simultaneous addition of inhibitory stimuli (FcγRIIb- and CR1-ligands) was calculated likewise and was compared to the values of the uninhibited cells at the same time point. Statistical analysis was carried out using GraphPad Prism version 6.00 for Windows (GraphPad software, San Diego,
California). The level of significance was established at values of p <
0.05. The exact tests used are detailed at the actual Figures.
3. Results and discussion
3.1. The BCR-triggered kinetic response of primary human B cells is specific and dose-dependent
The RWG technique has been successfully established for the real- time monitoring of the DMR response in various human B cell lines (Kurucz et al., 2017). But the optimization for studying primary tonsil-derived human B lymphocytes required the change of settings in a series of pilot experiments. Cells in assay buffer were brought into close contact with the non-coated sensor surface (as opposed to poly-L-lysine coating in our previous work (Kurucz et al., 2017)) by centrifugation
(100×g, 5 min). The ideal cell concentration, adaptation time following stimulation, and the concentration range of the applied stimuli were determined beforehand for activated and resting B cells (Data not shown).
Activated and resting tonsillar B cells were stimulated via the BCR using goat anti-human IgG/A/M (H +L) F (ab’)2 antibody (anti-BCR) fragments or mock-challenged with the assay buffer and their kinetic response was monitored for 1 h after the treatment (Fig. 2A, C). The BCR-induced activation of the lymphocytes resulted in a dose-dependent kinetic response with significant differences between the tested con- centrations in both applied cell types (Fig. 2B, D). As a negative control (similar IgG fragment with different specificity), rabbit anti-goat IgG (H +L) F (ab’)2 was used, which did not alter the wavelength shift (Δλ) values compared to the assay buffer control (Fig. 2E). Fig. 2F shows the schematics of the assay. The specificity of the reaction was further
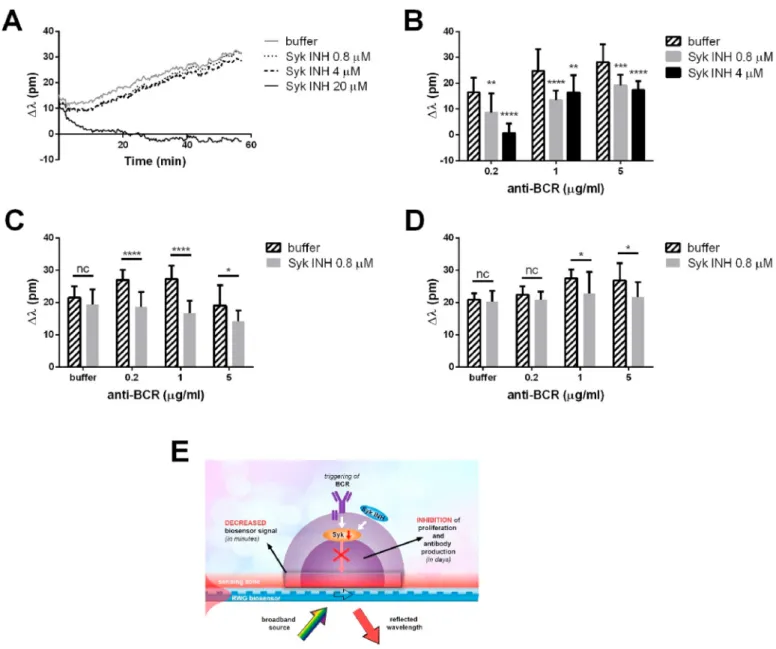
Fig. 3. Effect of the Syk inhibitor (Syk INH) BAY 61–3606 on the response of non-stimulated (A) and BCR-stimulated (B, C, D) tonsillar B cells. Resting B lymphocytes were added to the biosensor microplates either in assay buffer or assay buffer containing the indicated concentrations of Syk INH and were treated with different concentrations of goat anti-human IgG/A/M (H +L) F (ab’)2 (anti-BCR) or with buffer. Their DMR changes were recorded as a function of time (A). Levels of stimulation were calculated after 10 (B) or 30 (C, D) minutes of the treatment. B: Relative wavelength shift levels, control (10 mM HEPES HBSS/anti-BCR =0 μg/ml) values are subtracted from each data point (within the same Syk INH dosage). Data of representative experiments (the cells originated from different donors in panels B–D; A and C are from the same measurement) are shown as mean ±SD (n =12). E: Schematic illustration of the consequences of Syk inhibition and label-free readout. (B: Two-way ANOVA, Dunnett’s multiple comparisons test, nsp>0.05; *p <0.05; **p <0.01; ***p <0.001; ****p <0.0001) (C, D: Two-way ANOVA, Sidak’s multiple comparisons test, nsp>0.05; *p <0.05; **p <0.01; ***p <0.001; ****p <0.0001).
demonstrated by the experiments where an irrelevant protein, human serum albumin, was added to the cells but it did not interfere with the kinetic response to BCR stimulation (see Supplementary Fig. S2).
3.2. Targeted inhibition of syk leads to attenuated biosensor response upon BCR stimulation
Syk is one of the key mediators of intracellular signal transduction initiated via the BCR and its inhibition prevents a variety of cellular events such as proliferation and antibody production. First, we exam- ined the effect of the selective Syk inhibitor (Syk INH), BAY 61–3606 (Yamamoto et al., 2003), on the non-stimulated B cells (Fig. 3A). The Syk inhibitor at 0.8 μM and 4 μM concentrations did not alter the biosensor response comparing to the buffer control, however at 20 μM concentration the presence of inhibitor – at this concentration BAY 61–3606 inhibits not only Syk, but several other kinases as well, therefore it is highly toxic (Yamamoto et al., 2003) – negatively changed the wavelength shift values. Following the 1-h incubation of the primary B lymphocytes on the sensor surface with or without the Syk inhibitor, the cells were stimulated with goat anti-human IgG/A/M (H +L) F (ab’)2 (anti-BCR) antibody fragments (Fig. 3B, C, D; for schematics see Fig. 3E). While BCR-stimulated cells exhibited donor-dependent sensi- tivity to the Syk inhibitor, their detected responses were significantly lower compared to the lymphocytes without inhibitor (Fig. 3B, C, D).
Note, the negative effect of the Syk inhibitor can be overcome by increasing the activation of the cells, particularly in the initial stage (10 min, Fig. 3B), that is why the effect of the same concentration (4 μM) of the inhibitor is the most pronounced at the lowest shown concentration of the activator (anti-BCR antibody).
3.3. Simultaneous engagement of BCR and FcγRIIb modulates the integrated response of activated and resting tonsillar B cells
The environment in which the lymphocytes are examined can be manipulated to resemble in vivo conditions by simultaneous addition of activating and inhibitory stimuli. The evoked response is highly dependent on the proportion of these ligands and the balance between activating and inhibitory signals determines the outcome of the stimu- lation (whether it is activation, total inhibition, or modulated cellular response).
FcγRIIb is a major inhibitory Fc receptor expressed on several im- mune cell types including B lymphocytes, where it is the only Fc receptor with specificity to IgG. As such, it plays an important role in the mod- ulation of B cell activation upon encounter with IgG-containing immune complexes. Cross-linking of the BCR and FcγRIIb is followed by the downregulation of the BCR signalization pathway at an early stage, ul- timately inhibiting the activation of B cells (Liu et al., 2010; Masao et al., 1997; Nimmerjahn and Ravetch, 2007, 2008, Ono et al., 1996; Song et al., 2014).
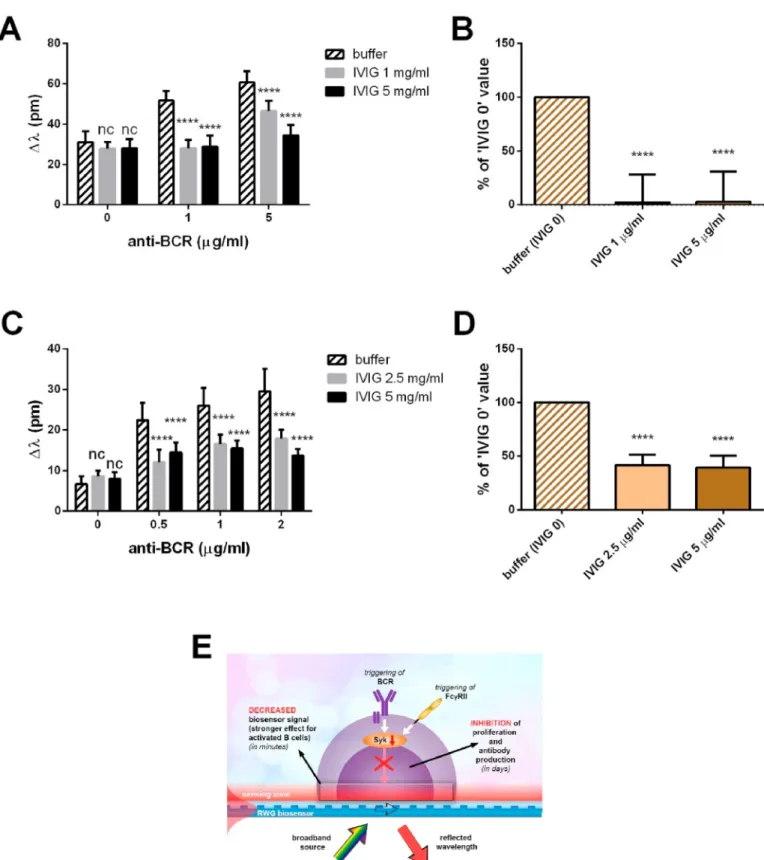
In our experiments, we employed heat-aggregated intravenous IgG (IVIG) as FcR-ligand and pipetted them in assay buffer or assay buffer containing goat anti-human IgG/A/M (H +L) F (ab’)2 to the activated (Fig. 4A) and resting B cells (Fig. 4C). The presence of IVIG as a sole ligand did not affect the detected integrated signal. On the contrary, there was a significant reduction in the wavelength shift values when IVIG was added simultaneously with stimulatory antibodies. Differences between donor cells are prominent even if we compare resting cell populations. If not only the donors differ but also the phenotype of the examined cells (activated vs resting) the disparity will be even greater.
Moreover, activated (Fig. 4A) and resting (Fig. 4C) B cells respond
and resting B cells. And that is applicable for the combination of BCR- and FcγRIIb-stimuli. Despite these differences, a significant attenuating effect of the IVIG treatment can be observed for both the activated and the resting phenotypes. To quantify the impact of IVIG on the BCR- induced DMR response, we normalized the Δλ values and measured a significant decrease in the effect of BCR engagement when IVIG was employed (Fig. 4B, D). Both activated and resting B cells reacted simi- larly to the treatment but the inhibition was much more pronounced at the activated B cells (see Fig. 4E).
3.4. Activated and resting B cells exhibit different kinetic profiles upon simultaneous engagement of BCR and CR1
Next, we set out to examine the cellular response induced by the co- engagement of the BCR and another inhibitory receptor of human B cells, complement receptor type 1 (CR1, CD35).
CR1 is expressed on the surface of various immune cells including B lymphocytes and recognizes C3b molecules generated by the cleavage of C3, the central component of the complement cascade. This receptor plays an important role in shaping the adaptive immune response by negatively regulating human B cell functions including proliferation, antibody production, and cytokine expression (Erdei et al., 2009; J´ozsi et al., 2002; Kremlitzka et al, 2013, 2016,; M´acsik-Valent et al., 2019).
The exact mechanism of the interaction between the BCR- and CR1-initiated signalization pathways is not yet fully deciphered. Thus techniques that enable investigation of cellular changes instantly after stimulation are of high value.
As opposed to our previously itemized treatments, the adaptation of this method to the monitoring of CR1-mediated B lymphocyte functions is a novel application. For the ligation of CR1 a “C3b like” ligand (J´ozsi et al., 2002), namely heat-aggregated C3 protein was employed. We found a difference between the biosensor signal of activated and resting B cells upon the simultaneous engagement of the BCR and CR1. In the case of activated B cells, the sole addition of C3 did not alter the response compared to the buffer-treated control cells, while in the presence of the BCR stimulus C3 significantly reduced the wavelength shift values, as shown in Fig. 5. In contrast to this, resting B cells exhibit a highly donor-dependent response, and the summarized data show no signifi- cant difference comparing the BCR-induced DMR response in the pres- ence or absence of C3 (Fig. 5E). Independent experiments show lower (Fig. 5F), similar (Fig. 5G), or even higher (Fig. 5H) Δλ values upon BCR +CR1 engagement when compared to the effect of BCR stimulation.
Fig. 5I shows a schematic illustration of the biological background of the assay.
4. Conclusions
We have successfully applied a label-free, non-invasive and real-time method using an optical RWG biosensor for measuring the holistic cellular response in primary human B cells upon single or simultaneous receptor stimulations.
The dose-dependent integrated response of BCR-stimulated cells was diminished by a Syk inhibitor. The simultaneous engagement of BCR and FcγRIIb resulted in significant, although B cell population-dependent, changes in biosensor response, while co-stimulation of B cells via the BCR and CR1 led to different label-free profiles in the case of resting and activated B cells.
Using novel label-free kinetic measurements it was possible to monitor how activated and resting B lymphocytes differ in sensitivity for the stimulating agents, with donor-dependent effects. Concerning the
Fig. 4. Integrated response of tonsillar B cells to the simultaneous engagement of BCR and FcγRIIb. Activated (A) and resting (C) B cells seeded into the wells of biosensor microplate were treated with the indicated concentrations of goat anti-human IgG/A/M (H +L) F (ab’)2 (anti-BCR) and/or heat-aggregated intravenous IgG (IVIG). Levels of stimulation were calculated 30 min after the treatment. Data (mean ±SD, n =12) of representative experiments are shown. The effect of IVIG on the extent of the wavelength shift is quantified by normalization: The difference between the Δλ values (30 min post-treatment) of 1 μg/ml BCR-stimulated and HBSS- treated cells in the absence (considered as 100%) or presence of IVIG is compared and summarized as the percentage of inhibition±SD (n =12) in the case of the activated (B) and resting (D) B cells. E: Schematic illustration of the consequences of receptor stimuli and label-free readout. (A, C: Two-way ANOVA, Dunnett’s multiple comparisons test, nsp>0.05; ****p <0.0001) (B, D: One-way ANOVA Dunnett’s multiple comparisons test, nsp>0.05; ****p <0.0001).
BCR-mediated activation of primary B cells was studied recently by Macsik-Valent et al. (M´acsik-Valent et al., 2019). For optimal results, they activated the cells with 5 μg/ml of anti-BCR antibody and used 40 μg/ml of the heat-aggregated inhibitor. This again is in absolute accord with our biosensor data. In conclusion, this advanced approach has the potential to decipher interfering signaling events in human B cells, helping to understand the actual integrated response of these immune cells, and could be useful in point-of-care diagnostic testing.
Ethics statement
This study was carried out in accordance with The Code of Ethics of the World Medical Association (Declaration of Helsinki) and was approved by the Ethics Committee of the Medical Research Council in Hungary (TUKEB), 52 088/2015/EKU. Informed consent to participate in this study was provided by the participants’ legal guardian/next of kin.
CRediT authorship contribution statement
Kristof Kliment: Writing – original draft. Inna Szekacs: Formal analysis, Writing – original draft. Beatrix Peter: conducted Epic BT with the help of made manuscript figures. Anna Erdei: Supervision. Istvan Kurucz: Supervision, Formal analysis. Robert Horvath: Formal analysis.
Declaration of competing interest
The authors declare that they have no known competing financial interests or personal relationships that could have appeared to influence the work reported in this paper.
Acknowledgment
The present work was supported by the Hungarian Academy of Sci- ences [Lendület (Momentum) Program], the Hungarian Scientific Research Fund (OTKA) grant K 112011 (grant to AE), the National Research, Development and Innovation Office (NKFIH) [ERC_HU, KH_17, PD 131543 and KKP_19 Programs].
Appendix A. Supplementary data
Supplementary data to this article can be found online at https://doi.
org/10.1016/j.bios.2021.113469.
Author contributions
AE, IK, and RH established the research line, designed the experi- ments and supervised the work. KK and BP conducted Epic BT mea- surements with the help of ISz and RH. IK took part in data analysis. KK and ISz wrote the paper. KK, ISz, and BP made manuscript figures. All authors reviewed and commented on the manuscript.
References
Bich-Thuy, L.T., Revillard, J.-P., 1985. Eur. J. Immunol. 15, 96–99. https://doi.org/
10.1002/eji.1830150119.
Brauweiler, A.M., Cambier, J.C., 2003. Portland Press Ltd 281–285. https://doi.org/
10.1042/bst0310281.
Christensen, H.B., Gloriam, D.E., Pedersen, D.S., Cowland, J.B., Borregaard, N., Br¨auner- Osborne, H., 2017. J. Pharmacol. Toxicol. Methods 88, 72–78. https://doi.org/
10.1016/j.vascn.2017.07.003.
Dal Porto, J.M., Gauld, S.B., Merrell, K.T., Mills, D., Pugh-Bernard, A.E., Cambier, J., 2004. Mol. Immunol. 41, 599–613. https://doi.org/10.1016/j.
molimm.2004.04.008.
De Groot, C., Braun, J., Mevissen, M.L.C.M., Wormmeester, J., 1990. Lymphokine Res. 9, 321–332.
Debreczeni, M.L., Szekacs, I., Kovacs, B., Saftics, A., Kurunczi, S., G´al, P., Dob´o, J., Cervenak, L., Horvath, R., 2020. Sci. Rep. 10, 1–14. https://doi.org/10.1038/
s41598-020-60158-4.
Erdei, A., Isa´ak, A., Tor¨ok, K., S¨ ´andor, N., Kremlitzka, M., Prechl, J., Bajtay, Z., 2009.
Mol. Immunol. 46 (14), 2767–2773. https://doi.org/10.1016/j.
molimm.2009.05.181.
Fang, Y., Ferrie, A.M., Fontaine, N.H., Mauro, J., Balakrishnan, J., 2006. Biophys. J. 91, 1925–1940. https://doi.org/10.1529/biophysj.105.077818.
Fang, Y., Ferrie, A.M., Fontaine, N.H., Yuen, P.K., 2005. Anal. Chem. 77, 5720–5725.
https://doi.org/10.1021/ac050887n.
Farkas, E., Szekacs, A., Kovacs, B., Olah, M., Horvath, R., Szekacs, I., 2018. J. Hazard Mater. 351, 80–89. https://doi.org/10.1016/j.jhazmat.2018.02.045.
Gold, M.R., Reth, M.G., 2019. Annu. Rev. Immunol. 37, 97–123. https://doi.org/
10.1146/annurev-immunol-042718-041704.
J´ozsi, M., Prechl, J., Bajtay, Z., Erdei, A., 2002. J. Immunol. 168, 2782–2788. https://
doi.org/10.4049/jimmunol.168.6.2782.
Kanyo, N., Kovacs, K.D., Saftics, A., Szekacs, I., Peter, B., Santa-Maria, A.R., Walter, F.R., D´er, A., Deli, M.A., Horvath, R., 2020. Sci. Rep. 10, 1–20. https://doi.org/10.1038/
s41598-020-80033-6.
Kim, K., Guck, J., 2020. Biophys. J. 119 (10), 1946–1957. https://doi.org/10.1016/j.
bpj.2020.08.044.
Kl¨asener, K., Maity, P.C., Hobeika, E., Yang, J., Reth, M., 2014. Elife 3:e02069. https://
doi.org/10.7554/eLife.02069.001.
Kremlitzka, M., M´acsik-Valent, B., Erdei, A., 2015. Cell. Mol. Life Sci. 72, 2223–2236.
https://doi.org/10.1007/s00018-014-1806-x.
Kremlitzka, M., M´acsik-Valent, B., Polgar, A., Kiss, E., Po´ or, G., Erdei, A., 2016. ´ J. Immunol. Res. 2016 2016:5758192. https://doi.org/10.1155/2016/5758192.
Kremlitzka, M., Polg´ar, A., Fül¨op, L., Kiss, E., Poor, G., Erdei, A., 2013. Int. Immunol. 25, ´ 25–33. https://doi.org/10.1093/intimm/dxs090.
Kurucz, I., Peter, B., Prosz, A., Szekacs, I., Horvath, R., Erdei, A., 2017. Sensor. Actuator.
B Chem. 240, 528–535. https://doi.org/10.1016/j.snb.2016.09.015.
Lee, J., Sengupta, P., Brzostowski, J., Lippincott-Schwartz, J., Pierce, S.K., 2017. Mol.
Biol. Cell 28, 511–523. https://doi.org/10.1091/mbc.E16-06-0452.
Liu, W., Won Sohn, H., Tolar, P., Meckel, T., Pierce, S.K., 2010. J. Immunol. 184 https://
doi.org/10.4049/jimmunol.0902334, 1977–1989.
M´acsik-Valent, B., Nagy, K., Fazekas, L., Erdei, A., 2019. Front. Immunol. 10, 1493.
https://doi.org/10.3389/fimmu.2019.01493.
Masao, O., Okada, H., Bolland, S., Yanagi, S., Kurosaki, T., Ravetch, J.V., 1997. Cell 90, 293–301. https://doi.org/10.1016/S0092-8674(00)80337-2.
Mukherjee, S., Zhu, J., Zikherman, J., Parameswaran, R., Kadlecek, T.A., Wang, Q., Au- Yeung, B., Ploegh, H., Kuriyan, J., Das, J., Weiss, A., 2013. Sci. Signal. 6 https://doi.
org/10.1126/scisignal.2003220.
Nimmerjahn, F., Ravetch, J.V., 2008. Nat. Rev. Immunol. 8 (1), 34–47. https://doi.org/
10.1038/nri2206.
Nimmerjahn, F., Ravetch, J.V., 2007. Adv. Immunol. 96, 179–204. https://doi.org/
10.1016/S0065-2776(07)96005-8.
Ono, M., Bolland, S., Tempst, P., Ravetch, J.V., 1996. Nature 383, 263–266. https://doi.
org/10.1038/383263a0.
Orgovan, N., Kovacs, B., Farkas, E., Szab´o, B., Zaytseva, N., Fang, Y., Horvath, R., 2014a.
Appl. Phys. Lett. 104 https://doi.org/10.1063/1.4866460, 0–4.
Orgovan, N., Peter, B., Bosze, S., Ramsden, J.J., Szabo, B., Horvath, R., 2014b. Sci. Rep.
4, 4034. https://doi.org/10.1038/srep04034.
Ott, V.L., Tamir, I., Niki, M., Pandolfi, P.P., Cambier, J.C., 2002. J. Immunol. 168, 4430–4439. https://doi.org/10.4049/jimmunol.168.9.4430.
Peter, B., Farkas, E., Forgacs, E., Saftics, A., Kovacs, B., Kurunczi, S., Szekacs, I., Csampai, A., Bosze, S., Horvath, R., 2017. Nat. Publ. Gr. 1–16 https://doi.org/
10.1038/srep42220.
Peter, B., Ungai-Salanki, R., Szab´o, B., Nagy, A.G., Szekacs, I., Bosze, S., Horvath, R., ˝ 2018. ACS Omega 3, 3882–3891. https://doi.org/10.1021/acsomega.7b01902.
Pierce, S.K., 2002. Nat. Rev. Immunol. 2, 96–105. https://doi.org/10.1038/nri726.
Rex, E.B., Kim, S., Wiener, J., Rao, N.L., Milla, M.E., DiSepio, D., 2015. J. Biomol. Screen 20, 876–886. https://doi.org/10.1177/1087057115585724.
Rolli, V., Gallwitz, M., Wossning, T., Flemming, A., Schamel, W.W.A., Zürn, C., Reth, M., 2002. Mol. Cell. 10, 1057–1069. https://doi.org/10.1016/S1097-2765(02)00739-6.
Schr¨oder, R., Janssen, N., Schmidt, J., Kebig, A., Merten, N., Hennen, S., Müller, A., Blattermann, S., Mohr-Andr¨ ¨a, M., Zahn, S., Wenzel, J., Smith, N.J., Gomeza, J., Drewke, C., Milligan, G., Mohr, K., Kostenis, E., 2010. Nat. Biotechnol. 28, 943–949.
https://doi.org/10.1038/nbt.1671.
Seda, V., Mraz, M., 2015. Eur. J. Haematol. 94 (3), 193–205. https://doi.org/10.1111/
ejh.12427.
Song, W., Liu, C., Upadhyaya, A., 2014. Biochim. Biophys. Acta Biomembr. 1838 (2), 569–578. https://doi.org/10.1016/j.bbamem.2013.07.016.
Stepanek, O., Draber, P., Drobek, A., Horejsi, V., Brdicka, T., 2013. J. Immunol. 190, 1807–1818. https://doi.org/10.4049/jimmunol.1202401.
Szekacs, I., Farkas, E., Gemes, B.L., Takacs, E., Szekacs, A., Horvath, R., 2018a. Sci. Rep.
8, 17401. https://doi.org/10.1038/s41598-018-36081-0.
Szekacs, I., Orgovan, N., Peter, B., Kovacs, B., Horvath, R., 2018b. Sensor. Actuator. B Chem. 256, 729–734. https://doi.org/10.1016/j.snb.2017.09.208.
Sz´ek´acs, I., Tokarz, P., Horvath, R., Kov´acs, K., Kubas, A., Shimura, M., Brasun, J., Murzin, V., Caliebe, W., Szewczuk, Z., Paluch, A., Wojn´arovits, L., Toth, T., Pap, J.S., ´
Szyrwiel, Ł., 2019. Chem. Biol. Interact. 306, 78–88. https://doi.org/10.1016/j.
cbi.2019.04.003.
Sztilkovics, M., Gerecsei, T., Peter, B., Saftics, A., Kurunczi, S., Szekacs, I., Szabo, B., Horvath, R., 2020. Sci. Rep. 10, 1–13. https://doi.org/10.1038/s41598-019-56898- 7.
Yamamoto, N., Takeshita, K., Shichijo, M., Kokubo, T., Sato, M., Nakashima, K., Ishimori, M., Nagai, H., Li, Y.F., Yura, T., Bacon, K.B., 2003. J. Pharmacol. Exp.
Therapeut. 306, 1174–1181. https://doi.org/10.1124/jpet.103.052316.