Real time human activity monitoring ∗
József Sütő, Stefan Oniga, Attila Buchman
University of Debrecen Faculty of Informatics suto.jozsef@inf.unideb.hu
Submitted August 28, 2014 — Accepted January 24, 2015
Abstract
Human activity monitoring is one of those research areas whose impor- tance and popularity have notably increased in recent years. The popularity of this topic increased in the previous years. Most of the used movement analysis techniques in the area are based on the measurement of the acceler- ation change of different parts of the body. This is done by attaching one or more little devices with an accelerometer to the body of the observed patient.
Usually, the role of the body-attached devices are only data acquisition, the processing of the acquired data happens offline. This article presents a new solution for this task which combines digital time-frequency signal processing with a parallel programming approach.
Keywords: movement analysis, Raspberry Pi, accelerometer, signal process- ing, parallel programming
MSC:92C50
1. Introduction
Accelerometer-based activity monitoring devices are becoming more popular. By activity monitoring, we can obtain information about the health and mental status of the observed person. Many articles deal with the possibilities of the informa- tion which comes from the accelerometers [1-6]. Those studies demonstrate that movement classification is possible by accelerometers. Sometimes the sensors are attached to the fix points of the body: chest, hip, etc. In this case, the center of
∗The publication was supported by the TÁMOP-4.2.2.C-11/1/KONV-2012-0001 project. The project has been supported by the European Union, co-financed by the European Social Fund.
http://ami.ektf.hu
187
the observation is the whole body and one sensor is enough [1, 2]. In other cases, when we examine walking patterns or postures, the sensors are attached to different parts of the body: head, trunk, foot, tibia [3, 4, 5, 6].
Activity analysis is a very extended research area. It includes the monitoring of patients who suffer from fall, back pain, overweight, physiological tremors, mental disorders and other kinds of diseases (Parkinson disease, osteoarthritis) [2, 4, 6].
Another research field of this topic is movement pattern recognition. It includes the main activities of daily living: sitting, standing, walking, jogging, running and climbing stairs. Beyond the main activities, the importance of the unexpected events such as different kinds of fall rises at elderly patients [7, 8, 9, 10]. The movement analysis can help support elderly people in their everyday life. The number of ageing population is rapidly growing thus the demand of assisted living systems will gradually increase [1].
The aim of this study is to present a method of activity classification, and in addition, to create a real time system which monitors the daily activities of an observed patient. The observed patient should wear the device during the day.
Therefore, the device have to be portable and small. One of the most important criteria of the device is the cost. Since the system consists of only one data collector device, the cost of the system is low. Obviously, more data collector devices and sensors require higher cost. Another criteria is independence. This means that hospital environment is not necessary to the observation. The system facilitates self-care and enhances the independence of the patients against the public health systems.
The data collector device is a Raspberry Pi (RPi) with an ADXL345 (3-axis) accelerometer and a Roving RN-171 WIFI module. The device was fixed into a thin plate which provides stable position on the chest. There is a Linux operation system on the RPi, therefore the developer can easily create high level programs.
Figure 1 shows the constructed device.
The disadvantage of most analysis techniques is the offline mode [1-6]. In this case, the analysis take place after the data acquisition on a computer by some well known software (Matlab, Labview, etc.). In contrast, our method works in real time. This is the first difference between previous techniques and our method. The same device performs the data acquisition and data evaluation simultaneously, the two tasks run in parallel on the device.
In our system an individual pattern recognition technique was applied for this problem which works better than the correlation or artificial neural network based pattern recognition techniques [11]. This simple technique runs an ideal pattern through the time varying signal and calculates the shifted and summarised square error (SSE). Every activity has an own rhythm which describes a periodical pattern.
If an algorithm can recognise the patterns, then it can define the current movement.
188 J. Sütő, S. Oniga, A. Buchman
Figure 1: The applied data collector device
2. Parallel operation
On the RPi a C++ program performs the data acquisition and data evaluation. In the C++ code the POSIX thread or Pthread library allows parallel programming [12]. Pthread is a set of C programming types and procedure calls. The data acqui- sition and the analysis are independent tasks which can be executed concurrently.
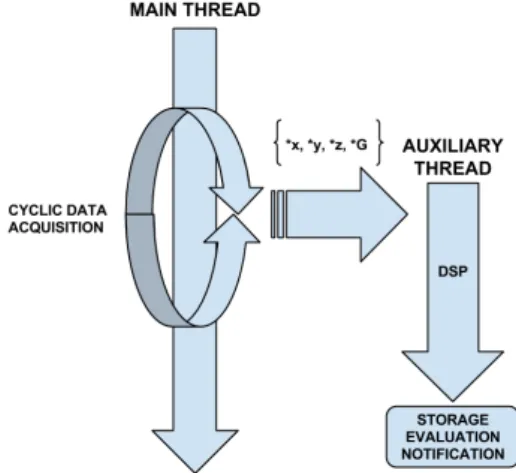
The analyser program uses two threads. The main thread collects the measured ac- celeration components and an auxiliary thread performs the data analysis. Figure 2 illustrates the parallelized data collection and evaluation.
While the device is active, the data acquisition function runs continuously and stores the collected data in buffers. Currently, the data acquisition frequency is 100 Hz and the buffer size is 28. Consequently, the analyser method splits the continuous signal to short parts (about 2.5 seconds long) and tries to decide the current activity. When the buffers are full, the auxiliary thread starts and gets a void* structure which includes the buffers. Pthread permits to pass only one argument to the new thread, therefore every argument have to be embedded into a structure. The auxiliary thread will call the digital signal processing (DSP) and pattern recognition functions. Furthermore, the auxiliary thread is responsible for the storage and notification.
If the data analysis finishes, the decision about the movement will be stored in a file and sent to a server in IP packet. A strict rule, that the auxiliary thread have to be faster than the data acquisition process. Thereby, the program can avoid thread collision.
Figure 2: The structure of parallel operation. The *x, *y, *z are buffers which contain the x, y, z components of the accelerometer and*Gbuffer includes the normalised acceleration magnitude.
3. Description of the method
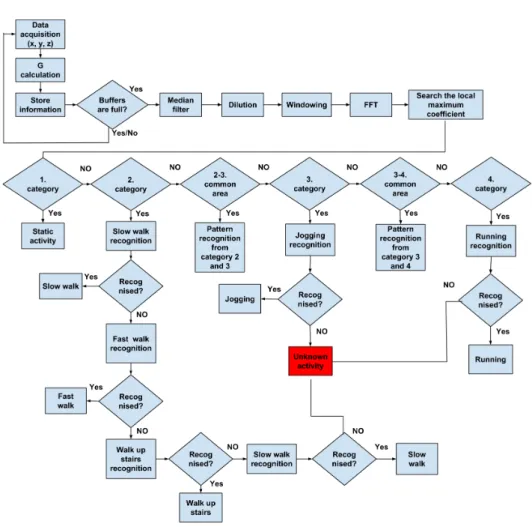
The activity analysis is based on time-frequency signal processing. First, the algo- rithm categorises the acquired signal in the frequency domain. In the next step, according to the frequency category, it will search the possible patterns which be- long to the assigned category. The detected pattern will identify the movement type. Figure 3 illustrates the flowchart of the applied algorithm.
On figure 3 there is anunknown activity state. It means that, if the examined signal contains an incomprehensible sequence, the algorithm will not give decision.
During the acquisition process, the program calculates the normalised acceler- ation magnitude (G[i]) from the collected parameters(x, y, z).
G[i] =
px[i]2+y[i]2+z[i]2 1g
where 1g depends on the resolution of the accelerometer. TheGcharacterises the change in the movement, thus it will be the key in the analysis [1, 7]. Firstly, the frequency coefficients of the G signal will be calculated. Before the fast Fourier transformation (FFT), the signal was diluted and windowed with a Blackman- Nuttall window in order to minimize the leakage and separate the closely spaced frequencies [15, 16]. The length of the signal influences the frequency resolution.
Consequently, if the frequency resolution is higher, then the frequency categorisa- tion is easier. The real signal size is28which will be diluted to29with zeros. After the dilution the extended signal will be multiplied with the window function.
In order to the auxiliary thread can analyse theGsignal faster than the data acquisition (less than 2.5 seconds), we created an optimized FFT algorithm to
190 J. Sütő, S. Oniga, A. Buchman
Figure 3: The flowchart of the algorithm
calculate the frequency coefficients [13]. Since, the signal length is fix and the FFT runs periodically in the program therefore worth to store the“twiddle-factors”into memory as pre-defined constants. Generally the radix-2 FFT can be written as,
X(k) =E(k) +WNkO(k) k= 0,1, . . . ,N 2 −1 X(k) =E(k−N
2)−WNkO(k−N
2) k=N
2 , . . . , N−1.
In the equation E(k)andO(k)contain the frequency coefficients to the even and odd elements andWNk fork= 0, ..., N−1is theN0th root of unity [18]. If we take advantage of the relations betweenWNk factors (3.1), we will save memory because it is enough to store one-fourth of factors.
WNk+ImN4 =−WNkRe
WNk+ReN4 =WNkIm
WNk+N2 =−WNk (3.1)
In the above formulasReandImrefer to the real and imaginary parts of a complex number. The Euler’s formula (3.2) allows the decomposition of theWNk factors into real and imaginary parts thus the real and imaginary parts of the factors will be stored separately in the program.
WNk = cos
k2π N
−isin
k2π N
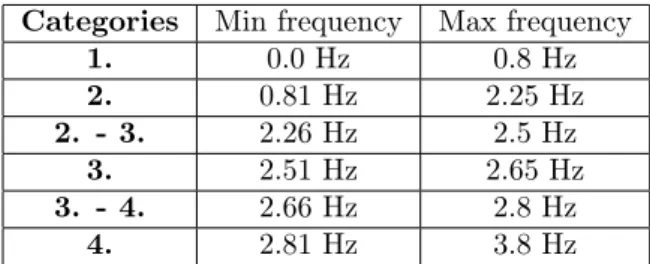
(3.2) After the frequency coefficients are available, the algorithm searches the max- imum value inside a specified frequency interval. The frequency categories bound an interval between 0.8 Hz and 3.8 Hz. The maximum value defines the activity category. Table 1 contains the applied frequency categories and an approximate frequency interval. Actually, the data is stored in binary form thus the frequency intervals are based on the indexes (bins) of the frequency vector.
Categories Min frequency Max frequency
1. 0.0 Hz 0.8 Hz
2. 0.81 Hz 2.25 Hz
2. - 3. 2.26 Hz 2.5 Hz
3. 2.51 Hz 2.65 Hz
3. - 4. 2.66 Hz 2.8 Hz
4. 2.81 Hz 3.8 Hz
Table 1: Frequency categories
According to the category, the appropriate pattern detection functions will be used on theGsignal. Therefore, the number of operations greatly decreases. Un- fortunately, between some categories there is a narrow overlapping. In that case, if the maximum coefficient is in the common area of two categories, then the algo- rithm will search each patters which belong to the two adjacent categories. Figure 4 illustrates the frequency spectrum of some main activities.
The maximum frequency coefficient should higher than an appropriate ampli- tude limit. In this case, a reliable limit is between 14.5 and 16.5. On the above figure the blue lines indicate the frequency interval and the amplitude limit. If the maximum is lower than the limit, then the movement is static. According to the position the algorithm concludes the frequency category.
3.1. Pattern recognition
The pattern recognition starts with a median filtering with a seven samples length window to reduce the noise on the G signal before the recognition [6, 7]. In the
192 J. Sütő, S. Oniga, A. Buchman
Figure 4: Frequency spectrum of some main activities
literature, one of the most common pattern recognition technique is the correla- tion [17].
(f ·g)[n] :=
NX−1
m=0
f[m]g[m+n]
where f and g are real vectors. However, in some cases the correlation does not provide acceptable result. Consequently, we developed a simple and individual pattern recognition method. The method is a combination of the square error and the correlation. It can be characterized as a shifted and summarised square error (SSE).
SSE(f, g)[n] :=
NX−1
m=0
(f[m]−g[m+n])2
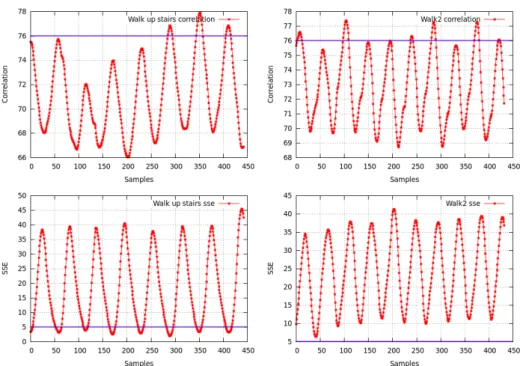
In both cases, an ideal pattern (or kernel) with a special shape will pass through the examined signal. In a correlated signal the peak(s) are higher when the simi- larity between the pattern and the examined signal is large. However, in the SSE the low parts indicate the high similarity. The difference between the correlation and the SSE can be visualised with a simple example. The example compares two similar activities: walking and the climbing of stairs. In the example the climbing stairs pattern was used on the two activity sequences. In ideal case, if the sought
Figure 5: Comparison of the two pattern recognition techniques
pattern does not appear in the signal, all resulted points have to be less or higher as a well defined limit, according to the applied technique. Figure 5 presents the result where the blue lines are imaginary limits to the two pattern recognition tech- niques. As the example shows, the correlation can not separate the activities with the used kernel. For instance, if we use the 76 (blue line) as limit, the same number of points will be higher than the limit in both cases. In contrast, the SSE separates the activities well. On figure 5 a lot of points belong under 5 of the climbing stairs sequence while in the walk sequence every point is higher than 5.
4. Conclusion
The presented technique is well applicable for activity recognition. If an activity describes an individual and periodic acceleration change then the presented recog- nition algorithm will find the patterns. As figure 3 shows, if we know the frequency interval and the described pattern of an activity, we can easily past the new ac- tivity into the method. Obviously, an unexpected event such as a fall is similarly recognizable because a fall (regardless of the direction) has a suddenly ascending and then decaying acceleration fluctuation.
The ability to evaluate the movement types provides an exceptional source of knowledge to doctors to diagnose patients. The movement analysis is a useful aid to
194 J. Sütő, S. Oniga, A. Buchman
detect potential causes of gait and lifestyles abnormalities [14]. As was mentioned at the beginning of the article, human movement is researched in relation to a lot of diseases, such us reduced mobility disorders (stroke, obesity), sclerosis and Parkinson’s disease [2, 4, 14]. To sum up, human movement analysis provides much information about the health condition of the observed patient.
Today, as the importance of research in the area of Future Internet is increasing, applications of the so called Internet of Things (IoT) are becoming more and more popular. The IoT is a network of different types of objects (people, sensors, devices, etc.) which can communicate with each other via the Internet [19, 20, 21, 22]. The presented solution to the activity recognition problem belongs to this branch of research which is expected to be determinative in the following years.
References
[1] Smith, T.F., Waterman, M.S., Elderly activities recognition and classification for applications in assisted living,Expert Systems with Applications, Vol. 40 (2013), 1662-1674.
[2] Godfrey, A., Bourke, K.A., Ólaighin, M.G., Ven de van, P., Nelson, J., Activity classification using a single chest mounted tri-axial accelerometer, Medical Engineering & Physics, Vol. 33 (2011), 1127-1135.
[3] Lyons, M.G, Culhane, M.K., Hilton, D., Grace, A.P., Lyons, D.,A descrip- tion of an accelerometer-based mobility monitoring technique, Medical Engineering
& Physics, Vol. 27 (2005), 497-504.
[4] Kavanagh, J.J, Menz, B.H., Accelerometry: A technique for quantifying move- ment patterns during walking,Gait & Posture, Vol. 28 (2008), 1-15.
[5] Forester, F., Smeja, M., Fahrenberg, J.,Detection of posture and motion by accelerometry: a validation study in ambulatory monitoring,Computers in Human Behavior, Vol. 15 (1999), 571-583.
[6] Lugade, V., Fortune, E., Morrow, M., Kaufman, K., Validity of using tri- axial accelerometers to measure human movement—Part I: Posture and movement detection,Medical Engineering & Physics, Vol. 36 (2014), 169-176.
[7] Kangas, M., Konttila, A., Lindgren, P., Winblad, I., Jamsa, T., Compar- ison of low-complexity fall detection algorithms for body attached accelerometers, Gait & Posture, Vol. 28 (2008), 285-291.
[8] Chern-Sheng Lin, Hung Chun Hsu, Yun-Long Lay, Chuang-Chien Chiu, Chi-Shih Chao,Wearable device for real-time monitoring of human falls,Measure- ment, Vol. 40 (2007), 831-840.
[9] Bourke, K.A., O’Brien, V.J., Lyons, M.G.,Evaluation of a threshold-based tri- axial accelerometer fall detection algorithm,Gait & Posture, Vol. 26 (2007), 194-199.
[10] Ge Wu,Distinguishing fall activities from normal activities by velocity characteris- tics,Journal of Biomechanics, Vol. 33 (2000), 1497-1500.
[11] Suto, J., Oniga, S.,Testing artificial neural network for hand gesture recognition, Creative Mathematics and Informatics, Vol. 22 (2013), 223-228.
[12] Buttlar, D., Farrell, J., Nichols, B.,PThreads Programming. O’Reilly Media, USA (1996).
[13] Suto, J., Oniga, S., Hegyesi Gy.,A simple fast Fourier transformation algorithm to microcontrollers and mini computers, IEEE 18th International Conference on Intelligent Engineering Systems, (2014), 61-65.
[14] Godfrey, A., Conway, R., Meagher, D., Ólaighin, G.,Direct measurement of human movement by accelerometry,Medical Engineering & Physics, Vol. 30 (2008), 1364-1386.
[15] Smith, W.S.,The Scientist and Engineer’s Guide to Digital Signal Processing. Cal- ifornia Technical Publisher, USA (1999).
[16] Lyons, G.L., Understanding Digital Signal Processing. Prentice Hall PTR, USA (2001).
[17] Kammler, D.W.,A First Course in Fourier Analysis. Cambridge University Press, UK (2008).
[18] Mertins, A.,Signal Analysis: Wavelets, Filter Banks, Time-Frequency Transforms and Applications. John Wiley & Sons, England (1999).
[19] Lung, C., Oniga, S., Buchman, A., Tisan, A.,Wireless data acquisition system for IoT applications, Carpathian Journal of Electronic and Computer Engineering, Vol. 6 (2013), 64-67.
[20] Suto, J., Oniga, S., Orha, I., Microcontroller based health monitoring system, IEEE 19th International Symposium for Design and Technology in Electronic Pack- aging (SIITME), (2013), 227-230.
[21] Terdik, Gy., Gal, Z.,Advances and practice in Internet of Things: A case study, IEEE 4th International Conference on Cognitive Infocommunications, (2013), 435- 440.
[22] Berczes, T., Sztrik, J., Orosz, P., Moyal, P., Limnios, N., Georgiadis, S., Tool supported modeling of sensor communications networks by using finite-source priority retrial queues,Carpathian Journal of Electronic and Computer Engineering, Vol. 5 (2012), 13-18.
196 J. Sütő, S. Oniga, A. Buchman