IOP Conference Series: Materials Science and Engineering
PAPER • OPEN ACCESS
Application of Rietveld refinement in orientated material structures
To cite this article: E Nagy et al 2020 IOP Conf. Ser.: Mater. Sci. Eng. 903 012028
View the article online for updates and enhancements.
This content was downloaded from IP address 193.6.11.19 on 28/09/2020 at 15:23
12th Hungarian Conference on Materials Science (HMSC12)
IOP Conf. Series: Materials Science and Engineering 903 (2020) 012028
IOP Publishing doi:10.1088/1757-899X/903/1/012028
Application of Rietveld refinement in orientated material structures
E Nagy 1, F Kristály2, V Mertinger3
1 Researcher, MTA-ME Materials Science Research Group, H-3515 Miskolc- Egyetemvaros
2 Researcher, Institute of Mineralogy and Geology, University of Miskolc, H-3515 Miskolc-Egyetemvaros
3 Professor, Institute of Physical Metallurgy, Metalforming and Nanotechnology, University of Miskolc, H-3515 Miskolc-Egyetemvaros
E-mail: femzsofi@uni-miskolc.hu
Abstract. The phase analysis based on the X-ray diffraction method is a well-known procedure for determining the phases crystalline in the sample. The phase identification is simple in case of the isotropic powder samples, however the standard investigation protocol cannot always be used, e.g. in case if the presence of anisotropy like preferred orientation (PO) is observed. In case of steels, the diffracted intensity of a given phases is influenced by the directional phase development having a needle character caused by the martensitic transformation; some reflections can even disappear from the diffractograms as a consequence of the strong PO. One impacting consequence of PO is over quantitative evaluation, percentages close to actual values are obtained only if diffracted intensity is integrated for the whole measured 2θ range for each phase and anomalous intensities caused by PO are corrected.
Incorrect quantitative values were obtained by using the full-profile analysis method in the course of our earlier investigations, because no correction method had been available for the recognition and evaluation of the orientated structures in phase-identification of metals. By using the Rietveld refinement method for whole measured 2θ range, both the PO and the size-strain broadening effects are accounted for. Strain results from stress developing in the lattice and can be taken into consideration in the calculated model and results are corrected to accurately describe the real structure. In the course of our research work, orientated, complex structures developing in the Cu-base alloys were investigated by using the Rietveld refinement method.
The quantity of phases was determined in the different samples in which clear signs of the used technological processes could be observed in the structures. The character of orientation appearing in the structure was observed, evaluated and the necessary corrections were performed.
1. Introduction
Complex structures showing clearly anisotropic character (size, strain and crystallite arrangement) often develop in the course of the solidification or transforming during cooling in the metallic alloys [1]. The crystallite arrangement anisotropy – lack of randomness – results in the preferred orientation (PO) of phases. PO and the stress of lattice-structure are not taken into consideration by the majority of methods
12th Hungarian Conference on Materials Science (HMSC12)
IOP Conf. Series: Materials Science and Engineering 903 (2020) 012028
IOP Publishing doi:10.1088/1757-899X/903/1/012028
2
suitable for the exact determination of phases quantity during the identification of phases developed in the microstructure.
In case of alloys, the production as well as the applied technological processes leave clear signs in the microstructure. An oriented structure can develop under the influence of heat extraction in the cast structure while the uniaxial- or multiaxial deformation of the material occurs by the forming processes e.g. by rolling or drawing where the main orientation is determined by the direction of deformation [2,3].
The PO can appear in metals as a result of the different heat treatment methods as well, e.g. following the crystal-oriented phase transformation [4]. Moreover, it is very important to take into consideration the dissolution of the individual alloying elements in the crystal lattice and the change of unit cell building up the crystal lattice in case of the alloy-families [5].
The phase analysis based on the X-ray diffraction method is a basic procedure for determining the phases existing in the sample. It is a universally recognized method in case of isotropic materials consisting of some components (mainly in case of powder samples) however it is probable that the standard investigation protocol can rarely be used owing to the presence of anisotropy. The diffracted intensity received from the measured phases is influenced by the presence of PO; certain reflections can even be missing from the diffractogram. Quantitative results are strongly altered by presence of PO, since phase percentages are calculated from measured intensity. The presence of PO leaves a clear sign on the diffractogram, and it is necessary to identify these signs and correct their effect [6,7]. E.g. the strong PO for phase x on given d(001) peak results in increased measured diffracted intensity, which needs to be corrected in relation to all the measured peaks to obtain the theoretical intensity ration, a.k.a. relative intensity.
All the reflections coming from the material are taken into consideration in case of the phase analysis performed by using the full pattern analysis applied mostly in case of metallic materials. In an ideal case, the integrated intensity of all the possible reflections are taken into consideration for each phase existing in the material, however merely the reflection appearing in the diffractogram can be taken into consideration in case of orientated structures. Correction methods are available in this procedure, by which the presence of anisotropy can be taken into consideration and correct for the orientation effects, like March-Dollase or spherical harmonics [8]. A realistic structure can be described more exactly by using the Rietveld refinement method [9,10] which relies on minimizing the differences of the measured pattern in relation to a calculated pattern by minimizing the sum of least squares. The method is convolution based, instrumental profile is defined to calculate the individual diffraction pattern of the identified phases, while background and baseline are modelled by polynomial functions. Peak broadening is modelled by crystallite size and strain contribution. In case of the phase analysis performed by the Rietveld refinement method, it is possible to take into consideration and to correct both the PO and the strain accumulated in the lattice, while crystallite sizes are calculated [9]. During this procedure, each phase is fitted individually and the unique PO characterizing the phase and the lattice strain are corrected.
In the course of our experiments, the usability of Rietveld refinement method was investigated in the complex structures developing as a consequence of heat treatment and plastic deformation in the Cu- based alloys. The microstructure of samples was investigated by optical and electron microscopy method, the phases were identified by X-ray diffraction method. The phase amounts were determined by Rietveld refinement method.
2. Experimental
The investigations were performed on Cu-Zn alloy of Standard No. C35000 medium leaded brass. The composition of alloy can be seen in Table 1.
Table 1. Composition of C35000 alloy Chemical composition (wt%)
Cu Zn Pb Mn Si
59.3 36 1 2.2 1.5
12th Hungarian Conference on Materials Science (HMSC12)
IOP Conf. Series: Materials Science and Engineering 903 (2020) 012028
IOP Publishing doi:10.1088/1757-899X/903/1/012028
Samples of complex structures used for performing the investigations were obtained by heat treatment and plastic deformation. The heat-treated sample was homogenized at a temperature of 800°C for half an hour, it was tempered at 550°C for 4 hours and it was cooled on air. The plastic deformation of the hot-formed sample was performed by forging at a temperature of 750°C. The structure of samples was investigated by using optical- and scanning electron microscope (SEM); the chemical composition of phases was analysed by energy dispersive X-ray (EDX) microprobe. The phases developing in the microstructure were identified by X-ray diffraction (XRD) and they were matched with the microscopy results. Grinded and polished samples were used for the investigations, after etching with 5%
hydrochloric acid and ferric-chloride solution. A Zeiss Imager m1M type light microscope and a Zeiss EVO MA 10 type scanning electron microscope were used for the microscopic investigations performed in the Institute of Physical Metallurgy, Metalforming and Nanotechnology of University of Miskolc.
The XRD investigations were performed on a Bruker D8 Discovery XRD equipment, in Bragg-Brentano geometry with Cu Kα source (40 kV and 40 mA generator settings) in a range of 20-120 °(2θ), an increment of 0.01 °(2θ) and a counting time of 1s using a LynxEye X-ET energy dispersive detector with linear 2° opening. Evaluation was done in Bruker EVA 5.0 software and a PDF2 database were used for the identification of phases and Bruker TOPAS 6.0 software was used for Rietveld refinement.
The instrument is aligned with SRM NIST 1976b corundum standard and calibrated with SRM NIST 640d silicon powder standard. Instrumental profile is calculated with the Fundamental Parameters Approach (FPA), baseline is modelled with 1st order Chebyshev polynomial. PO is corrected with March-Dollase function [8] or spherical harmonic functions [10], where required. Peak broadening was resolved by simultaneous size and strain calculation by size(nm)=FWHM(2θ)*cos(θ)/λ and ε0=FWHM(2θ)/(4tanθ), a dimensionless parameter which can be related to distortion of lattice parameters. The two parameters were refined until the best fit, i.e. the smoothest difference curve was obtained. In cases when size-strain modelling did not resolve the measured pattern, a second structure of the same phase was implemented to distinguish between fractions defined by size range and/or strain amount. Measurements were made in the 3DLab Fine Structure Analysis laboratory of the University of Miskolc.
3. Results and Discussion
On the basis of the metallographic investigations, it was stated that oriented, long-shaped beta’-CuZn grains with protracted shape developed in the alpha-CuZn solid-solution matrix in the heat-treated structure created during the equilibrium cooling. A structure having a martensitic character was formed in the hot-forged sample as a consequence of the faster cooling process. In the microstructure, the alpha- CuZn solid solution forms well defined grains besides the beta’-CuZn acicular phase. The Pb droplets added to the alloy for the sake of the easier processing are distributed uniformly. The long-shaped phase, i.e. the Mn5Si3 compound-phase which is of blue colour (Fig 1) in etched state and can be recognised in the structure, develops during casting.
Heat treated (cross section) Hot forged (cross section) Figure 1. Optical microscopic images about the microstructure of samples
12th Hungarian Conference on Materials Science (HMSC12)
IOP Conf. Series: Materials Science and Engineering 903 (2020) 012028
IOP Publishing doi:10.1088/1757-899X/903/1/012028
4
Heat treated (cross section) Hot forged (cross section) Figure 2. Scanning electron microscopic images about the microstructure of samples
On the basis of EDX measurements and X-ray diffraction phase analysis, it can be stated that an alpha- CuZn solid solution (face centered cubic unit cell, space group Fm-3m (225), a: 3.697Å) and a beta’- CuZn (face centered cubic unit cell, space group Pm-3m (221), a: 2.949Å) phase as well as Mn5Si3
intermetallic phase (mavlyanovite, hexagonal unit cell, space group P63/mcm (193), a: 6.910Å, c:
4.8168182Å) and Pb (face centered cubic unit cell, space group Fm-3m(225), a: 3.704Å) can be identified in the alloy.
The exact quantity of phases can be obtained by Rietveld refinement in case if the phases contained in the alloy are known. In this paper, we show a step by step application of this method for oriented structures. In the course of Rietveld refinement, the measured curve obtained from the sample is fitted with the cumulative calculated curve obtained from the single curves calculated from identified phase’s crystal structures, comprising all the corrections (PO) and broadening modelling (size and strain) that we apply. We aim at minimizing the difference between the measured and calculated curve. Conclusions concerning the phenomena (e.g. orientation) causing the difference can be drawn from the shape of difference curve and from the absolute value of residual peaks on the difference curve.
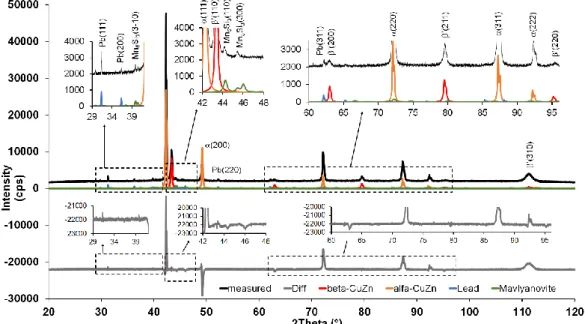
After identification of phases, the calculated patterns are fitted to the measured diffractogram (Fig. 3) without any PO correction, theoretical unit cell parameters, peak broadening modelled with crystallite size calculation.
Figure 3. Fitting the diffractogram of heat-treated sample, without PO correction, theoretical unit cell sizes
12th Hungarian Conference on Materials Science (HMSC12)
IOP Conf. Series: Materials Science and Engineering 903 (2020) 012028
IOP Publishing doi:10.1088/1757-899X/903/1/012028
Since unit cell parameters reflect the presence of alloying elements in the phases, this is the first parameter to be fitted, after which the peaks presenting PO and strain broadening can be identified. In Fig 3. and Fig 4. dotted line box marks the enlarged regions in which the differences after each step can be traced, beyond the more visible high intensity peaks. The residual peak intensities on the difference curve are significantly reduced by the fitting of cell parameter (Fig. 4).
The following step requires to perform the PO correction to the (hkl) peaks marked in Fig 4. With the March-Dollase function we can correct for two (hkl) series – defined by the user – of each phase.
Correcting for one or two (hkl) sets can be decided based on the peaks on the difference curve, as well as the corresponding values of (hkl), which may require several trials until the necessary correction is found.
In case of the alpha-CuZn solid solution, residual intensity value of the third peak (200) at 49°(2θ) on the difference curve decreases significantly as well, simultaneously with the PO correction for (111) at 43°(2θ) and (220) at 72°(2θ) peaks (Fig. 5A). Thereafter the difference curve was further reduced by modelling the lattice strain contribution to peak broadening. For the alpha-CuZn solid solution, the modelling of lattice strain contribution resulted in improvement for (111) and (022) peaks (Fig. 5B).
Presence of lattice strain is reasonable in case of an orientated structure obtained by thermal or mechanical processing. Intensity distribution on the difference curve as well as on the measured pattern (the reflection has got a shoulder) indicates the presence of second fraction for both α and β’-CuZn phases. This phenomenon is easily visualized by modelling crystallite size on calculated pattern, since the model applies lognormal distribution, thus any bimodal size distribution in the size broadening (after strain is taken into account!) is leaving peaks on the difference curve. Therefore, the introduction of a further phase in the model with identical crystal-structure but lower size and smaller lattice parameters becomes necessary and is supported by the minimization of the difference curve (Fig. 6A).
Figure 4. Fitting the diffractogram of heat-treated sample, unit cell parameter fitting, no PO correction It seems reasonable to perform the PO correction even for these second phases introduced into the model. In case of alpha2-CuZn phase, this step means the orientation correction of (311) and (400) peaks while in case of beta’2-CuZn phase, it means the orientation correction of (031) peak and by this action the difference curve is further minimized (Fig. 6A).
It is very important to note that this fraction having a lower crystallite size shows a clearly different orientation in the complex structure, both in case of alpha2-CuZn and beta’2-CuZn phases. In case of the alpha-CuZn phase, the introduction of a 3rd fraction arose as the difference curve, especially the peak at 114 °(2θ) was not solved under the influence of any fitting possibility.
12th Hungarian Conference on Materials Science (HMSC12)
IOP Conf. Series: Materials Science and Engineering 903 (2020) 012028
IOP Publishing doi:10.1088/1757-899X/903/1/012028
6
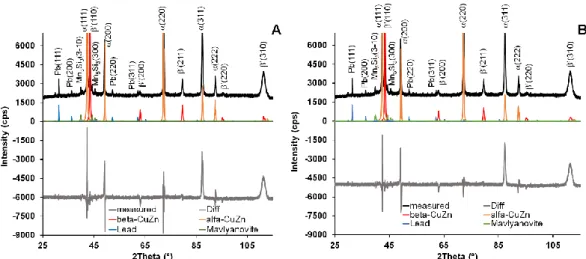
Figure 5. Fitting the diffractogram of heat-treated sample A: correction of PO, B: lattice strain correction
Figure 6. Fitting the diffractogram of heat-treated sample A: new size fraction introduced for alpha- and beta-CuZn, unit cell fitted and PO corrected; B: new fraction introducing
This 3rd phase with strong PO on (002) peak did solve the last major peak on the difference curve (Fig.
6B), thus its presence is reasonable.
Figure 7. Final fitting result with all corrections and modelling, heat treated sample (upper part omitted)
At last the refinement procedure is completed by fitting the Debye-Waller thermal parameters (Fig. 7).
As observed on the fitted pattern, only minor changes are obtained, while phase percentages (Table 2)
12th Hungarian Conference on Materials Science (HMSC12)
IOP Conf. Series: Materials Science and Engineering 903 (2020) 012028
IOP Publishing doi:10.1088/1757-899X/903/1/012028
are not affected significantly. The phase quantities obtained during the different fitting steps are shown in Table 2. During the first steps, the quantity of alpha-CuZn is approximately 60wt%, the sum of the two phases corresponds to this value when introducing the alpha2-CuZn phase as well. The quantity of beta’-CuZn phase is around 20-25wt%. As soon as the third alpha-CuZn fraction is introduced, the quantity of sum alpha decreases to about 30wt% while the quantity of beta’-CuZn reaches a value of more than 50wt%. It can clearly be observed from the change of phase quantities that the results obtained without performing the corrections does not reflect the real phase composition.
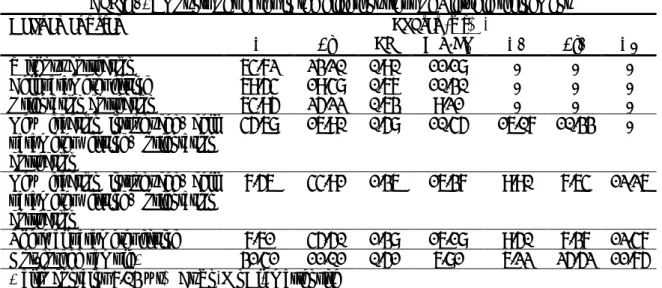
Table 2. Amounts of phases in the different steps of Rietveld refinement
Refinement step Phases (wt%)
’ Pb Mn5Si3 2 ’2 3
Without correction 64.72 23.20 0.90 11.18 - - -
Cell parameter fitting 69.54 19.48 0.67 10.30 - - -
Orientation correction 64.95 25.22 0.63 9.21 - - -
New fraction introduced, cell parameter fitting, orientation correction
45.68 16.90 0.58 10.45 16.07 10.33 -
New fraction introduced, cell parameter fitting, orientation correction
7.56 44.91 1.36 16.37 9.90 7.64 12.26
Thermal parameter fitting 7.61 45.50 1.38 16.18 9.50 7.37 12.47 Hot-forged sample* 31.41 11.01 0.51 6.81 6.22 25.52 11.75
* also contains 7.03 wt% CuZn(MnAl) martensite
In case of the forged samples, the changes caused by the solidification and transformation as well as by the plastic deformation were taken into consideration when fitting the complex structure. Based on the residual peaks of difference curves, a martensite phase of possible CuZn(Mn) composition was identified (Fig. 8).
Figure 8. Diffractogram of hot-forged sample, complete refinement (upper part omitted) As a discussion of limitations and possibilities of our calculations several remarks must be highlighted.
Most important is related to quantitative phase analysis, which is improved towards realistic sample values by the corrections but is limited only to that volume of sample which is penetrated by the X-rays.
Thus, such a measurement for metal or alloy block sample is problematic to carry out, since the distribution of phases is highly inhomogeneous. Even with all the correcting and measuring techniques an average (bulk) composition for block samples cannot be obtained with X-ray diffraction, it will always reflect the local composition of the illuminated area, depending on X-ray wavelength, instrumental configuration, sample stage and sample composition.
12th Hungarian Conference on Materials Science (HMSC12)
IOP Conf. Series: Materials Science and Engineering 903 (2020) 012028
IOP Publishing doi:10.1088/1757-899X/903/1/012028
8
Average phase quantitative composition can be obtained only on proper powder samples. Another issue is size distribution of phases. In the XRD evaluation phases are generally regarded as one single structure with the according size, not a realistic model for most materials. Hot-forging and heat treatment inevitably produces new size fractions of existing phases through recrystallization. These fractions can be evidenced by Rietveld refinement of XRD patterns, if all corrections and modelling are done properly.
4. Summary
Complex microstructures of alloys represent a problem in XRD analysis, due to preferred orientation, multimodal crystallite size distribution and lattice strain. These properties can be adequately modelled and corrected by Rietveld refinement to obtain reasonable quantitative phase composition and characterization of individual phases. The unit cell size, after fitting to the measured pattern gives information on alloying ratio, while strain present in the phase is also modelled. After PO corrections, the existence of multiple size +/- strain +/- orientation fractions are revealed for the modelled phases.
All the properties are in connection with processing of analyzed sample. In the case of heat treated CuZn material, the alpha-CuZn phase develops 3 fractions, while the sample was obtained in three steps:
homogenization at 800 °C, tempered at 550 °C and cooled in air. The Pb content, theoretical in the 0.8- 2.0 wt% range, is well reflected in the refinement. Also, phase transformation effect of forging is evidenced, probably left unrecognised without all the corrections and modelling. The 3rd fraction of alpha-CuZn represents a phase which is not influenced by heat treatment, neither forging, like relict grains of the original, unprocessed CuZn cast. Whatsoever, the numbering and development sequence of the different phase fractions is not readily linked to the processing steps, since it would require a step by step processing and Rietveld refinement investigation.
Acknowledgement
Supported by the ÚNKP-19-4 New National Excellence Program of the Ministry for Innovation and Technology.
References
[1] Fredrikson H, Akerlin U. 2012 Solidification and Crystallization Processing in Metals and Alloys (John Wiley & Sons Publication, Chichester) pp 267
[2] Verhoeven J.D 1975 Fundamentals of Physical Metallurgy (John Wiley & Sons Publication, New York)
[3] Van Vlack L.H. (1982) Materials forEngineering Concept and applications (Addison-Weslwy Publishing, Masssachusetts) pp. 71
[4] Brooks C.R 1982 Heat Tratment, Structure and Properties of Nonferrous Alloys (ASM, USA) pp 20.
[5] Askeland D.R. (1989) The Science and Engineering of Materials (PWS Publishing Company, Boston) pp.175
[6] Cullity B.D. 1956 Elements of X-ray Diffraction (Addison-Wesley, Massachusetts)
[7] Krawitz A. 2001 Introduction to Diffraction in Material Science (John Wiley & Sons Publication, New York) pp. 255
[8] Percharsky V.K, Zavalij P.Y 2003 Fundamentals of Powder Diffraction and Structural Characterization of Materials (Kluwer, Dordrecht)
[9] Young R.A ed. 1993) The Rietveld Method (Oxford University Press, Oxford)
[10] Popa N.C 2008 Microstructural properties: texture and macrostress effects, In Dinnebier R.E , Billinge S.J.L ed. 2008 Powder Diffraction:Theory and Practice (RoyalSociety of Chemistry, Cambridge)
[11] Velterop L et al 2000 J.Appl.Cryst. 33 296-306 [12] Bergmann J et al 2001 J.Appl.Cryst. 34 16-19