Environmental Science
Nano
rsc.li/es-nano
ISSN 2051-8153
PAPER Leanne M. Gilbertson et al.
Methodology for quantifying engineered nanomaterial release from diverse product matrices under outdoor weathering conditions and implications for life cycle assessment
Volume 4 Number 9 September 2017 Pages 1756-1912
Environmental Science
Nano
This is an Accepted Manuscript, which has been through the Royal Society of Chemistry peer review process and has been accepted for publication.
Accepted Manuscripts are published online shortly after acceptance, before technical editing, formatting and proof reading. Using this free service, authors can make their results available to the community, in citable form, before we publish the edited article. We will replace this Accepted Manuscript with the edited and formatted Advance Article as soon as it is available.
You can find more information about Accepted Manuscripts in the Information for Authors.
Please note that technical editing may introduce minor changes to the text and/or graphics, which may alter content. The journal’s standard Terms & Conditions and the Ethical guidelines still apply. In no event shall the Royal Society of Chemistry be held responsible for any errors or omissions in this Accepted Manuscript or any consequences arising from the use of any information it contains.
Accepted Manuscript
This article can be cited before page numbers have been issued, to do this please use: K. Bodó, Y.
Hayashi, G. Gerencsér, Z. László, A. Kéri, G. Galbács, E. Telek, M. Mészáros, M. Deli, B. Kokhanyuk, P.
Németh and P. Engelmann, Environ. Sci.: Nano, 2020, DOI: 10.1039/C9EN01405E.
Environmental significance statement
Silver and gold nanoparticle-based products have been broadly utilized in both commercial and biomedical fields, and their potential ecotoxicological impacts should be further considered. In particular, harmful effects on the immune systems may result in an undesirable physiological consequence of the exposed organisms. Using macrophage-like cells (coelomocytes) separately harvested from two closely-related Eisenia species of earthworms, we compared their biological responses to silver/gold nanoparticles at molecular and cellular levels. Our in vitro findings reinforce the existence of species-specific responses towards nanoparticles, which may influence the organism's susceptibility. As nanoparticles behave differently from classical environmental contaminants, additional concerns should be given for species extrapolation from ecotoxicological models to higher or even closely-related organisms.
3 4 5 6 7 8 9 10 11 12 13 14 15 16 17 18 19 20 21 22 23 24 25 26 27 28 29 30 31 32 33 34 35 36 37 38 39 40 41 42 43 44 45 46 47 48 49 50 51 52 53 54 55 56 57 58 59
Environmental Science: Nano Accepted Manuscript
Published on 10 September 2020. Downloaded by Cornell University Library on 9/10/2020 3:42:06 PM.
View Article Online DOI: 10.1039/C9EN01405E
SPECIES-SPECIFIC SENSITIVITY OF EISENIA EARTHWORMS TOWARDS NOBLE METAL NANOPARTICLES: A MULTIPARAMETRIC IN VITRO STUDY Kornélia Bodó1, Yuya Hayashi2, Gellért Gerencsér3, Zoltán László4, Albert Kéri5,6, Gábor Galbács5,6, Elek Telek7, Mária Mészáros8, Mária A. Deli8,9, Bohdana Kokhanyuk1, Péter Németh1, Péter Engelmann1,*
1Department of Immunology and Biotechnology, Clinical Center, Medical School, University of Pécs, Pécs, Hungary
2Department of Molecular Biology and Genetics, Aarhus University, Aarhus, Denmark
3Department of Public Health Medicine, Medical School, University of Pécs, Pécs, Hungary
4Department of Medical Microbiology and Immunology, Medical School, University of Pécs, Pécs, Hungary
5Department of Inorganic and Analytical Chemistry, Faculty of Science and Informatics, University of Szeged, Szeged, Hungary
6Department of Material Science, Interdisciplanary Excellence Center, University of Szeged, Szeged, Hungary
7Department of Biophysics, Medical School, University of Pécs, Pécs, Hungary
8Institute of Biophysics, Biological Research Centre, Szeged, Hungary
9Department of Cell Biology and Molecular Medicine, University of Szeged, Szeged, Hungary
*Corresponding author:
Department of Immunology and Biotechnology, Clinical Center, Medical School, University of Pécs, Pécs, H-7643, Szigeti u. 12, Hungary. Tel: + 36-72-536-288, Fax: + 36-72-536-289, email: engelmann.peter@pte.hu
3 4 5 6 7 8 9 10 11 12 13 14 15 16 17 18 19 20 21 22 23 24 25 26 27 28 29 30 31 32 33 34 35 36 37 38 39 40 41 42 43 44 45 46 47 48 49 50 51 52 53 54 55 56 57 58 59
Environmental Science: Nano Accepted Manuscript
Published on 10 September 2020. Downloaded by Cornell University Library on 9/10/2020 3:42:06 PM.
View Article Online DOI: 10.1039/C9EN01405E
Abstract
Two closely-related earthworm species (Eisenia spp.) have long been used as model organisms in ecotoxicology. The same nanoparticles (NPs) may affect the two species differently, not only because of the inherent differences in susceptibility but also due to how immune system could recognize NPs. In a comparative approach using E. andrei and E.
fetida, we study various immune-related parameters of earthworm coelomocytes following in vitro exposure to 10 nm NPs (silver, Ag; and gold, Au) or dissolved Ag (AgNO3). In general, E. fetida coelomocytes were more susceptible to AgNPs and AgNO3 while AuNPs did not show cytotoxicity. At the sub-cellular level, AgNPs similarly affected cellular redox reactions in both species, however, E. fetida showed greater responses for apoptosis-related endpoints.
At the molecular level, AgNPs (at 24 h LC20) induced a significantly high level of superoxide dismutase in E. andrei coelomocytes while E. fetida was additionally characterized by consistent induction of metallothionein and differential capacity for redox/metal regulation.
Although AuNPs were not cytotoxic, both NP types (Ag and Au) seemed to alter the expression pattern of immune-related genes (toll-like receptor and lysenin) in both species, but more clearly in E. fetida. We further observed that lysenin proteins, while secreted differentially between the two species, bind only to AgNPs resulting in negative secretion feedback. Our findings support the general preference of E. fetida in ecotoxicology, and reveal the potential roles of protective and immune mechanisms optimized for each species in its own ecological niche.
Keywords: innate immunity, coelomocytes, AgNP, AuNP, apoptosis, gene expression pattern
3 4 5 6 7 8 9 10 11 12 13 14 15 16 17 18 19 20 21 22 23 24 25 26 27 28 29 30 31 32 33 34 35 36 37 38 39 40 41 42 43 44 45 46 47 48 49 50 51 52 53 54 55 56 57 58 59
Environmental Science: Nano Accepted Manuscript
Published on 10 September 2020. Downloaded by Cornell University Library on 9/10/2020 3:42:06 PM.
View Article Online DOI: 10.1039/C9EN01405E
1. Introduction
Eisenia andrei and E. fetida are two closely-related earthworm species widely used in standardized ecotoxicological testing and discerned as separate species by their minor morphological features. In fact, their natural living environment fundamentally indicates dissimilarities in the niche; more specifically, E. andrei can be present in manure and compost while E. fetida subsists in moist forest soil, however both Eisenia spp. frequently constitute mixed colonies1, 2. Historically either E. andrei or E. fetida were used for a given set of experiments3-5. This also holds true for the ecotoxicological research on emerging classes of nanomaterials such as silver nanoparticles (AgNPs)6-10 that could be released to the environment11. Even under a controlled experimental setup, however, species differences are indeed considered to be a confounding factor in nanotoxicology due to the formation of species-specific biomolecular coronas potentially in the external milieu (secreted proteins) but also following NP entry into the body (fluid) of an exposed organism12. Species differences in the later case have been experimentally proved for earthworms, although only in an artificial in vitro setting, where the same NPs with cognate protein corona were preferentially accumulated by immune cells as compared to those with entirely exotic corona formed of fetal bovine serum13. Interestingly, the Eisenia sp. specific gene lysenin has a differential basal expression level between E. andrei and E. fetida2, 14, and the encoded protein family was evidently a predominant component of the species-specific protein corona around AgNPs12. Despite this emerging paradigm in Eisenia earthworms, parallel toxicological and immunobiological studies barely exist to discover the fine differences at certain biological levels of these two closely-related species2, 15.
Recently the exact genetic distinction between the two species has been solved by species-specific primers for mitochondrial gene cytochrome oxidase (COI) I subunit2, and this
3 4 5 6 7 8 9 10 11 12 13 14 15 16 17 18 19 20 21 22 23 24 25 26 27 28 29 30 31 32 33 34 35 36 37 38 39 40 41 42 43 44 45 46 47 48 49 50 51 52 53 54 55 56 57 58 59
Environmental Science: Nano Accepted Manuscript
Published on 10 September 2020. Downloaded by Cornell University Library on 9/10/2020 3:42:06 PM.
View Article Online DOI: 10.1039/C9EN01405E
has made a comparative study possible with a clear genotype. In this work we aimed at exploring species-specific aspects in the stress and immune responses of the two species to 10 nm AgNPs with comparisons to another noble metal NPs (AuNPs) and to dissolved Ag (AgNO3) as a non-NP counterpart. We chose 10 nm AgNPs as model NPs because they are available as an OECD benchmark material for nanotoxicology testing, and we have previously studied several different types/sizes of AgNPs in vitro and in vivo in Eisenia earthworms10, 12, 16. In particular, the in vitro approach makes the comparison of the two species easier and allows us to focus on the immunologically-relevant mechanistic (rather than ecological) aspects.
Earthworm coelomocytes constitute the cellular arm of innate immunity and are classified into amoebocyte and eleocyte subpopulations, the former of which is considered to be ancestors of vertebrate macrophages14, 17. In addition, the coelomic fluid that accommodates coelomocytes possesses a wide range of bioactive molecules (fetidin/lysenin, lysozyme, and lumbricin) that comprise the humoral arm of earthworm immunity18-21 and are potential opsonins of NPs that could be recognized by the amoebocytes as previously demonstrated16. In fact, this would make the amoebocyte subpopulation more susceptible to AgNPs while the dissolved counterpart and heavy metals in general are known to affect both amoebocytes and eleocytes, the latter of which may actually be more vulnerable8, 9, 22.
The endpoints selected are oxidative stress, DNA damages and apoptosis as well as expression of genes considered as biomarkers of stress and immune responses10, 12, 16. This is in line with our choice of NPs; it is generally accepted that oxidative dissolution of AgNPs and thus the release of bioactive Ag ions results in excess reactive oxygen species (ROS) generation leading to DNA damages and apoptotic responses11, 23, 24. In contrast, AuNPs may serve as a negative control for these processes since they are highly resistant to oxidative dissolution. They are nonetheless of interest in the context of sub-lethal endpoints as
3 4 5 6 7 8 9 10 11 12 13 14 15 16 17 18 19 20 21 22 23 24 25 26 27 28 29 30 31 32 33 34 35 36 37 38 39 40 41 42 43 44 45 46 47 48 49 50 51 52 53 54 55 56 57 58 59
Environmental Science: Nano Accepted Manuscript
Published on 10 September 2020. Downloaded by Cornell University Library on 9/10/2020 3:42:06 PM.
View Article Online DOI: 10.1039/C9EN01405E
somewhat inconsistent results have been reported, indicating the unpredictable nature of NP toxicity25.
Here we ascertained marked contrast of the two earthworm species in the susceptibility of coelomocytes to AgNPs in vitro. To the contrary, AuNP exposure had no detectable effects on cell viability of coelomocytes from both species, but it clearly affected gene-, and protein expression of lysenin. To the best of our knowledge, this is the first report that describes a direct comparison of earthworm coelomocytes from the two closely-related species E. andrei and E. fetida on the molecular/cellular toxicity of AgNPs and AuNPs. We further aim to link the ex situ lysenin/protein-corona formation and protein secretion to the observed responses of coelomocytes.
2. Materials and methods 2.1. Earthworm husbandry
Adult (clitellated) E. andrei and E. fetida earthworms were maintained under standard laboratory conditions and collected from breeding stocks26. One day before coelomocyte isolations earthworms were placed onto moist tissue paper for depuration to minimize soil contaminations during coelomocyte harvesting. The genotypes of the two species were validated according to Dvořák et al., (2013)2.
2.2. Extrusion of coelomocytes and in vitro exposure conditions
Coelomocytes were separately harvested from E. andrei and E. fetida earthworm species in the same manner as we described earlier21 and detailed in the electronic supplementary information (ESI). Following the cell isolations and enumerations (5×10⁵ cells), coelomocytes were exposed to different concentrations of NPs (1.25-40 µg/mL) for several time points (1-24 h) in RPMI-1640 cell culture media (with HEPES 3.5 g/L, pH 7.4)
3 4 5 6 7 8 9 10 11 12 13 14 15 16 17 18 19 20 21 22 23 24 25 26 27 28 29 30 31 32 33 34 35 36 37 38 39 40 41 42 43 44 45 46 47 48 49 50 51 52 53 54 55 56 57 58 59
Environmental Science: Nano Accepted Manuscript
Published on 10 September 2020. Downloaded by Cornell University Library on 9/10/2020 3:42:06 PM.
View Article Online DOI: 10.1039/C9EN01405E
supplemented with 1% penicillin/streptomycin (100 U/mL penicillin and 100 µg/mL streptomycin, Lonza, Basel, Switzerland) and 1% heat-inactivated FBS (Euroclone, Milan, Italy) and placed onto 24-well plates16. Where interference is expected in colorimetric measurements, phenol red-free RPMI was used instead. Double-distilled-water (ddH2O) served as a negative control (in the same volume as the highest concentration of AgNP treatments) and AgNO3 as a positive control for dissolved Ag cytotoxicity16. During flow cytometry-based detections only amoebocytes were gated for the analysis as the eleocyte population has a high autofluorescence level.
2.3. Nanoparticles
Polyvinylpyrrolidone (PVP)-capped 10 nm AgNPs and AuNPs (1 mg/mL, BioPure) were purchased from NanoComposix (San Diego, CA, USA) and stored at 4 oC in the dark according to the manufacturer’s instructions. Dissolved AgNO3 was purchased from Sigma- Aldrich (Budapest, Hungary).
2.4. Physico-chemical characterization of NPs
Highest applied concentrations of 10 nm AgNP and AuNP (40 µg/mL) was incubated for 24 h at room temperature (RT) in ddH2O, PBS, RPMI-1640, RPMI-1640 supplemented with 1% FBS. The light absorbance profile (characteristic to the localized surface plasmon resonance of those NPs) was studied by UV/VIS spectrophotometry to determine the aggregation states and particle morphology under exposure conditions. After desalting, particle sizes and morphology of NPs were also investigated at high resolution using a transmission electron microscope (TEM)16. The hydrodynamic size and polydispersity index (PdI) of NPs under exposure conditions were determined by a dynamic light scattering (DLS) device (Zetasizer Nano ZS, Malvern Panalytical, Worcestershire, UK). Likewise, zeta
3 4 5 6 7 8 9 10 11 12 13 14 15 16 17 18 19 20 21 22 23 24 25 26 27 28 29 30 31 32 33 34 35 36 37 38 39 40 41 42 43 44 45 46 47 48 49 50 51 52 53 54 55 56 57 58 59
Environmental Science: Nano Accepted Manuscript
Published on 10 September 2020. Downloaded by Cornell University Library on 9/10/2020 3:42:06 PM.
View Article Online DOI: 10.1039/C9EN01405E
potentials were measured but after three washing steps with ddH2O (3×20 min, 18 kRCF) to remove serum proteins and minimize electrolyte concentrations16, 27. For the quantification of dissolved ion concentrations, NPs were pelleted by ultracentrifugation (1 h, 164-192 kRCF, 4
oC) and metal concentrations in the supernatant were analyzed by inductively-coupled plasma mass spectrometry (ICP-MS). More details of the particle characterization are provided in the ESI.
2.5. Concentration-response curve fitting, and the choice of test concentrations
Concentration-response curves were fitted to the results obtained from live/dead cell assays in order to estimate LCx values for 24 h exposure (see ESI for details). To further study the cytotoxicity mechanisms, we chose a high concentration range for AgNPs (15, 30 and 40 µg/mL) and the highest AgNO3 concentration at which >95% of cells were affected (1.35 µg/mL) to ensure a high signal-to-noise ratio at earlier time points than 24 h. As AuNPs did not induce cytotoxicity at any of the concentrations tested, we chose 20 µg/mL as an intermediate concentration comparable to the AgNP treatments. Where possible, the same live/dead stain 7-AAD (Biotium, Fremont, CA, USA) was used in combination with functional stains in flow cytometry to exclude dead cells or cells with leaky membranes from analysis. For sub-lethal endpoints such as gene and protein expression profiles, we used average LC20 values referred to as "low-cytotoxic concentrations" (AgNP: E. andrei 2.71 µg/mL and E. fetida 2 µg/mL; AgNO3: 0.20 µg/mL) as well as 20 µg/mL AuNP for a comparison.
2.6. Flow cytometric analysis of oxidative, and mitochondrial stress
Following exposure to selected concentrations of AgNP, AuNP or AgNO3, the amoebocyte population of coelomocytes were evaluated for oxidative and mitochondrial
3 4 5 6 7 8 9 10 11 12 13 14 15 16 17 18 19 20 21 22 23 24 25 26 27 28 29 30 31 32 33 34 35 36 37 38 39 40 41 42 43 44 45 46 47 48 49 50 51 52 53 54 55 56 57 58 59
Environmental Science: Nano Accepted Manuscript
Published on 10 September 2020. Downloaded by Cornell University Library on 9/10/2020 3:42:06 PM.
View Article Online DOI: 10.1039/C9EN01405E
stress parameters (intracellular ROS level, nitric oxide production, caspase-3 activity and mitochondrial membrane potentials) applying cell permeable fluorescent dyes (Biotium) by flow cytometry. Stainings were performed following the manufacturer's instructions and described in details in ESI.
The measurements and data analyses were performed using a FACSCalibur (Beckton Dickinson, Frankin Lakes, NJ, USA) flow cytometer and a FCS Express (DeNovo Software, Glendale, CA, USA) software, respectively.
2.7. Apoptosis detection by TUNEL-assay
To verify apoptosis induction determined by the caspase-3 activity study above, Click- it Plus TUNEL Assay (modified terminal deoxynucleotidyltransferase-dUTP nick end labelling) with Alexa Fluor 488 fluorescent dye (Life Technologies, Carlsbad, CA, USA) was applied to detect the double-stranded DNA-breakage at 24 h exposure. Coelomocytes (80 µL from 5×10⁵/mL) were spread onto glass slides using Cytospin 3 (SHANDON, Thermo Scientific, Waltham, MA, USA) apparatus. Slides were dried at RT overnight, before the assay was performed according to the manufacturer’s instructions. Cell nuclei were counterstained with 4’,6-diamidino-2-phenylindole, dihydrochloride (DAPI, 10 µg/mL, Life Technologies) and then observed using an Olympus BX61 microscope and an AnalySIS software (Olympus Hungary, Budapest).
2.8. Comet assay
To study the DNA damage by Comet assays, coelomocytes (106 cells) were exposed for 24 h to AgNPs, AuNPs or AgNO3 or the positive control UV-C for 30 s. Following two washing steps with LBSS (5 min, 100 RCF) alkaline-based sandwich-agarose gel technique was applied on slides according to previous studies28. Briefly, Normal Melting Point agarose-
3 4 5 6 7 8 9 10 11 12 13 14 15 16 17 18 19 20 21 22 23 24 25 26 27 28 29 30 31 32 33 34 35 36 37 38 39 40 41 42 43 44 45 46 47 48 49 50 51 52 53 54 55 56 57 58 59
Environmental Science: Nano Accepted Manuscript
Published on 10 September 2020. Downloaded by Cornell University Library on 9/10/2020 3:42:06 PM.
View Article Online DOI: 10.1039/C9EN01405E
gel (NMA, 0.5%) constituted the first layer and coelomocytes were mixed into the second layer with Low Melting Point agarose gel (LMA, 0.5%), that was covered by another LMA- layer without cells to form the third layer. Thereafter slides were placed in a lysing-solution (1% sodium sarcosinate, 2.5 M NaCl, 100 mM Na2-EDTA, 1% Triton X-100, 10% DMSO, and 10 mM Tris) for overnight incubation in the dark at 4 oC. The next day, slides were kept in cold electrophoresis buffer (200 mM EDTA, 10 N NaOH, pH: 10) for 20 min. DNA- strains electrophoresis was performed in the same buffer for 40 min at 0.46 mV/cm and 132 mV in the dark. Slides were washed with a neutralizing solution (0.4 M Tris) three times for 5 min and stained with ethidium bromide. At least 80 individual cells were scrutinized from each treatment under an Olympus BX50 fluorescent microscope with 400x magnification and evaluated by an image analysis software (Comet assay IV; Perceptive Instruments Ltd., Bury St Edmunds, UK). Tail Moment values (TM, the extent of the head and tail, size of the head and the strength of fluorescent intensity) were measured for the analysis.
2.9. Gene expression profiling
Coelomocytes were exposed (5×10⁵ cells/well) for 2, 12 and 24 h to low-cytotoxic concentrations (LC20) of AgNPs (E. andrei 2.71 µg/mL, E. fetida 2 µg/mL) or AgNO3 (0.20 µg/mL), or 20 µg/mL AuNP for a comparison as above. Five independent experiments were performed for all conditions. At each time point, coelomocytes were collected and washed twice with LBSS (5 min, 100 RCF). Total RNA extraction and cDNA synthesis were performed following the manufacturer's instructions (High-Capacity cDNA reverse transcription kit, Thermo Scientific) and described in details in ESI, along with the temperature setting used for quantitative real-time PCR (qPCR).
For SYBR Green-based qPCR, the cDNA templates were mixed with gene-specific primer pairs designed using a Primer Express software (Thermo Scientific) and the primer
3 4 5 6 7 8 9 10 11 12 13 14 15 16 17 18 19 20 21 22 23 24 25 26 27 28 29 30 31 32 33 34 35 36 37 38 39 40 41 42 43 44 45 46 47 48 49 50 51 52 53 54 55 56 57 58 59
Environmental Science: Nano Accepted Manuscript
Published on 10 September 2020. Downloaded by Cornell University Library on 9/10/2020 3:42:06 PM.
View Article Online DOI: 10.1039/C9EN01405E
sequences are summarized in Table S1. The raw fluorescence qPCR data was used to calculate the amplification kinetics and thus the initial quantity of template cDNA (R0) using DART-PCR29. For normalization of the calculated R0 values, we tested both the conventional housekeeping gene approach (RPL17 as the internal reference gene) and using the data-driven algorithm NORMA-gene30. We opted for the latter approach as it proved more conservative (i.e. minimal influence on the inter-group variation) and effective normalization (i.e. reduction in the intra-group variation). The NORMA-gene normalized R0 values were then presented relative to the geometric means of the control values at each corresponding time point.
Heatmaps were created on log2-transformed and scaled datasets using the gplots package (ver.
3.0.1.1) in the R environment (ver. 3.5.1.).
For multivariate analyses of the gene expression datasets, principal component analysis (PCA) and correspondence analysis (CA) were performed using the FactoMineR (ver. 1.41)31 and factoextra (ver. 1.0.5) packages for R. For PCA, the gene expression values were log2-transformed and scaled. We performed PCA to reduce the dimensionality of the data so as to identify general variations among categories such as species, exposure duration and treatments as well as their combinations. CA was performed without standardization (i.e.
scaling) to visualize the treatment-specific gene expression patterns over time.
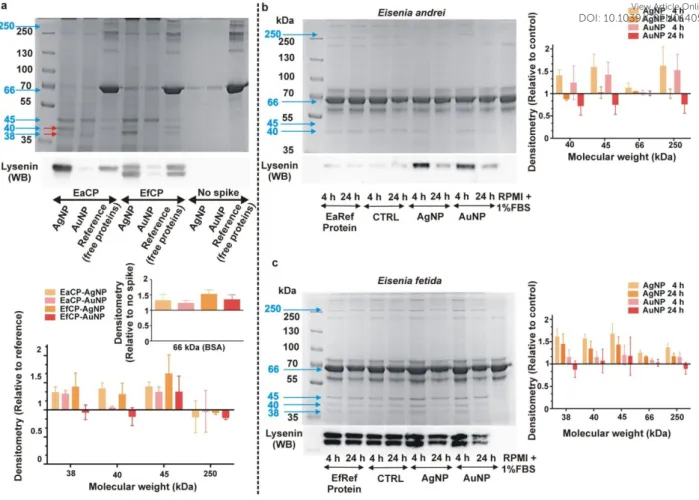
2.10. Profiling of ex-situ protein coronas around nanoparticles
To study the composition of protein coronas around AgNPs and AuNPs, we applied the same methods as described in Hayashi et al., (2013)12 with some modifications. Briefly, to obtain coelomic proteins (CP) from the coelomocyte culture, the cells (5×10⁵ cells/mL) were incubated for 24 h at RT in RPMI cell culture media without serum supplement. The culture medium was then aspirated and centrifuged (5 min, 500 RCF) to remove cells. The supernatants were centrifuged again (10 min, 1700 RCF) and filter-sterilized (through 0.22
3 4 5 6 7 8 9 10 11 12 13 14 15 16 17 18 19 20 21 22 23 24 25 26 27 28 29 30 31 32 33 34 35 36 37 38 39 40 41 42 43 44 45 46 47 48 49 50 51 52 53 54 55 56 57 58 59
Environmental Science: Nano Accepted Manuscript
Published on 10 September 2020. Downloaded by Cornell University Library on 9/10/2020 3:42:06 PM.
View Article Online DOI: 10.1039/C9EN01405E
µm membrane filters), after which the CP was collected in Protein LoBind tubes (Eppendorf, Hamburg, Germany). According to the earthworm species from which the CP was derived, it was named EaCP or EfCP (E. andrei and E. fetida coelomic protein, respectively). Total protein concentrations of the CPs were quantified using a BCA-kit (Sigma-Aldrich) and were typically in the range of 250-300 µg/mL. As these concentrations were not high enough to serve as an alternative to 1% FBS (400-600 µg protein/mL), we decided to spike the CP in BSA protein background, achieving a total of 800 µg protein/mL of which 100 µg/mL was CP and 700 µg/mL was BSA. This represents a >5-fold higher protein concentration sufficient to cover the theoretical total surface area of 20 µg of 10 nm AgNPs (106 µg proteins to 11 cm2 AgNP surface) and 10 nm AuNPs (58 µg proteins to 6 cm2 AuNP surface). In line with these calculations, we used 1 mL of 20 µg/mL AgNPs and AuNPs. As for the control, we used the same incubation condition without the CP spike. Samples were incubated on an end- over-end rotator for 24 h at RT in the dark, and then were centrifuged for 30 min at 16 kRCF at 21 oC. Supernatants were removed and NPs washed three times with PBS (30 min, 16 kRCF, 21 oC). After the final washing step 2×SDS sample loading buffer was added and samples were boiled for 5 minutes, followed by another centrifugation (30 min, 16 kRCF, 4
oC) to pellet NPs. Supernatants were stored at -80 oC. SDS-PAGE and Coomassie-Brilliant Blue staining were performed as per standard protocols. Reference protein samples were prepared directly from CP (i.e. without incubation with NPs) for comparison with corona proteins on NPs. Images were analyzed with a VilberLourmat Bio-Profil Version 97 gel documentation system (Collégien, France) and a Biocapture Version 12.6 software. In addition, protein identification of excised bands by liquid chromatography combined tandem mass spectrometry (LC-MS/MS) and Western blots (WB) were performed to precisely identify the discrete bands. Specific details of LC-MS/MS measurements and WB are provided in the ESI.
3 4 5 6 7 8 9 10 11 12 13 14 15 16 17 18 19 20 21 22 23 24 25 26 27 28 29 30 31 32 33 34 35 36 37 38 39 40 41 42 43 44 45 46 47 48 49 50 51 52 53 54 55 56 57 58 59
Environmental Science: Nano Accepted Manuscript
Published on 10 September 2020. Downloaded by Cornell University Library on 9/10/2020 3:42:06 PM.
View Article Online DOI: 10.1039/C9EN01405E
2.11. Analysis of NP-induced protein secretion
Protein secretion profile was examined according to Hayashi et al., (2016)32. Initially, coelomocytes (5×10⁵ cells/sample) were exposed for 4 h and 24 h at RT to the corresponding concentrations of NPs under the same exposure conditions as used in the gene expression study. Vehicle controls were prepared by adding ddH2O to cells instead of NPs. Following incubations, the culture supernatant (including NPs) was collected into a Protein LoBind tube (Eppendorf), spun down (5 min, 500 RCF) to remove cells and centrifuged again (10 min, 1700 RCF). The total protein concentrations were quantified using a BCA-kit (Sigma- Aldrich) and adjusted to 400-600 µg/mL. SDS sample buffer was added to a small aliquot of the cell-free supernatant and boiled for 5 min. To remove NPs, samples were centrifuged (30 min, 16 kRCF, 4oC), then SDS-PAGE and Coomassie-Brilliant Blue staining was performed as per standard protocols. Image J (NIH) was employed for densitometry analysis.
2.12. Statistical analyses
Each experiment (except qPCR) was repeated three independent times (n=3).
Statistical analyses were carried out with Prism v5.0 (GraphPad Software, La Jolla, CA, USA). Distribution of normality was overseen prior to additional statistical tests (Shapiro- Wilk Normality Test). All data are presented with the mean and standard error of the mean (SEM). Results were analysed by one-way ANOVA with Kruskal-Wallis test followed by Dunn’s post hoc test. The significance level of = 0.05 was applied for all statistical tests.
For qPCR datasets, the relative gene expression values were log-transformed to satisfy the assumption of normality. Student’s t-test (or Welch’s t-test where appropriate) was performed in R following Levene’s test on the homogeneity of variances. Significant differences between controls and treatments at each time point were determined as = 0.05.
3 4 5 6 7 8 9 10 11 12 13 14 15 16 17 18 19 20 21 22 23 24 25 26 27 28 29 30 31 32 33 34 35 36 37 38 39 40 41 42 43 44 45 46 47 48 49 50 51 52 53 54 55 56 57 58 59
Environmental Science: Nano Accepted Manuscript
Published on 10 September 2020. Downloaded by Cornell University Library on 9/10/2020 3:42:06 PM.
View Article Online DOI: 10.1039/C9EN01405E
3. Results and discussion
3.1. Physico-chemical characterization of NPs under exposure conditions
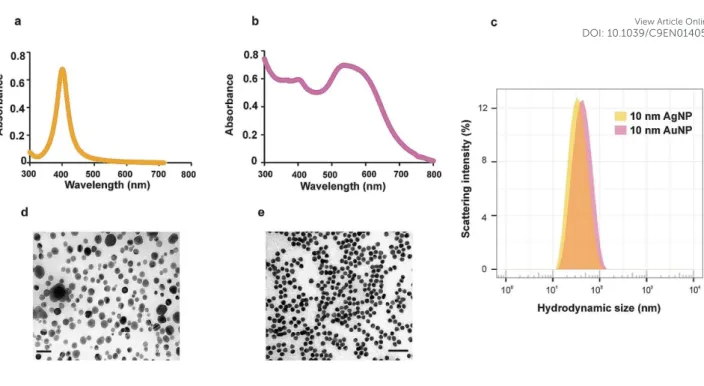
Characterization of NPs under the exposure conditions is essential since any biased physico-chemical factors could dramatically influence the cellular response33. Even in the high electrolyte and protein-rich milieu, AgNPs revealed a narrow absorbance peak characteristic of localized surface plasmon resonance, suggesting a monodispersed population (Fig. 1a). This was further supported by DLS and TEM (Table 1, Fig. 1c and d), where they also showed a narrow hydrodynamic size distribution, low PdI (Table 1) and no signs of particle aggregation, respectively. AuNPs, on the other hand showed a broader peak in the absorbance spectrum indicating heterogeneity in localized surface plasmon resonance due to the presence of multimeric clusters rather than singly dispersed particles (Fig. 1b). The mean hydrodynamic size and PdI were also a little larger than that of AgNPs (Table1 and Fig. 1c), although the inherent particle size as observed in TEM was smaller (Fig. 1e). These characterization results suggest that, while some degree of protein-induced agglomeration is apparent in AuNPs, the NPs were in general colloidally stable under the exposure conditions used in this study.
Oxidative dissolution of metal NPs, AgNPs in particular, is a critical process that can obscure the NP-specific effects on toxicity as the ionic counterpart is known to be highly bioactive24. To address this problem, the dissolved metal ion concentrations were determined by ICP-MS analysis after removal of NPs by ultracentrifugation. The results suggest that oxidative dissolution under the exposure conditions is not a major concern in both NP types, as dissolved fraction was only <0.4% of the total metal mass (Table 1). For the highest concentration of AgNPs used in this study, the dissolved Ag was 0.16 µg/mL, corresponding lower concentration regime used for the AgNO3 treatment.
3 4 5 6 7 8 9 10 11 12 13 14 15 16 17 18 19 20 21 22 23 24 25 26 27 28 29 30 31 32 33 34 35 36 37 38 39 40 41 42 43 44 45 46 47 48 49 50 51 52 53 54 55 56 57 58 59
Environmental Science: Nano Accepted Manuscript
Published on 10 September 2020. Downloaded by Cornell University Library on 9/10/2020 3:42:06 PM.
View Article Online DOI: 10.1039/C9EN01405E
3.2. Concentration-dependent cytotoxicity is evoked by AgNPs but not AuNPs
We first determined the concentration-response relationship, based on which we selected test concentrations for further analysis on sub-lethal endpoints. Following 24 h exposure to a series of concentrations (1.25-40 µg/mL for AgNPs and AuNPs, 0.05-1.35 µg/mL for AgNO3), the survival rate of coelomocytes was evaluated by 7-AAD, a cell membrane-impermeant nuclear stain. In the flow cytometry analysis, we referred to the amoebocyte population as the surrogates for total coelomocytes, because eleocytes (the other major population of coelomocytes) possess a high riboflavin content that results in strong autofluorescence1. On the other hand, a recent study8 claims that amoebocytes and eleocytes have dissimilar sensitivity towards AgNPs. It is plausible, however, the different cytotoxic response in AgNP-exposed coelomocytes can be explained by the fact that amoebocytes (and not eleocytes) rapidly internalize AgNPs as verified by TEM16, and thus eleocytes could be affected rather indirectly.
In both earthworm species, AgNP (and AgNO3 at lower concentrations) but not AuNPs exerted concentration-dependent cytotoxicity within the concentration range tested (Fig. S1). This also verifies that the dissolved fraction of AgNPs (<0.4% of total Ag) did not follow the concentration-response curve established for the AgNO3 treatment. As for the species differences, coelomocytes from E. fetida showed higher sensitivity towards AgNPs and AgNO3 than E. andrei coelomocytes based on the estimated lower LCx values and the steeper Hill-Slopes (Table S2). Based on the concentration-response curves established here we selected a high concentration series of AgNPs (15, 30 and 40 µg/mL) to study time points earlier than 24 h, and an intermediate AuNP concentration (20 µg/mL) with reference to AgNPs as no changes in the cell viability was observed. For gene and protein expression studies, we opted for low-cytotoxic concentrations (LC20) determined for AgNPs and AgNO3, while AuNPs were tested at the same concentration as above10.
3 4 5 6 7 8 9 10 11 12 13 14 15 16 17 18 19 20 21 22 23 24 25 26 27 28 29 30 31 32 33 34 35 36 37 38 39 40 41 42 43 44 45 46 47 48 49 50 51 52 53 54 55 56 57 58 59
Environmental Science: Nano Accepted Manuscript
Published on 10 September 2020. Downloaded by Cornell University Library on 9/10/2020 3:42:06 PM.
View Article Online DOI: 10.1039/C9EN01405E
AgNPs, coincidingly with the literature, exhibited harmful effects on innate immune cells (e.g. earthworm coelomocytes) in low-concentration attributed to their small-size16, 34. Contrastingly similar responses were not observed after AuNP treatments (Fig. S1c and d). In this respect, their interactions with biological systems are rather contradictory35, 36; however several studies deal with the broad toxicity of AuNPs37, 38.
3.3. AgNPs induce immediate increase of intracellular ROS, delayed elevation of NO and mitochondrial membrane depolarization
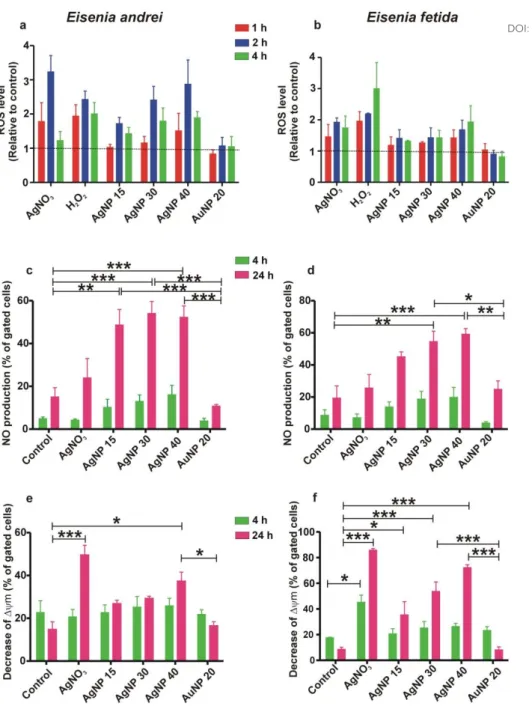
As we hypothesize that oxidative stress is a key process that initiates a cascade of subcellular events upstream of apoptotic determination following exposure to AgNPs, we first evaluated the intracellular level of ROS at early time points (i.e. 1, 2 and 4 h). A concentration-dependent increase in the relative ROS-level was observed for the AgNP treatments (Fig. 2a and b). With regard to the temporal aspect, E. andrei coelomocytes showed a peak in the ROS level at 2 h, while E. fetida coelomocytes revealed gradual elevation of ROS toward 4 h. Indeed, in general similar trends were observed also for the AgNO3 treatment and positive control (H2O2), suggesting an inherent difference in the kinetics of ROS physiology between the two species (Fig. 2a and b).
It has been generally recognized that AgNP exposure results in oxidative stress a process extremely dependent on NP size, shape, dose and duration24, 39, 40. A variety of oxidative stress-related abnormalities have been reported for earthworms as well as other invertebrates upon AgNP treatments16, 41-47, however induction of NO derivates has not been studied in invertebrate immune cells. In the coelomocytes of both Eisenia species, the intracellular NO level was slightly higher at 4 h and then strongly increased at 24 h, showing significant differences between the AgNP treatments and the unexposed control (Fig. 2c and
3 4 5 6 7 8 9 10 11 12 13 14 15 16 17 18 19 20 21 22 23 24 25 26 27 28 29 30 31 32 33 34 35 36 37 38 39 40 41 42 43 44 45 46 47 48 49 50 51 52 53 54 55 56 57 58 59
Environmental Science: Nano Accepted Manuscript
Published on 10 September 2020. Downloaded by Cornell University Library on 9/10/2020 3:42:06 PM.
View Article Online DOI: 10.1039/C9EN01405E
d). Interestingly, AgNO3 did not induce NO production as high as observed for the AgNP treatments, indicating NP-specificity of this response.
In the case of mitochondrial depolarization (Δψm) we did not find any remarkable changes at 4 h in any of the AgNP treatments (Fig. 2e and f). However, at 24 h a significant concentration dependent decrease of mitochondrial membrane potential was observed for E.
fetida coelomocytes and to a lesser extent for E. andrei species.
Taken together, although AgNP induced a similar degree of NO production in the two species, the relative ROS level was rapidly regulated in E. andrei coelomocytes resulting in a decreasing trend toward 4 h. On the other hand, the higher degree of mitochondrial stress in E.
fetida coelomocytes may reflect the lower survival of cells compared to E. andrei species (Table S2). The positive correlation of mitochondrial depolarization and cell death was also evident for the AgNO3 treatments, underscoring that the former process is linked to subsequent cell death48. We do not know whether the intracellular ROS level could have been much higher in E. fetida coelomocytes at 24 h than the earlier time points tested here, as the measurement of ROS levels becomes more complicated when the cells are under stress.
Interesting to note is that in the hemocytes of Mytilus galloprovincialis AgNPs did not cause elevated ROS levels but the mitochondrial membrane potential was significantly decreased48, as was the case for E. fetida coelomocytes in this study. It is nonetheless plausible that the cellular redox balance (indicated by the excess ROS level) was affected at initial stages of AgNP and AgNO3 exposure, as a consequence of which mitochondrial membrane depolarization persisted for long enough to trigger cell death in both treatments at 24 h. As AgNO3 did not significantly altered the intracellular NO level unlike AgNPs, this process deserves a further investigation that may provide insights into the NP-specific modes of cellular responses. In all cases, as predicted from the cytotoxicity assays, AuNPs did not induce any of the changes in coelomocytes of both species.
3 4 5 6 7 8 9 10 11 12 13 14 15 16 17 18 19 20 21 22 23 24 25 26 27 28 29 30 31 32 33 34 35 36 37 38 39 40 41 42 43 44 45 46 47 48 49 50 51 52 53 54 55 56 57 58 59
Environmental Science: Nano Accepted Manuscript
Published on 10 September 2020. Downloaded by Cornell University Library on 9/10/2020 3:42:06 PM.
View Article Online DOI: 10.1039/C9EN01405E
3.4. AgNPs induce caspase-3 activation and DNA damages
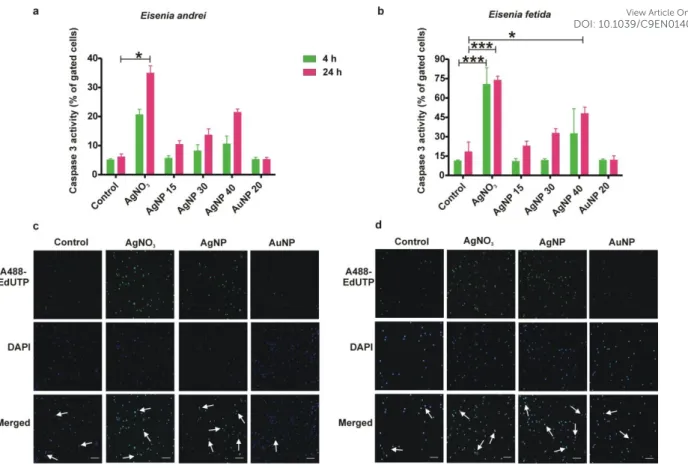
To further strengthen our hypothesis outlined above, we next focused on the parameters directly linked to apoptosis. As expected, a concentration-dependent caspase-3 activity was noted in the AgNP treatment in both species, in particular in E. fetida coelomocytes that showed a significant difference at the highest concentration at 24 h (Fig. 3a and b). AgNO3 induced higher caspase-3 activity already at 4 h and then at 24 h in both species. The AuNP treatments again did not show any notable changes. Of particular interest is the general weaker response of E. andrei coelomocytes compared to E. fetida. The molecular signature of apoptosis was further indicated by TUNEL assays revealing double strand DNA breaks in AgNP and AgNO3 treatments (Fig. 3c and d). TUNEL assay controls and the concentration series of AgNPs validated the assay specificity (Fig S3a and b). These observations are all in line with the cytotoxicity and the mitochondrial depolarization results.
By means of TUNEL assay a previous study49 has reported that AgNP treatments caused DNA damages in THP-1 monocytic cell line which could be linked to excess ROS production. Furthermore, in rat hippocampus AgNPs induced apoptosis in a dose-dependent manner observed by TUNEL staining50. Likewise Ribeiro et al., (2019)51 documented apoptosis of E. fetida coelomocytes upon copper oxide nanomaterial exposure in vitro.
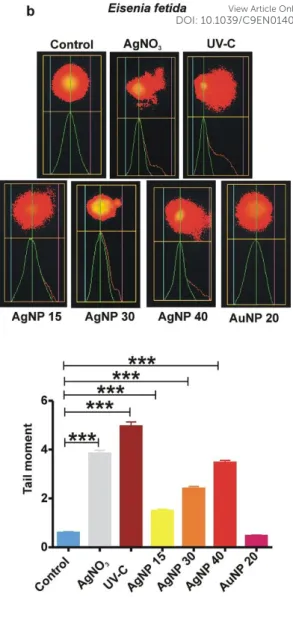
As another method of choice for sensitive detection of single/double-stranded DNA breakage, Comet-assay is a widely applied method including the genotoxicity evaluation of NPs in individual cells52. Following 24 h exposure, at which we were able to detect significant caspase-3 activation (Fig. 3), AgNPs triggered concentration-dependent genotoxic effects in coelomocytes of both species (Fig. 4). Furthermore, we noted higher TM-values in E. fetida coelomocytes compared to E. andrei after exposure to AgNPs or AgNO3 (Fig. 4a). In support of our findings, another study42 on AgNP genotoxicity revealed concentration-dependent appearance of micronuclei and bi-nucleated coelomocytes of Aporrectodea caliginosa
3 4 5 6 7 8 9 10 11 12 13 14 15 16 17 18 19 20 21 22 23 24 25 26 27 28 29 30 31 32 33 34 35 36 37 38 39 40 41 42 43 44 45 46 47 48 49 50 51 52 53 54 55 56 57 58 59
Environmental Science: Nano Accepted Manuscript
Published on 10 September 2020. Downloaded by Cornell University Library on 9/10/2020 3:42:06 PM.
View Article Online DOI: 10.1039/C9EN01405E
earthworms. As a side note, while we did not find any changes in the AuNP-exposed coelomocytes, by Comet assays Lopez-Chaves et al., (2018)37 observed DNA-damage caused by AuNPs in a size-dependent manner (10, 20, 30, and 60 nm) in HepG2 hepatoma cells.
3.5. Identification of species-independent features in gene responses to AgNPs
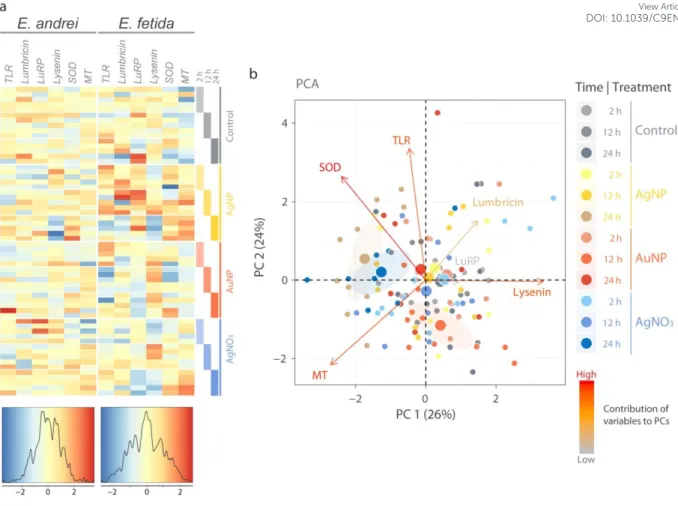
To further gain insights into the species differences in sensitivity towards noble metal NPs, we analyzed expression profiles of several target genes (stress-related: superoxide- dismutase-SOD, metallothionein-MT, pattern-recognition receptor (PRR): toll-like receptor- TLR, and antimicrobial peptide genes: lysenin, lumbricin, lumbricin-related peptide-LuRP) in a multiparametric manner: two different species, time kinetics (2, 12 and 24 h) and various treatments (AgNP, AuNP, and AgNO3). Low-cytotoxic concentrations (LC20 values) of AgNPs (E. andrei: 2.71 µg/mL and E. fetida: 2 µg/mL), and AgNO3 (0.20 µg/mL for both species) were selected for the experiments to standardize the concentration-response relationship between the two species. For AuNPs, the non-cytotoxic concentration (20 µg/mL) was used as above.
To explore the general patterns, we first visualized the datasets in a heatmap for each species based on z-scores and thus treating all genes equally independent of the inherent expression levels. Relative expression profiles of E. fetida have a broader z-score distribution and the resulting heatmap features more extreme values than the heatmap for E. andrei in which expression values around the mean (z-score of zero) are found more frequently (Fig.
5a). This suggests in general that E. fetida coelomocytes are more sensitive to the studied treatments. Using z-transformed datasets, PCA was performed to identify global patterns specific to species, treatments or time points, or the combinations of the latter two (treatment
time). In all cases, the first two PCs explained >50% of the total variations. Despite the global difference in the degree of transcriptional responses (Fig. 5a), the overall gene
3 4 5 6 7 8 9 10 11 12 13 14 15 16 17 18 19 20 21 22 23 24 25 26 27 28 29 30 31 32 33 34 35 36 37 38 39 40 41 42 43 44 45 46 47 48 49 50 51 52 53 54 55 56 57 58 59
Environmental Science: Nano Accepted Manuscript
Published on 10 September 2020. Downloaded by Cornell University Library on 9/10/2020 3:42:06 PM.
View Article Online DOI: 10.1039/C9EN01405E
expression patterns were not largely different between the two species (Fig. S3a). Expression patterns likely common to both species were observed with samples having negative PC1 scores; they are weakly represented by the AgNP and AgNO3 treatments (Fig. S3b, mean points labelled in yellow and blue, respectively) and by 24 h (Fig. S3c, mean point labelled in orange), but clearly indicated when the treatments and the time point were combined (i.e. 24 h exposure to AgNPs or AgNO3) (Fig. 5b, mean points labelled in brownish yellow and dark blue, respectively). The gene contributing largely to PC1 (strongly related to AgNP and AgNO3 treatments at 24 h) is lysenin due to relatively low expression levels, while SOD and MT have influences over PCs 1 and 2 mainly as a result of relatively high expression levels (Fig. 5b). Overall with respect to the effect of treatments and time points, PCA identified the 24 h time point for AgNP and AgNO3 treatments as characteristically different from the rest, and the difference stemmed from the expression patterns of lysenin and SOD common to both E. andrei and E. fetida possibly indicating a general stress response pattern in Eisena spp.
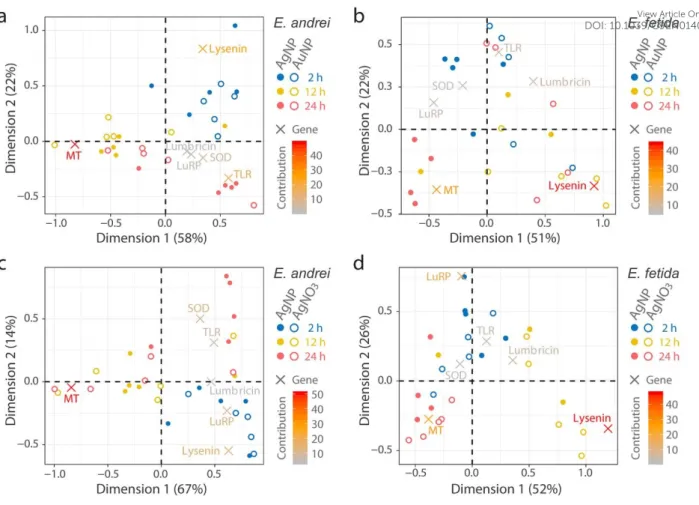
3.6. Exploration of time- and treatment-specific gene expression patterns
In contrast to PCA, CA is a more direct approach to visualize the multidimensional datasets in simpler plots without z-transformation. This makes the interpretation easier when the temporal aspects of two treatments are compared (Fig. 5). CA can thus identify common and uncommon characteristics among the two species focusing on the correspondence between time and gene response patterns. For a reference, results from the univariate statistics are presented in Fig. S4. In CA, we directly compared AgNP datasets to AuNP or AgNO3 to explore features specific to NPs or AgNO3, respectively. In general to both of E. andrei and E. fetida, the two genes lysenin and MT had the highest contributions in the opposite direction to the first axis (Dimension 1) that explains >50% of the variations of the data analyzed (Fig.
6). This reflects the tendency common to both species, as identified in PCA, that lysenin is
3 4 5 6 7 8 9 10 11 12 13 14 15 16 17 18 19 20 21 22 23 24 25 26 27 28 29 30 31 32 33 34 35 36 37 38 39 40 41 42 43 44 45 46 47 48 49 50 51 52 53 54 55 56 57 58 59
Environmental Science: Nano Accepted Manuscript
Published on 10 September 2020. Downloaded by Cornell University Library on 9/10/2020 3:42:06 PM.
View Article Online DOI: 10.1039/C9EN01405E