ORIGINAL RESEARCH published: 29 October 2019 doi: 10.3389/fendo.2019.00739
Frontiers in Endocrinology | www.frontiersin.org 1 October 2019 | Volume 10 | Article 739
Edited by:
Steven G. Gray, St. James’s Hospital, Ireland
Reviewed by:
Yasuhiro Nakamura, Tohoku Medical and Pharmaceutical University, Japan Damian G. Romero, University of Mississippi Medical Center, United States
*Correspondence:
Peter Igaz igaz.peter@med.semmelweis-univ.hu
Specialty section:
This article was submitted to Molecular and Structural Endocrinology, a section of the journal Frontiers in Endocrinology
Received:24 August 2019 Accepted:14 October 2019 Published:29 October 2019
Citation:
Decmann A, Nyírö G, Darvasi O, Turai P, Bancos I, Kaur RJ, Pezzani R, Iacobone M, Kraljevic I, Kastelan D, Parasiliti-Caprino M, Maccario M, Nirschl N, Heinrich D, Reincke M, Patócs A and Igaz P (2019) Circulating miRNA Expression Profiling in Primary Aldosteronism.
Front. Endocrinol. 10:739.
doi: 10.3389/fendo.2019.00739
Circulating miRNA Expression
Profiling in Primary Aldosteronism
Abel Decmann1, Gábor Nyírö2, Ottó Darvasi3, Péter Turai1, Irina Bancos4, Ravinder Jeet Kaur4, Raffaele Pezzani5, Maurizio Iacobone6, Ivana Kraljevic7, Darko Kastelan7, Mirko Parasiliti-Caprino8, Mauro Maccario8, Nina Nirschl9, Daniel Heinrich9, Martin Reincke9, Attila Patócs3and Peter Igaz1,2*
12nd Department of Internal Medicine, Faculty of Medicine, Semmelweis University, Budapest, Hungary,2MTA-SE Molecular Medicine Research Group, Hungarian Academy of Sciences and Semmelweis University, Budapest, Hungary,3Hereditary Endocrine Tumors Research Group, Hungarian Academy of Sciences and Semmelweis University, Budapest, Hungary,
4Division of Endocrinology, Diabetes, Metabolism and Nutrition, Department of Internal Medicine, Mayo Clinic, Rochester, MN, United States,5Endocrinology Unit, Department of Medicine, University of Padua, Padova, Italy,6Minimally Invasive Endocrine Surgery Unit, Department of Surgery, Oncology and Gastroenterology (DISCOG), University of Padova, Padova, Italy,7Department of Endocrinology, University Hospital Centre Zagreb, Zagreb, Croatia,8Division of Endocrinology, Diabetology and Metabolism, Department of Medical Sciences, University of Turin, Turin, Italy,9Medizinische Klinik und Poliklinik IV, Ludwig Maximilian University Munich, Munich, Germany
Objective: Primary aldosteronism is a major cause of secondary hypertension. Its two principal forms are bilateral adrenal hyperplasia (BAH) and aldosterone-producing adenoma (APA) whose differentiation is clinically pivotal. There is a major clinical need for a reliable and easily accessible diagnostic biomarker for case identification and subtyping.
Circulating microRNAs were shown to be useful as minimally invasive diagnostic markers.
Our aim was to determine and compare the circulating microRNA expression profiles of adenoma and hyperplasia plasma samples, and to evaluate their applicability as minimally invasive markers.
Methods: One hundred and twenty-three samples from primary aldosteronism patients were included. Next-generation sequencing was performed on 30 EDTA-anticoagulated plasma samples (discovery cohort). Significantly differently expressed miRNAs were validated by real-time reverse transcription-qPCR in an independent validation cohort (93 samples).
Results: We have found relative overexpression of miR-30e-5p, miR-30d-5p, miR-223-3p, and miR-7-5p in hyperplasia compared to adenoma by next-generation sequencing. Validation by qRT-PCR confirmed significant overexpression of hsa-miR-30e-5p, hsa-miR-30d-5p, and hsa-miR-7-5p in hyperplasia samples.
Regarding the microRNA expressional variations, adenoma is more heterogeneous at the miRNA level compared to hyperplasia.
Conclusion: Three microRNAs were significantly overexpressed in hyperplasia samples compared to adenoma samples, but their sensitivity and specificity values are not good enough for introduction to clinical practice.
Keywords: adrenal, primary aldosteronism, microRNA, biomarker, aldosterone-producing adenoma, bilateral adrenal hyperplasia
Decmann et al. Circulating miRNA in Primary Aldosteronism
INTRODUCTION
Primary aldosteronism (PA) is a major cause of secondary hypertension affecting 5–13% of hypertensive patients (1–3).
The two principal forms of PA are bilateral adrenal hyperplasia (BAH) and aldosterone-producing adenoma (APA) accounting for 60–70 and 30–40% of all PA cases, respectively (4).
Somatic mutations ofKCNJ5(Potassium Voltage-Gated Channel Subfamily J Member 5) (Gly151Arg or Leu168ARg) gene are present in 34–43% of APAs (5–9). Mutations inATP1A1(ATPase Na+/K+ transporting Subunit Alpha 1; in 5.3–17%), ATP2B3 (ATPase Plasma Membrane Ca++ Transporting 3; in 1.7–4%), CACNA1D(Calcium Voltage-Gated Channel Subunit Alpha 1D;
in 9.3–21%), andCTNNB1(Catenin Beta 1; in 2.1–5.1%) genes are responsible for a smaller portion of APAs (10–14). Nanba et al. found somatic mutations in aldosterone-driving genes in 88% of APAs by comprehensive NGS of CYP11B2 (aldosterone synthase)-expressing adrenal tumors (13). Moreover, tumors harboringCACNA1Dmutation were found to be smaller than tumors withKCNJ5mutations (14). In contrast, the pathogenesis of BAH is largely unknown that is mostly related to the lack of tissue samples for analysis since it is mostly left unoperated.
Due to the difference in treatment strategies (surgical resection for APA, mineralocorticoid antagonists for BAH), differentiation of APA and BAH is of pivotal clinical relevance.
Adrenal venous sampling (AVS) is considered to be the gold standard for the differentiation of the two clinical entities, but it is invasive, requires great expertise and unfortunately unavailable in many centers (15–17). The recent SPARTACUS trial has challenged the superiority of AVS over imaging, but its findings are debated (18). The need for a reliable and easily accessible diagnostic biomarker enabling their differentiation is critical to assure the best clinical management for patients with primary hyperaldosteronism.
MicroRNAs (miRNA, miR) in their mature forms are short (19–25 nucleotide long), single-stranded, non-coding RNA molecules involved in the gene expression mostly at the post- transcriptional level. MiRNAs are expressed in a tissue-specific manner (19), and are also secreted in various body fluids; as such, miRNAs hold promise as potential diagnostic biomarkers, as a component of liquid biopsy (20, 21). Our aim has been to perform profiling of circulating plasma miRNAs in AVS- confirmed samples of patients with primary hyperaldosteronism in order to determine biomarkers for differentiation of APA vs. BAH.
The aim of our study was to determine and compare the circulating microRNA expression profiles of APA and hyperplasia plasma samples, and to evaluate their applicability as minimally invasive markers in replacing AVS in the diagnostics of PA.
MATERIALS AND METHODS
Sample Collection and Ethics Approval
A total of 123 EDTA-anticoagulated plasma samples were used (Table 1). Altogether, 61 APA and 62 BAH samples were included in the study. Seventy-two male and Fifty-one female patients’
samples were included. The average age has been 54.17 for women and 49.39 for men. The sex of patients was not considered as a factor in the statistical analysis of the data. Diagnosis of PA was established according to current guidelines (22). APA and BAH were differentiated by AVS with or without ACTH stimulation (Table 2). Lateralization index (LI) was used to differentiate between the two entities [(left side cortisol/left side aldosterone)/(right side cortisol/right side aldosterone)]. If LI was between 0.33 and 3, the sample was considered as BAH, while if it was more than 4 or<0.25, the sample was considered to be APA. Samples from APA patients were collected preoperatively.
Genetic results of APA samples were available only for a minority of cases. Samples with lateralization index of 0.25–0.33 and 3–4 were considered to be in the zones of overlap, thus not included in the study (23). The study was approved by the Ethical Committee of the Hungarian Health Council. All experiments were performed according to relevant guidelines and protocols, and from all the involved patients written informed consent was obtained.
Sample Processing
Total RNA isolation was carried out from all plasma samples by miRNeasy Serum/Plasma Kit (Qiagen GmbH, Hilden, Germany).
For assessing recovery efficacy, 5 µL of 5 nM Syn-cel-miR-39 miScript miRNA Mimic (Qiagen GmbH) was added before the addition of acid-phenol/chloroform as a spike-in control. Total RNA was held frozen at−80◦C until further use.
miRNA Expression Profiling From Plasma Samples by Next-Generation Sequencing (NGS)
A total of 30 samples (16 APA and 14 BAH) were subjected to NGS. APA samples showing the highest (>4) or lowest (<0.25) LI and BAH samples with LI closest to 1 were selected for this cohort. Samples were involved from 3 centers (9, 13, 8 samples, respectively; 22 males and 8 females; average age BAH: 53.28 years, APA: 54.46 years). cDNA library was made from total RNA by the QIAseq miRNA Library Kit (Qiagen GmbH) according to the manufacturer’s guideline. The library was prepared for sequencing in accordance with the instructions of the MiSeq Reagent Kit v3 (Illumina, San Diego, CA, USA).
NGS was performed by Illumina MiSeq (Illumina). FASTQ files were used in the primary data analysis procedure, in which online analysis software of Qiagen was applied (https://
geneglobe.qiagen.com/sg/analyze/). To strengthen our findings, another statistical method was also applied. Primary analysis included trimming of adapters using cutadapt (Marcel Martin, Technical University, Dortmund, Germany); reads with<16 bp insert sequences or with<10 bp Unique Molecular Index were discarded. Alignment of reads was performed using bowtie (John Hopkins University, Baltimore, MD, USA), and miRBase V21 was used for miRNAs. Secondary analysis revealed significantly differently expressed miRNAs after DESeq2 normalization (24).
Disease groups were compared by unpaired Mann–Whitney test, and to decrease the false discover rate, corrected p-value was calculated by Benjamini–Hochberg method.
Frontiers in Endocrinology | www.frontiersin.org 2 October 2019 | Volume 10 | Article 739
Decmannetal.CirculatingmiRNAinPrimaryAldosteronism TABLE 1 |Patient data of the 123 samples included.
Sample Diagnosis Cohort Age at diagnosis
(range)
Tumor size (mm), laterality
Aldosterone AVS right nmol/L
Aldosterone AVS left nmol/L
Cortisol AVS right nmol/L
Cortisol AVS left nmol/L
Lateralization index Date of sampling
1 BAH NGS 40–45 15, right 22.27 43.63 62.39 127.6 1.04 2018
2 BAH NGS 60–65 Normal 16.68 12.69 177.55 121.33 0.9 2018
3 BAH NGS 30–35 12, left 24.52 9.47 67.61 22.8 0.87 2018
4 BAH NGS 56–60 10, right 14.9 9.35 75.55 52.13 1.1 2018
5 BAH NGS 36–40 Normal 15.31 12.17 175.13 99.11 0.71 2018
6 BAH NGS 36–40 Normal 55.12 54.66 126.37 115.2 0.92 2018
7 BAH NGS 40–45 Normal 26.42 20.8 339.67 157.47 0.59 2018
8 BAH NGS 56–60 Normal 23.37 14.92 160.04 84.86 0.83 2018
9 BAH NGS 65–70 Normal 7.82 7.13 99.8 83.96 0.92 2018
10 BAH NGS 46–50 10/19, right/left 103.76 42.45 326.61 225.48 1.69 2017
11 BAH NGS 60–65 9/7, right/left 44.39 47.16 176.54 144.64 0.77 2016
12 BAH NGS 70–75 5/15, right/left 835.06 882.23 387.88 249.76 0.61 2015
13 BAH NGS 66–70 5/5, right/left 174.78 66.58 256.29 92.08 0.94 2015
14 BAH NGS 50–55 16, left 9.61 6.39 221.49 167.48 1.14 2016
15 APA NGS 70–75 Normal 1.36 24.33 35.53 17.4 0.03 2018
16 APA NGS 86–90 15, right 31.34 1.32 6.89 6.53 22.58 2013
17 APA NGS 40–45 12, left 0.39 38.9 245.05 276.23 0.01 2013
18 APA NGS 56–60 12, left 57.24 5.28 85.19 193.94 24.68 2014
19 APA NGS 46–50 15, right 20.3 4.4 108.03 160.23 6.85 2014
20 APA NGS 40–45 10, left 1.25 225 6.89 12.33 0.01 2014
21 APA NGS 50–55 Normal 5.09 236 469.8 482.85 0.02 2016
22 APA NGS 56–60 8, right 1170.76 9.93 327.7 248.68 89.45 2017
23 APA NGS 30–35 14, right 108.2 2 97.15 27.55 15.36 2017
24 APA NGS 56–60 29, right 78.51 2.64 271.51 81.56 8.95 2015
25 APA NGS 46–50 5/5, right/left 33.29 169.23 416.88 160.23 0.08 2017
26 APA NGS 40–45 10, right 1942.01 6.94 369.75 179.08 135.61 2017
27 APA NGS 50–55 5/10, right/left 0.39 310.72 5.44 207.71 0.05 2016
28 APA NGS 46–50 7/9, right/left 61.03 4.72 315.01 122.16 5.02 2015
29 APA NGS 56–60 6/7, right/left 55.49 124.84 213.51 88.45 0.18 2016
30 APA NGS 60–65 12, left 30.52 63.81 219.31 96.43 0.21 2017
31 BAH Validation 40–45 Normal 41.07 13.69 539.04 214.6 1.19 2018
32 BAH Validation 30–35 Normal 48.49 21 390.78 181.98 1.08 2018
33 BAH Validation 40–45 Normal 37.79 13.6 192.13 101.86 1.47 2018
34 BAH Validation 70–75 26, left 65.99 17.58 553.9 193.21 1.31 2018
35 BAH Validation 60–65 23, left 5.05 38.09 22.48 170.01 1 2018
36 BAH Validation 46–50 Normal 33.69 39.79 328.79 161.31 0.42 2018
37 BAH Validation 35–40 Normal 50.19 41.29 234.9 312.84 1.62 2018
(Continued)
FrontiersinEndocrinology|www.frontiersin.org3October2019|Volume10|Article739
Decmannetal.CirculatingmiRNAinPrimaryAldosteronism TABLE 1 |Continued
Sample Diagnosis Cohort Age at diagnosis
(range)
Tumor size (mm), laterality
Aldosterone AVS right nmol/L
Aldosterone AVS left nmol/L
Cortisol AVS right nmol/L
Cortisol AVS left nmol/L
Lateralization index Date of sampling
38 BAH Validation 60–65 2, left 18.3 14.55 174 104.76 0.76 2018
39 BAH Validation 50–55 20, right 6.49 3.9 94.25 106.58 1.88 2014
40 BAH Validation 36–40 20, right 0.33 1.08 4.21 7.21 0.52 2015
41 BAH Validation 66–70 7, left 3.28 5.68 48.58 36.61 0.44 2018
42 BAH Validation 60–65 Normal 0.5 17.37 15.23 199.01 0.38 2014
43 BAH Validation 46–50 Normal 1.04 3.38 19.21 56.91 0.91 2014
44 BAH Validation 56–60 Normal 66.03 5.58 537.23 55.46 1.22 2014
45 BAH Validation 50–55 15, left 4.77 13.07 20.3 89.18 1.6 2015
46 BAH Validation 40–45 10, left 0.69 22.86 17.04 711.96 1.26 2015
47 BAH Validation 56–60 Normal 1.44 1.56 21.39 20.3 0.87 2015
48 BAH Validation 46–50 Normal 3.72 107.2 67.06 1255.71 0.65 2016
49 BAH Validation 50–55 Normal 17.01 30.93 176.9 344.74 1.07 2016
50 BAH Validation 56–60 Normal 2.63 3.97 6.89 11.24 1.08 2015
51 BAH Validation 40–45 Normal 9.73 7.74 10.88 17.04 1.97 2013
52 BAH Validation 40–45 Normal 2.8 4.26 40.24 95.34 1.56 2013
53 BAH Validation 36–40 Normal 6.18 1.04 233.09 27.91 0.71 2012
54 BAH Validation 56–60 7, right 4.43 12.13 117.09 208.8 0.65 2012
55 BAH Validation 50–55 Normal 4.82 15.58 199.01 362.5 0.56 2011
56 BAH Validation 30–35 Normal 6.46 1.14 83.05 19.68 1.35 2011
57 BAH Validation 40–45 Left 1.3 cm 1.62 36.62 40.6 347.28 0.38 2011
58 BAH Validation 60–65 Normal 15.05 9.95 47.96 61.66 1.94 2010
59 BAH Validation 40–45 10, left 5.27 53.82 11.64 242.19 2.04 2010
60 BAH Validation 45–50 Normal 3.68 2.44 206.01 244.47 1.79 2010
61 BAH Validation 36–40 Normal 12.06 1.95 10.95 4.82 2.73 2011
62 BAH Validation 56–60 10, right 10.61 10.85 1382.95 1027.7 0.73 2011
63 BAH Validation 50–55 Normal 2.5 5.52 52.24 69.78 0.6 2014
64 BAH Validation 70–75 Normal 2.66 2.27 7.54 10.19 1.58 2011
65 BAH Validation 50–55 22/11, right/left 5.31 16.92 6.45 7.29 0.35 2013
66 BAH Validation 50–55 Normal 13.57 8.54 44.95 33.02 1.17 2014
67 BAH Validation 66–70 5, left 92.8 89.2 696.37 234.54 0.35 2018
68 BAH Validation 60–65 7, left 35.6 18.22 416.88 199.74 0.94 2016
69 BAH Validation 36–40 14/20, right/left 83.5 13.2 508.95 181.61 2.26 2018
70 BAH Validation 66–70 15/10, right/left 4.4 1.7 411.08 235.63 1.48 2018
71 BAH Validation 66–70 Normal 43.35 21.2 411.44 180.89 0.9 2018
72 BAH Validation 66–70 7, right 54.5 43.2 317.19 85.19 0.34 2019
73 BAH Validation 66–70 Normal 99.87 58.26 511.13 291.81 0.98 2018
(Continued)
FrontiersinEndocrinology|www.frontiersin.org4October2019|Volume10|Article739
Decmannetal.CirculatingmiRNAinPrimaryAldosteronism TABLE 1 |Continued
Sample Diagnosis Cohort Age at diagnosis
(range)
Tumor size (mm), laterality
Aldosterone AVS right nmol/L
Aldosterone AVS left nmol/L
Cortisol AVS right nmol/L
Cortisol AVS left nmol/L
Lateralization index Date of sampling
74 BAH Validation 36–40 Normal 180.33 21.08 913.51 296.89 2.78 2018
75 BAH Validation 36–40 5, left 44.39 23.03 114.91 93.16 1.56 2018
76 BAH Validation 40–45 11, left 11.08 12.07 101.14 128.33 1.16 2019
77 BAH Validation 50–55 15, right 44.08 15.08 247.73 179.77 2.12 2019
78 APA Validation 60–65 13, left 125.98 2.12 355.98 437.54 73.05 2018
79 APA Validation 50–55 20, left 4.82 25.63 330.96 173.28 0.1 2018
80 APA Validation 20–25 7, left 25.2 47.39 808.02 272.24 0.18 2018
81 APA Validation 50–55 18, left 7.2 20.8 238.53 61.63 0.09 2018
82 APA Validation 46–50 23/23, right/left 0.84 47.83 39.51 197.2 0.09 2018
83 APA Validation 60–65 10, left 5.92 48.19 175.09 69.6 0.05 2018
84 APA Validation 56–60 10, left 16.9 14.8 379.54 84.46 0.25 2018
85 APA Validation 56–60 Normal 19.3 41.19 630.03 339.3 0.25 2018
86 APA Validation 30–35 15, right 18.34 261.18 116.98 70.72 0.04 2018
87 APA Validation 40–45 20, left 6.63 97.74 191.8 146.89 0.05 2018
88 APA Validation 56–60 15, right 393.95 17.37 184.51 177.99 21.88 2015
89 APA Validation 56–60 6/8, right/left 10.26 277.43 193.21 317.91 0.06 2015
90 APA Validation 40–45 10, right 163.68 3.99 164.94 122.89 30.53 2016
91 APA Validation 30–35 14, right 108.2 2 97.15 27.55 15.36 2017
92 APA Validation 46–50 10/15, right/left 1.69 88.78 127.96 124.34 0.02 2017
93 APA Validation 66–70 12, right 5.55 33.29 192.49 126.51 0.11 2017
94 APA Validation 56–60 13, left 8.6 244.14 140.65 95.34 0.02 2017
95 APA Validation 56–60 10/5, right/left 177.56 11.93 314.29 287.1 13.6 2017
96 APA Validation 50–55 Normal 0.63 6.61 56.91 14.61 0.02 2014
97 APA Validation 50–55 Normal 50.62 5.93 80.84 266.08 28.11 2014
98 APA Validation 56–60 16, right 64.6 1.67 174 268.25 59.63 2017
99 APA Validation 46–50 15, right 160 1.55 12.14 35.71 303.35 2017
100 APA Validation 36–40 13, left 5.33 62.01 219.68 175.09 0.07 2015
101 APA Validation 66–70 Normal 15.98 1.13 15.95 104.76 92.96 2014
102 APA Validation 30–35 13, right 14.32 1.32 28.64 86.28 32.8 2017
103 APA Validation 50–55 Normal 232.6 0.62 7.98 5.8 273.43 2016
104 APA Validation 60–65 Normal 25.52 1.31 17.76 63.8 70.16 2014
105 APA Validation 60–65 20, left 1.12 38.51 12.83 24.14 0.05 2010
106 APA Validation 56–60 hyperplasia 8.73 7.47 527.44 17.33 0.04 2010
107 APA Validation 56–60 20/15, right/left 41.76 8.28 572.75 8.59 0.08 2011
108 APA Validation 36–40 Hyperplasia 1.49 6.33 10.66 9.68 0.21 2013
109 APA Validation 50–55 40, left 1.35 49.07 78.3 119.63 0.04 2012
110 APA Validation 56–60 Normal 0.83 97.93 350.18 209.89 0.01 2014
(Continued)
FrontiersinEndocrinology|www.frontiersin.org5October2019|Volume10|Article739
Decmann et al. Circulating miRNA in Primary Aldosteronism
TABLE1|Continued SampleDiagnosisCohortAgeatdiagnosis (range)Tumorsize(mm), lateralityAldosteroneAVS rightnmol/LAldosteroneAVSleft nmol/LCortisolAVSright nmol/LCortisolAVSleft nmol/LLateralizationindexDateofsampling 111APAValidation46–5020,left1.1244.72185.31210.830.032015 112APAValidation40–45Normal9.737.7410.9516.971.952013 113APAValidation36–4016,right133.120.35180.1342.7491.082009 114APAValidation26–3016,left3.1620.91696.73441.170.12011 115APAValidation56–6012/5,right/left280.210.71254.11205.5421.162018 116APAValidation46–5014,left8.46372.42398.03379.90.022018 117APAValidation36–406/11,right/left9.9999.87225.48204.450.092018 118APAValidation60–655/12,right/left19.755.49265.35163.490.222018 119APAValidation50–5514/13,right/left61.03224.72179.884.10.132018 120APAValidation56–609/5,right/left1417.673.83226.5682.29134.492019 121APAValidation46–5018,left22.9741.7189.1433.420.212019 122APAValidation66–7021,right55.831.3470.7631.3918.522019 123APAValidation60–65normal116.4819.41195.21134.494.132019 APA,aldosterone-producingadenoma;AVS,adrenalveinsampling;BAH,bilateraladrenalhyperplasia.
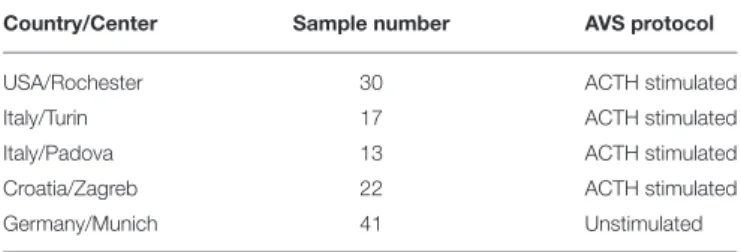
TABLE 2 |List of centers providing samples for the study and AVS strategy.
Country/Center Sample number AVS protocol
USA/Rochester 30 ACTH stimulated
Italy/Turin 17 ACTH stimulated
Italy/Padova 13 ACTH stimulated
Croatia/Zagreb 22 ACTH stimulated
Germany/Munich 41 Unstimulated
ACTH, adrenocorticotropic hormone; AVS, adrenal vein sampling.
Validation of Individual miRNAs
miRNAs significantly differentially expressed by NGS were validated by RT-qPCR on an independent validation cohort of 93 samples in one center (Semmelweis University, 2nd Department of Internal Medicine). Reverse transcription of RNA was performed using the TaqMan MicroRNA Reverse Transcription Kit (Thermo Fisher Scientific) and individual TaqMan miRNA assays (CN: 4427975, 4440886; Thermo Fisher Scientific). Selected miRNAs werehsa-miR-30e-5p(ID: 002223), hsa-miR-223-3p(ID: 002295),hsa-miR-30d-5p(ID: 000420), and hsa-miR-7-5p(ID: 005723_mat). As reference miRNA,cel-miR- 39 (ID: 000200) was used. Quantitative real-time PCR was performed by the TaqMan Fast Universal PCR Master Mix (2x) (CN: 4352042; Thermo Fisher Scientific) on a Quantstudio 7 Flex Real-Time PCR System (Thermo Fisher Scientific) in accordance with the manufacturer’s protocol for TaqMan miRNA assays with minor modifications (the end volume of the reaction was 15 µl, program of thermal cycler was the following: after 20 s on 95◦C, 40 cycles of 95◦C for 3 s and 60◦C for 30 s). Negative control reactions contained no cDNA templates. Samples were always run in triplicate. For data evaluation, the dCt method [delta Ct (cycle threshold) value equals target miRNA’s Ct minus internal control miRNA’s Ct] was used by Microsoft Excel 2016 (Microsoft, Redmond, WA, USA).
Statistical Analysis
Statistical power analysis was calculated with a statistical power and sample size calculator (HyLown Consulting LLC, Atlanta, GA, USA) (25). RT-qPCR data analysis was performed by GraphPad Prism 7.00 (GraphPad, La Jolla, CA, USA). Being a multicenter study, comparative statistics (Kruskal–Wallis test) were performed on samples from same disease groups, but from different centers in order to find possible skewed results. For differentiating between APA and BAH groups,t-test with Welch’s correction or Mann–Whitney test based on the result of the Shapiro–Wilk normality test. To exclude skewed results, –dCt values were standardized using standard score (z-value,z-score:
z = x−µ
σ , whereµandσ is the mean and standard deviation of values of the given center, respectively. TheF-test was used to evaluate differences between variances of circulating miRNA expressions of APA and BAH. Receiver operating characteristic (ROC) analysis was performed on miRNAs that could have potential utility as minimally invasive biomarkers.P<0.05 were considered significant.
Frontiers in Endocrinology | www.frontiersin.org 6 October 2019 | Volume 10 | Article 739
Decmann et al. Circulating miRNA in Primary Aldosteronism
RESULTS
miRNA Expression Profiling by NGS
We found 50 miRNAs to be significantly differentially expressed in samples of patients with APA vs. samples of patients with BAH by NGS and analyzed with the Qiagen online software.
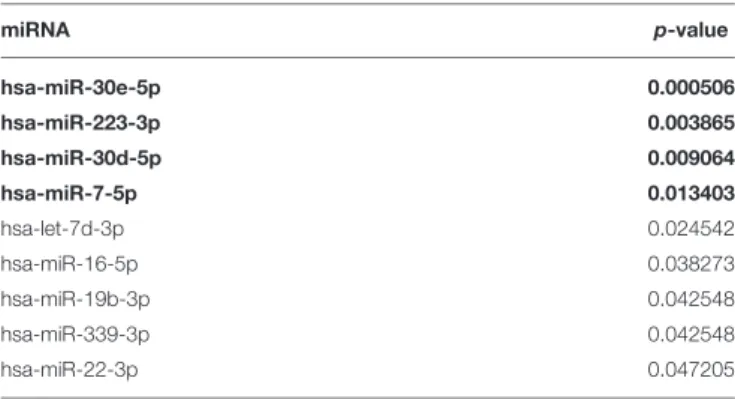
Multiple statistical analysis (including unpaired Mann–Whitney test) was performed on primary data that resulted in nine miRNAs showing the highest levels of significance (Table 3).
From these, four miRNAs with the highest significance i.e.,hsa- miR-30e-5p(p-value: 0.0005),hsa-miR-223-3p(p-value: 0.0039), hsa-miR-30d-5p (p-value: 0.0091), and hsa-miR-7-5p (p-value:
0.0134) were selected for validation on an independent cohort of samples. Statistical power analysis showed that by using this cohort of samples, the power of the sequencing was above 0.99.
NGS data are available under the Gene Expression Omnibus (GEO) accession number GSE126386.
Real-Time qPCR Validation of Selected miRNAs
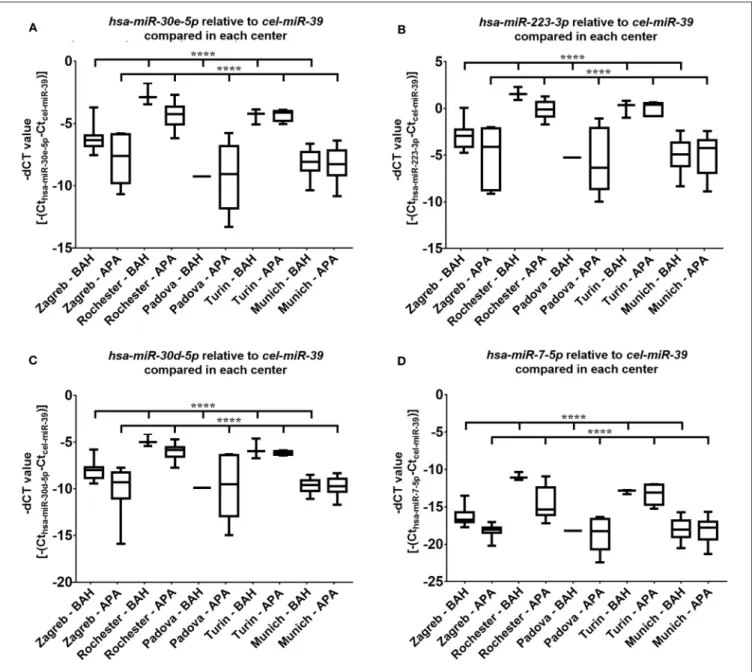
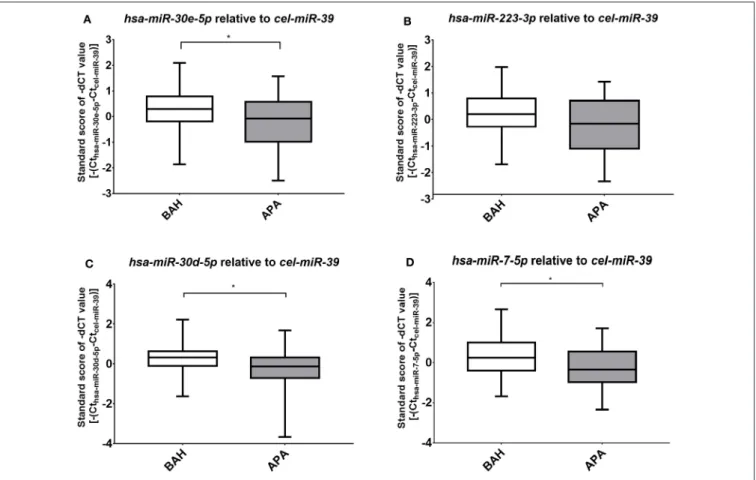
Four miRNAs, hsa-miR-7-5p, hsa-miR-30d-5p, hsa-mir-30e-5p, and hsa-miR-223-3p were subjected to validation by real-time RT-qPCR on 93 samples. Differences between miRNA expression within the investigated disease groups (APA and BAH) between different centers could be demonstrated (p < 0.0001), but the higher expression of miRNA in BAH relative to APA is evident for most cases (Figure 1). To exclude distorted results, standard scores of miRNA expression values of APA and BAH samples were compared (Figure 2). Validation of three out of four miRNAs established as significant by NGS were successful.
Hsa-miR-30e-5p (p= 0.04) (Figure 2A),hsa-miR-30d-5p (p= 0.02) (Figure 2C), and hsa-miR-7-5p (p= 0.016) (Figure 2D) were significantly upregulated in BAH in comparison with APA samples. An upregulation tendency of hsa-miR-223-3p in BAH samples relative to APA samples was noticeable, but not significant (p =0.15) (Figure 2B). As shown on Figure 1 regarding the relative differences between standard deviations, BAH samples appear to be homogenous at the level of miRNA expression, while miRNA expression in APA samples are more
TABLE 3 |List of 9 miRNAs with the most significant differences in expression between APA and BAH samples.
miRNA p-value
hsa-miR-30e-5p 0.000506
hsa-miR-223-3p 0.003865
hsa-miR-30d-5p 0.009064
hsa-miR-7-5p 0.013403
hsa-let-7d-3p 0.024542
hsa-miR-16-5p 0.038273
hsa-miR-19b-3p 0.042548
hsa-miR-339-3p 0.042548
hsa-miR-22-3p 0.047205
In bold, the four microRNAs with the highest level of significance that have been subjected to validation.
heterogeneous. To evaluate difference between variances of sample groups we appliedF-test.P-values forhsa-miR-7-5pwere:
Zagreb: 0.35; Rochester: 0.055; Padova: n.d.; Turin: 0.03; Munich:
0.24, ifp<0.05, null-hypothesis is rejected, therefore standard deviations are surely not equal. Relative miRNA expression did not correlate with any of the measured parameters (tumor diameter, lateralization index, aldosterone ratio between two sides at AVS, basal peripheral aldosterone) and no sex difference was observed.
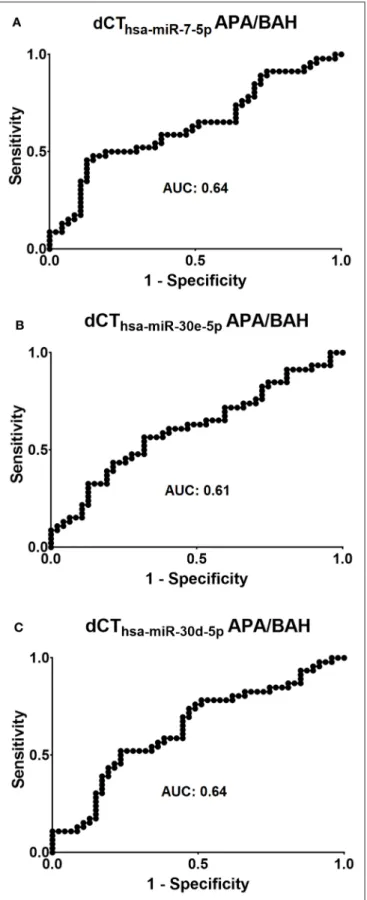
Diagnostic Performance of Circulating miRNAs
The diagnostic utility of the three significantly differentially expressed circulating microRNAs,hsa-miR-7-5p, hsa-miR-30e- 5p, and hsa-miR-30d-5p was evaluated by ROC analysis (Figure 3). Forhsa-miR-7-5p,the area under curve (AUC) was 0.64, and specificity and sensitivity values were 61.7 and 58.7%, respectively when choosing 0.13 as a cut-off point. ROC-analysis of hsa-miR-30e-5p showed an AUC of 0.61, and sensitivity of 58.7% and specificity of 61.7% when choosing 0.06 as a cut- off point.Hsa-miR-30d-5pperformed similarly tohsa-miR-7-5p on ROC-analysis, AUC: 0.64, sensitivity: 58.7% and specificity:
61.7% when choosing a cut-off point of 0.05.
DISCUSSION
Several genes have been described to be involved in the pathogenesis of APA, but the pathogenesis of BAH remains elusive. A recent study reported that aldosterone-producing cell clusters can be detected in BAH, and in theseCACNA1Dand KCNJ5mutations were found (26). BAH could be associated with bilateral microscopic hyperplasia, bilateral nodular hyperplasia, bilateral adenomas, or bilateral adrenal aldosterone-producing cell clusters (27). Based on recent data, the various forms of PA can be regarded as representatives of a spectrum of diseases of variable severity (28,29).
From a clinical perspective, differentiation of a unilateral APA from a bilateral hyperplasia is of pivotal importance, as their treatment is different (operation vs. medical therapy). AVS is the gold standard, but it is not widely available, it is invasive and requires great expertise. A minimally invasive marker for differentiating these two entities would be an invaluable help in the management of PA. We have therefore examined the expression of circulating miRNA in AVS-confirmed APA and BAH samples to evaluate the applicability of these novel epigenetic markers for their differentiation.
In our study, 50 miRNAs showed some degree of significantly different expression by NGS, and from the four miRNA selected for validation, three circulating miRNAs hsa-miR- 30e-5p, hsa-miR-30-5p, and hsa-miR-7-5p were confirmed to be significantly up-regulated in BAH in comparison with APA (the fourth studied miRNAhsa-miR-223-3p showed only a non-significant tendency of up-regulation in BAH). In a previous study of miRNA expression in PA, where the authors compared tissue miRNA expression profiles of APA, unilateral
Frontiers in Endocrinology | www.frontiersin.org 7 October 2019 | Volume 10 | Article 739
Decmann et al. Circulating miRNA in Primary Aldosteronism
FIGURE 1 |Results of RT-qPCR of the four miRNAs selected for validation from each sample contributing center. Mean±Standard deviation (SD) of -dCT values of selected miRNAs;(A)hsa-miR-30e-5p;(B)hsa-miR-223-3p;(C)hsa-miR-30d-5p;(D)hsa-miR-7-5p. Significant differences can be seen among the APA or BAH samples from different centers (ANOVA or Kruskal–Wallis test based on the result of Shapiro–Wilks normality test). ****p<0.0001.
adrenal hyperplasia (UAH) and normal adrenal cortex, hsa- miR-375 and hsa-miR-7 were significantly underexpressed in APA when compared to UAH and normal adrenal glands (30). Moreover, in a recent study, three of our selected circulating miRNAs hsa-miR-30e-5p, hsa-miR-30d-5p, andhsa- miR-223-3p were found to be down-regulated in essential hypertension patients compared to healthy people’s plasma samples (31). These observations could raise the possibility that these miRNAs might be related to the regulation of blood pressure.
The range of expression of all four validated miRNAs seems to be broader in APA samples than in BAH samples (F-test was
significantly different for data of two centers, and a tendency was seen in another). This finding might be related to the observations, that APA is genetically more heterogeneous than BAH (10,11).
It is unclear why the expression levels (represented by dCt values) in the APA and BAH groups from different centers contributing to our study are different. The tendency of up-regulation of miRNA in BAH relative to APA can be seen for most miRNAs, however, the expression levels were rather different between some centers (Figure 1). Pre- analytical differences such as sample taking/storage might be suspected.
Frontiers in Endocrinology | www.frontiersin.org 8 October 2019 | Volume 10 | Article 739
Decmann et al. Circulating miRNA in Primary Aldosteronism
FIGURE 2 |Results of RT-qPCR of the four miRNAs selected for validation. Mean±Standard deviation (SD) of standard scores of -dCT values of selected miRNAs;
(A)hsa-miR-30e-5p;(B)hsa-miR-223-3p;(C)hsa-miR-30d-5p;(D)hsa-miR-7-5p. Student’st-test with Welch correction or Mann–Whitney test was used based on the result of the Shapiro–Wilks normality test. *p<0.05.
Despite showing significant overexpression in BAH samples, the diagnostic accuracy of the three validated circulating miRNAs (hsa-miR-30e-5p, hsa-miR-30-5p, and hsa-miR-7-5p) does not make them suitable for introduction to clinical practice. In contrast, adrenal venous sampling has impressive sensitivity and specificity values–when lateralization index cut-off point is 4–
with 95.2 and 100%, respectively (23).
The pathogenic relevance of these miRNA in PA is unclear.
Circulating hsa-miR-7-5p is found to be underexpressed in idiopathic inflammatory myopathy and esophageal squamous cell cancer patients compared to healthy controls (32, 33).
Overexpressed hsa-miR-7-5p was found in acute pancreatitis, neuroendocrine tumors, and type 2 diabetes mellitus patients compared to healthy controls (34–36). There are reports stating that hsa-miR-7-5p functions as a tumor suppressor miRNA in pancreatic ductal adenocarcinoma (37) and in bladder cancer (38), and also inhibits melanoma cell proliferation (39).
Circulating hsa-miR-30e-5p is up-regulated in systemic lupus erythematosus patients (40) and down-regulated in patients with mitral chord rupture (41) compared to healthy controls.
Tissue hsa-miR-30d-5p is considered as a tumor suppressor miRNA in non-small cell lung cancer compared to healthy controls (42).
There are limitations of our study. Even if adrenal imaging was performed for all patients, due to the limited sensitivity of computed tomography and magnetic resonance imaging, bilateral adrenal microadenomas can be classified as bilateral hyperplasia. Actually, as the group of William E. Rainey has recently shown (26), BAH usually contains microadenomas, and thus the boundary between APA and BAH is not clear, and these PA forms can be regarded as representatives of the same spectrum of diseases. The clinical relevance, however, is still to be able to differentiate unilateral from bilateral forms.
It would also be interesting to assess the circulating miRNA expression profiles related to different genetic forms of APA, but this would exceed the scope of our present study where the comparison of unilateral with bilateral forms of APA has been the primary aim for evaluating the potential applicability of circulating miRNA as markers of lateralization. Heterogeneity among contributing centers is another limitation, as discussed above.
To summarize, we have found that three circulating microRNAs were significantly overexpressed in BAH compared to APA patients, but don’t have high enough sensitivity and specificity values to be introduced to clinical medicine. BAH seems to be more homogeneous in miRNA expression than APA.
Frontiers in Endocrinology | www.frontiersin.org 9 October 2019 | Volume 10 | Article 739
Decmann et al. Circulating miRNA in Primary Aldosteronism
FIGURE 3 |Evaluation of the diagnostic applicability of(A)hsa-miR-7-5p, (B)hsa-miR-30e-5p, and(C)hsa-miR-30d-5pby receiver operating characteristic (ROC) curves. AUC=area under curve.
These findings also seem to support the idea that APA and BAH represent entities forming part of a spectrum of diseases leading to primary aldosteronism.
DATA AVAILABILITY STATEMENT
The datasets generated for this study can be found under the Gene Expression Omnibus (GEO) accession number GSE126386.
The datasets generated during PCR validation are not publicly available, but are available from the corresponding author on reasonable request.
ETHICS STATEMENT
The studies involving human participants were reviewed and approved by Ethical Committee of the Hungarian Health Council. The patients/participants provided their written informed consent to participate in this study.
AUTHOR CONTRIBUTIONS
PI designed the research. AD, GN, and PT performed the research. IB, RK, RP, MI, IK, DK, MP-C, MM, NN, DH, and MR provided patient samples. OD and AP were involved in data analysis. AD and PI wrote the manuscript. All authors approved the final manuscript.
FUNDING
This work was funded by the Hungarian National Research, Development and Innovation Office (NKFIH) grant K115398 to PI. The presented research activities were also financed by the Higher Education Institutional Excellence Programme of the Ministry of Human Capacities in Hungary, within the framework of the molecular biology thematic programme of the Semmelweis University. MR was supported by the Else Kröner-Fresenius Stiftung (2013_A182 and 2015_A171 to MR), the European Research Council (ERC) under the European Union’s Horizon 2020 research and innovation programme (grant agreement No.
[694913]), and by the Deutsche Forschungsgemeinschaft (DFG) (within the CRC/Transregio 205/1 The Adrenal: Central Relay in Health and Disease). IB was supported by the James A.
Ruppe Career Development Award in Endocrinology, the Robert and Elizabeth Strickland Career Development Award within the Division of Endocrinology, Metabolism, Diabetes and Nutrition, and the Advancement in Medicine Catalyst award.
ACKNOWLEDGMENTS
This study was performed as a collaborative study in the framework of the European Network for the Study of Adrenal Tumors (ENS@T). This study has been presented at the Ph.D.
Scientific Days organized by the Semmelweis University on 25–26 April 2019 in Budapest, Hungary. The authors would like to thank Frigyes Sámuel Rácz MD for his advice on statistical issues.
Frontiers in Endocrinology | www.frontiersin.org 10 October 2019 | Volume 10 | Article 739