Full Terms & Conditions of access and use can be found at
https://www.tandfonline.com/action/journalInformation?journalCode=tjde20 ISSN: (Print) (Online) Journal homepage: https://www.tandfonline.com/loi/tjde20
Input database related uncertainty of Biome- BGCMuSo agro-environmental model outputs
Nándor Fodor, László Pásztor, Brigitta Szabó, Annamária Laborczi, Klára Pokovai, Dóra Hidy, Roland Hollós, Erzsébet Kristóf, Anna Kis, Laura Dobor, Anikó Kern, Thomas Grünwald & Zoltán Barcza
To cite this article: Nándor Fodor, László Pásztor, Brigitta Szabó, Annamária Laborczi, Klára Pokovai, Dóra Hidy, Roland Hollós, Erzsébet Kristóf, Anna Kis, Laura Dobor, Anikó Kern, Thomas Grünwald & Zoltán Barcza (2021): Input database related uncertainty of Biome- BGCMuSo agro-environmental model outputs, International Journal of Digital Earth, DOI:
10.1080/17538947.2021.1953161
To link to this article: https://doi.org/10.1080/17538947.2021.1953161
© 2021 The Author(s). Published by Informa UK Limited, trading as Taylor & Francis Group
View supplementary material
Published online: 22 Jul 2021. Submit your article to this journal
Article views: 239 View related articles
View Crossmark data
Input database related uncertainty of Biome-BGCMuSo agro- environmental model outputs
Nándor Fodora, László Pásztorb, Brigitta Szabó b, Annamária Laborczib, Klára Pokovaib, Dóra Hidyc,d, Roland Hollósc,d, Erzsébet Kristófc,d, Anna Kisc,d, Laura Dobore, Anikó Kernf, Thomas Grünwaldgand Zoltán Barczac,d,e
aCentre for Agricultural Research, Agricultural Institute, Martonvásár, Hungary;bCentre for Agricultural Research, Institute for Soil Sciences, Budapest, Hungary;cDepartment of Meteorology, Eötvös Loránd University, Budapest, Hungary;dFaculty of Science - Excellence Center, Eötvös Loránd University, Martonvásár, Hungary;eFaculty of Forestry and Wood Sciences, Czech University of Life Sciences Prague, Praha-Suchdol, Czech Republic;fDepartment of Geophysics and Space Science, Eötvös Loránd University, Budapest, Hungary;gInstitute of Hydrology and Meteorology, Technische Universität Dresden, Tharandt, Germany
ABSTRACT
Gridded model assessments require at least one climatic and one soil database for carrying out the simulations. There are several parallel soil and climate database development projects that provide sufficient, albeit considerably different, observation based input data for crop model based impact studies. The input database related uncertainty of the Biome-BGCMuSo agro-environmental model outputs was investigated using three and four different gridded climatic and soil databases, respectively covering an area of nearly 100.000 km2 with 1104 grid cells. Spatial, temporal, climate and soil database selection related variances were calculated and compared for four model outputs obtained from 30-year-long simulations. The choice of the input database introduced model output variability that was comparable to the variability the year-to-year change of the weather or the spatial heterogeneity of the soil causes. Input database selection could be a decisive factor in carbon sequestration related studies as the soil carbon stock change estimates may either suggest that the simulated ecosystem is a carbon sink or to the contrary a carbon source on the long run. Careful evaluation of the input database quality seems to be an inevitable and highly relevant step towards more realistic plant production and carbon balance simulations.
ARTICLE HISTORY Received 8 April 2021 Accepted 5 July 2021
KEYWORDS
Input data; gridded data; soil parameters; climatic parameters; uncertainty propagation
1. Introduction
Modelling is an essential tool in agricultural systems science (Jones et al.2017). Beside environ- mental index-based methods (Olesen et al. 2011), statistical models (Delerce et al. 2016) and Niche-based models (Estes et al.2013) process-based models are the most commonly used tools for climate impact studies as well as for environment protection related assessments. Process- based agro-environmental models, often simply called crop models (Smith, Prentice, and Sykes
© 2021 The Author(s). Published by Informa UK Limited, trading as Taylor & Francis Group
This is an Open Access article distributed under the terms of the Creative Commons Attribution-NonCommercial-NoDerivatives License (http://
creativecommons.org/licenses/by-nc-nd/4.0/), which permits non-commercial re-use, distribution, and reproduction in any medium, provided the original work is properly cited, and is not altered, transformed, or built upon in any way.
CONTACT Nándor Fodor fodor.nandor@atk.hu, fona1972@gmail.com Centre for Agricultural Research, Agricultural Institute, Martonvásár, ELKH 2462, Hungary
Supplemental data for this article can be accessed athttps://doi.org/10.1080/17538947.2021.1953161.
This article has been republished with minor changes. These changes do not impact the academic content of the article.
2001; Jones et al.2003; Keating et al.2003; Brisson et al.2003; Stöckle, Donatelli, and Nelson2003;
Kersebaum 2007; Nendel et al. 2011) are the mathematical (usually computer-based) represen- tations of the most important processes of the soil-plant system consisting of a set of ordinary or partial differential equations and empirical equations organized into procedures or modules where the outputs of one procedure can serve as input to other procedures and the model as a whole is able to describe the temporal pattern of the key system parameters. These models are designed to calculate crop yield and other important parameters of the soil-plant system as a func- tion of weather and soil conditions, plant-specific characteristics as well as a choice of agricultural management practices. Crop models have a central role in informing agro-industry and policy makers about the risks and potential of adaptation strategies to counter climate change, as well as directing plant scientists and breeders towards the required traits in improved varieties and crop- ping systems’management practices to mitigate global climate change impacts (Fodor et al.2017).
Currently, there are two large modelling initiatives: the Agricultural Model Intercomparison and Improvement Project–AgMIP (agmip.org) and the Modelling European Agriculture for Climate Change project –MACSUR (macsur.eu). These networking hubs coordinate and support crop model development, together with crop model based studies and impact assessments, providing information for producers, policymakers and the public in the area of integrated climate change risk assessment for global agriculture and food security. Model inter-comparison studies carried out by various AgMIP and MACSUR groups have identified large uncertainties and biases in model outputs (e.g. Asseng et al.2013, 2014; Bassu et al.2014). In these studies, all members of the model ensemble used the same input datasets thus the results clearly demonstrate the significant structural differences of the incorporated models.
Using good quality local (weather, soil and plant development and growth) data and careful cali- bration agro-environmental models are capable of reliably simulating the yield formation dynamics, thefinal yield and the changes of other system parameters (e.g. soil organic carbon content) at plot scale (Verburg and Bond2003; Sommer et al.2008; Jégo et al.2013; Li et al.2015). Though, accurate modelling of the impact of extreme weather events and/or agromanagement options is still a chal- lenge even for the state-of-the-art models (Barlow et al.2015; Hussain et al.2018). In order to use simulation models at larger scales, those should be coupled with weather and soil databases repre- sentatively covering the study area. There are two fundamentally different ways to do it: (1) carry out the simulations for certain points of the study area using locally available input data then spatially interpolate the simulation results; (2) spatially interpolate the model inputsfirst and create an input data grid then carry out simulations for each grid points using the corresponding inputs. Vast majority of the larger scale studies use the latter approach, often called gridded modelling (Webber et al.2018; Müller et al.2019; Shelia et al.2019; Franke et al.2020). Gridded model assessments require at least one climatic and one soil database of certain spatial resolution as a minimum pre- requisite for carrying out the simulations. Various uncertainties exist, not only in the design of the applied model(s) and model parameters, but also in various types of input data. Waha et al. (2015) investigated the model (small scale vs large scale) selection as well as the climate and soil input data resolution (both spatial and temporal) related uncertainty of crop model outputs. Hoffmann et al.
(2015) and Zhao et al. (2015) investigated the climate data aggregation effect, while Folberth et al.
(2016), Grosz et al. (2017), Coucheney et al. (2018) and Maharjan et al. (2019) investigated the soil data aggregation effect on specific model outputs. Recently, Ojeda et al. (2020,2021) assessed the combined data aggregation effect of climate and soil on APSIM model outputs. Tao et al. (2018) presented the contribution of crop model structure and parameters to model output uncertainty in climate change impact assessments. In many cases, there are several parallel soil and climate data- base development projects that provide sufficient, observation based input data for crop model based impact studies. Due to the different data processing approaches and methodologies as well as the differences in the underlying network of observation stations that provides base data for the gridded database, the available soil and weather data sources provide different data for the very same crop model inputs. Obviously, differences in the applied input databases could be a
significant source of uncertainty in crop model outputs (Ojeda et al.2020,2021). The question is the relative significance of this uncertainty compared to others such as the uncertainty related to the spatial heterogeneity of soil or the interannual variability of weather.
The main goal of this study is to demonstrate and assess the input database related uncertainty of the Biome-BGCMuSo agro-environmental model outputs when Net Primary Production (NPP), Evapotranspiration (ET), Total Ecosystem Respiration (TER) and Soil Organic Carbon Content Change Rate in the topsoil (SOCCR) are simulated using climatic and soil input data retrieved from different databases.
2. Material and methods
2.1. Biome-BGCMuSo v6.1 model
The Biome-BGCMuSo v6.1 model has been created by merging the 4M crop model (Fodor, Pásztor, and Németh 2014) with the Biome-BGCMuSo v4.1 biogeochemical model (Hidy et al. 2016).
Biome-BGCMuSo v6.1, also called Biome-BGCMAg v2.1, is a detailed biogeochemical model extended with many features from the 4M crop model, thus merges many capabilities from both model families. The hybrid model is capable of simulating all major land use types, any kind of land use changes, a large number of agro-management operations, as well as the full water, carbon and nitrogen cycle of the plant-soil system including its GHG (greenhouse gas) balance. Key pro- cesses are simulated according to the procedures listed inTable 1.
More details of the model features can be found in Fodor, Pásztor, and Németh (2014) and Hidy et al. (2016). Biome-BGCMuSo is coupled with high resolution (0.1°×0.1°) gridded climate and soil databases constituting the so called AgroMo modelling framework.
2.2. Study area
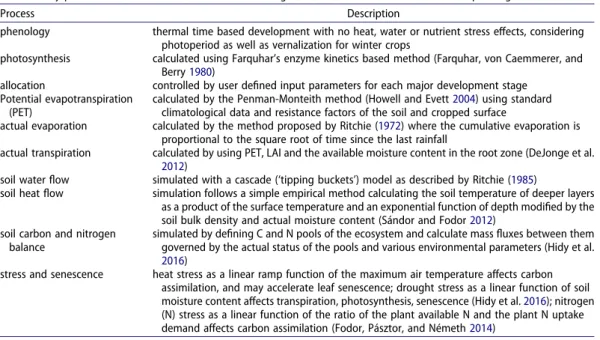
Three climatic and soil datasets were collected and post-processed to have the same spatial resol- ution of approx. 10×10 km. The data grids cover the area of Hungary with 1104 cells (Figure 1).
The majority of the agricultural land in the Carpathian basin is located in Hungary. Regarding
Table 1.Key processes simulated in the Biome-BGCMuSo agro-environmental model and the corresponding references.
Process Description
phenology thermal time based development with no heat, water or nutrient stress effects, considering photoperiod as well as vernalization for winter crops
photosynthesis calculated using Farquhar’s enzyme kinetics based method (Farquhar, von Caemmerer, and Berry1980)
allocation controlled by user defined input parameters for each major development stage Potential evapotranspiration
(PET)
calculated by the Penman-Monteith method (Howell and Evett2004) using standard climatological data and resistance factors of the soil and cropped surface
actual evaporation calculated by the method proposed by Ritchie (1972) where the cumulative evaporation is proportional to the square root of time since the last rainfall
actual transpiration calculated by using PET, LAI and the available moisture content in the root zone (DeJonge et al.
2012)
soil waterflow simulated with a cascade (‘tipping buckets’) model as described by Ritchie (1985)
soil heatflow simulation follows a simple empirical method calculating the soil temperature of deeper layers as a product of the surface temperature and an exponential function of depth modified by the soil bulk density and actual moisture content (Sándor and Fodor2012)
soil carbon and nitrogen balance
simulated by defining C and N pools of the ecosystem and calculate massfluxes between them governed by the actual status of the pools and various environmental parameters (Hidy et al.
2016)
stress and senescence heat stress as a linear ramp function of the maximum air temperature affects carbon assimilation, and may accelerate leaf senescence; drought stress as a linear function of soil moisture content affects transpiration, photosynthesis, senescence (Hidy et al.2016); nitrogen (N) stress as a linear function of the ratio of the plant available N and the plant N uptake demand affects carbon assimilation (Fodor, Pásztor, and Németh2014)
its plant production, Hungary ranks among the best in the world concerning the average yields of her main crops: maize, wheat, sunflower and rapeseed.
2.3. Climate data
The Biome-BGCMuSo model requires the daily global radiation, maximum and minimum temp- erature, daylight average vapour pressure deficit and precipitation as input data. For a historical time period, time series from three different databases were used in the study, namely, theCAR- PATCLIM, theFORESEEand theERA5.
CARPATCLIMis an observation-based dataset that contains several meteorological variables for the broader Carpathian Region covering the time period 1961–2010 (Spinoni et al. 2015) at 0.1°×0.1° resolution regular grid. During the construction ofCARPATCLIMthe same methodology was used by the national meteorological services that were involved in the international project for homogenization and interpolation of the observed station data (Szentimrey2007; Szentimrey and Bihari2006). For the study area,CARPATCLIMuses an observation network of 109 stations for precipitation, and 34 stations for temperature, and it can be considered as the best possible database for Hungary, though with limited temporal coverage.CARPATCLIMis one of the regional, obser- vation based gridded datasets that are available for specific parts of Europe (summarized in Fantini et al.2016).
FORESEE(Open Database FOR ClimatE Change-Related Impact Studies in CEntral Europe) is a free meteorological database for Central Europe covering the time period of 1951–2100 with 1/
6°×1/6° spatial resolution (Dobor et al.2014; Kern, Marjanović, and Barcza2016).FORESEEcon- tains observation-based daily maximum/minimum temperature and precipitation data and climate projections for the same variables as well, the latter starting from the last observed year that is con- tinuously updated. The dataset is supplemented by global radiation data estimated by the MTClim software (Thornton, Hasenauer, and White2000). The observation based data (1951–2018) was built using the E-OBS dataset (Kern, Marjanović, and Barcza2016; Cornes et al.2018). In the pre- sent study we used an interpolated version ofFORESEEat the same 0.1°×0.1° resolution regular grid
Figure 1.Location of the study area within Europe and its main regions (left): Feet of the Alps (I.),Little Hungarian Plain (II.), Transdanubian Mountains (III.), Transdanubian Hills (IV.), Great Hungarian Plain (V., VI, VIII., IX), North Hungarian Mountains (VII.). The Great Hungarian Plain can be divided into four well-distinguishable regions, two of which (VI., IX.) are dominantly cov- ered by coarse texture sandy soils while the other two regions (V., VIII.) are mostly covered withfine texture loamy and clayey soils. Top right: Average annual precipitation (1981-2010), retrieved from the website of the Hungarian Meteorological Service, Bottom right: Clay fraction of the topsoil (0-30 cm).
that is defined byCARPATCLIM.FORESEEuses a relatively low number of station data (17 stations for temperature and 16 stations for precipitation). The daily data stored on the original grid of FORESEE were resampled to thefiner grid of 0.1° × 0.1° using an interpolation technique (Kern et al.,2016) that takes elevation into account.
ERA5is a reanalysis database constructed and disseminated by ECMWF (Copernicus Climate Change Service 2017; Hersbach et al. 2019).ERA5 is thefifth generation of reanalysis products of ECMWF which contains major improvements both in terms of spatial (0.1°) and temporal (hourly) resolution. At present, ERA5 contains data from 1950 until the present in hourly time steps. Observations are used indirectly in ERA5 through the 4D-Var data assimilation method.
In this senseERA5 represents an alternative compared toCARPATCLIMandFORESEEthat are both interpolated, observation based datasets. This assimilation method uses instrumental measurements and short range model runs to produce gridded values of several meteorological par- ameters: rainfall, air temperature, incoming solar radiation and many others. ERA5 data were retrieved using the CDS API via R interface. The hourly data was post-processed to provide daily minimum/maximum temperatures and other ancillary variables needed in the study.
The databases show considerable differences both in details (presence or lack of spatial features) and in the spatial distribution of the parameters for the majority of the months. The CARPATCLIM database was developed by using substantially more station data for the interpolation, therefore, it gives a most detailed picture for the study area. FORESEE also shows the effect of topography (e.g.
mountains in the north-eastern part of the country), but it is more rough. In the case of ERA5, the fine details related to topography cannot be seen, but the spatial structure of temperature in all the three reference databases are similar: an increasing Northwest-Southeast gradient can be recognized though, with quite different mean values. Differences of the average solar radiation intensity, aver- age daily mean temperature and precipitation sum for the vegetation period (April-October) for 1981–2010 based on the investigated databases were presented on maps according to Ojeda et al.
(2021) (Figure 2). The CARPATCLIM database was used as a benchmark for the comparisons.
Apart from some grid cells in the hilly regions, the vast majority of the study area receives consider- ably less radiation according to the FORESEE and ERA5 databases. This is especially true for the ERA5 database. Regarding the average temperature for the majority of the study area, the differ- ences between the databases are within the−0.5–0.5 °C range. Larger deviations can be observed mainly in the hilly areas. There are no clearly‘cooler’or‘warmer’databases. Certain regions can be warmer according to one database than to another, while for another region this tendency turns around for the same pair of databases. The Western and Eastern part of the study area receives
Figure 2.Differences of the average daily solar radiation intensity, average daily mean temperature and precipitation sum for the vegetation period (April-October) for 1981–2010 based on the investigated databases. Top/bottom row: values obtained from the FORESEE/ERA5 database minus the values obtained from the CARPATCLIM database.
less and more precipitation, respectively according to the FORSEE database. Except from some grid cells in the North and in the South, the whole study area receives considerably more precipitation according to the ERA5 database. This difference could exceed 100 mm for the vegetation period in the North-Eastern part of the study area.
2.4. Soil database
Water content at saturation (SAT), field capacity (FC) and wilting point (WP) and saturated hydraulic conductivity (KS) are the key soil input parameters of the Biome-BGCMuSo model.
We analysed four sets of soil parameters: EU-SHG: retrieved from the continental, 250 m resolution EU-SoilHydroGrids dataset (Tóth et al.2017); US-PTF, EU-PTF and HU-PTF where the soil par- ameters were computed by using basic soil properties (bulk density, sand content, etc.) from the 100 m resolution DOSoReMI database (Pásztor et al. 2020) with the pedotransfer functions (PTFs) proposed by Ritchie, Gerakis, and Suleiman (1999), Tóth et al. (2015) and Szabó et al.
(2019), respectively. EU-SHG is the 3D soil hydraulic map of Europe which was derived from the 250 m SoilGrids (Hengl et al.2017) dataset with the European PTFs (Tóth et al.2015). US- PTFs, EU-PTFs and HU-PTFs differ in their training dataset as well as in the predictor variables.
The US-PTFs were obtained on a database of soil water limits and other basic soil properties of 401 soil samples from 15 states in the USA (Ratliff, Ritchie, and Cassel1983). This method uses bulk density, soil organic carbon, sand and clay content values to estimate SAT, FC and WP.
The EU-PTFs were trained on the European Hydropedological Data Inventory (Weynants et al.
2013). SAT was computed from particle size distribution, topsoil and subsoil distinction, organic carbon content and bulk density. For the estimation of FC and WP, particle size distribution and organic carbon content was used. The HU-PTFs includes several other environmental variables as well further to the basic soil properties. These PTFs were derived on the Hungarian Detailed Soil Hydrophysical Database (Makó et al.2010) extended with topographical, meteorological, geological and remotely sensed vegetation parameters therefore are specific for the Pannonian region. For all four datasets the saturated hydraulic conductivity was estimated according to Suleiman and Ritchie (2001) usingfield capacity and bulk density. The four soil databases shared themaximum soil depth datafield, so the very same (observation based, spatially interpolated) values were used for all of them. The maximum soil depth values were not homogenized across the grid cells, instead spatially explicit values were used in the simulations (Fig A1).
In order to maintain reasonable computation time during, all input data were provided for the Biome-BGCMuSo calculations at the resolution of the climatic data (approx. 10×10 km). Accord- ingly, thefiner resolution soil data had to be upscaled. Following the recommendations of Ojeda et al. (2020) a dominant soil type method is used for this purpose. For every 10×10 km grid cells one representative cell out of the 10.000 constituting 100×100 m subcells of the DOSoReMI grid has been selected. The location of this representative cell was used to pinpoint the representative from the coarser resolution EU-SoilHydroGrids, as well. The DOSoReMI database comprises sep- arate data arrays for the 0-30, 30-60, 60–100 and 100–200 cm deep layers. First, the average bulk density, soil organic matter, sand, silt and clay content of the 10.000 subcells were calculated for each soil layer. The representative subcell was selected by comparing the subcell properties to the average values and looking for a subcell for which the weighted distance from the average (wD) is minimal (see equation below).
wD= 4
k=1wk5 j=1
10000
i=1
Pi,j,k−Pj,k Pj,k 11
wherePi,j,kdenotes thejth parameter of theith subcell in thekth layer,Pj,kdenotes the average of thejth parameter in thekth layer for the 10.000 cells, andwkdenotes the weight factor for thekth
layer sum. In case of j = 1, 2, 3, 4 and 5Pis the bulk density, organic matter, sand, silt and clay con- tent, respectively. In case of k = 1, 2, 3 and 4 the value ofwkis 5, 3, 2 and one, respectively.
HU-PTF dataset provides the most detailed picture of the soil cover as it takes the highest num- ber of determinants into account, including topographical and geological information. One can clearly recognize the low quality sandy soils characterized by low Plant Extractable Water (PEW) value on the maps (except for the US-PTF dataset) located in the middle and the North-Eastern part of the study area (cf. Figure 1.). The pedotransfer function that calculates the PEW values of the US-PTF dataset uses the sand and the SOM content only and assumes that PEW equals around 13 V% for a wide range of soils. Only soils with very high sand or SOM content are sup- posed to have significantly lower or higher PEW value, respectively. Accordingly, apart from a few cells, PEW is around 13V% for the whole study area in the US-PTF dataset. Differences of the plant extractable water of the top 100 cm layer of the soils were calculated based on the inves- tigated databases using the EU-SHG database as a benchmark for the comparisons (Figure 3).
2.5. Model setup
Three major land cover types were simulated by using the Biome-BGCMuSo model covering the target area: crop-, grass- and forestlands (Figure 4). Considering that maize is grown on the largest portion of croplands (HCSO2021), and 86% of the forested area are deciduous forest (Bán et al.
2001) in Hungary, croplands and forests were represented by maize and deciduous broadleaf forest in the simulations, respectively. The key plant specific Biome-BGCMuSo model parameters, that were selected based on the result of a prior sensitivity analysis, were calibrated by using observed data. A Generalized Likelihood Uncertainty Estimation (GLUE) method (Beven and Binley 1992) based procedure was used to determine the optimum value of the input parameters minimiz- ing the absolute difference between the model outputs and the corresponding observed data.
During calibration the upper and lower bounds of the possible input parameters were set to litera- ture based values (Stöckle and Nelson2013; White et al.2000).
In case of maize, a two-step calibration method was used. First, parameter adjustment was per- formed based on eddy covariance GPP (Gross Primary Production) measurements carried out at the Klingenberg cropland site (50°53’35.0"N; 13°31’20.6"E) in Germany (Prescher, Grünwald, and Bernhofer2010). Based on the eddy covariance data of maize experiments from 2007 and 2018,fraction of leaf N in Rubisco,specific leaf areaandallocation parameterswere calibrated. In the second step, average annual yield data (1991-2018) from the long-term field experiments of the Centre for Agricultural Research (Martonvásár: 47°19’56.97"N, 18°47’50.61"E) in Hungary were used for calibration. The average yield was calculated from 16 yield data of four treatments (4 repetitions in each treatment) for each year. The selected treatments shared the following fea- tures: chernozem soil with deep (50+ cm) A horizon with at least 2.6% organic matter content
Figure 3.Differences of the plant extractable water (PEW) of the top 100 cm layer of the soil profile calculated based on the investigated databases: EU-PTF, HU-PTF and US-PTF. The EU-SHG database was used as a benchmark for the comparisons.
in the topsoil; at least 160 kg/ha/y nitrogen fertilizer level; FAO350 hybrid planted in the second decade of April with 7 seeds/m2density. Themaximum senescence rate of the above ground biomass, theeffect of water stress on photosynthesis, and theroot weight corresponding to the maximum root depthmodel parameters werefine-tuned to obtain the bestfit of the simulated maize yields on the observed data. The resulting plant parameter set for maize provided estimates that are consistent with both the long-term field experiment yield data and the daily resolution carbon flux data.
Maize simulations were then validated by using the NUTS-3 level (EuroStat 2021) yield data retrieved from the database of the Hungarian Statistical Office. This database provided a total of 570 yield data for the 19 NUTS-3 regions of Hungary for the 1981–2010 period.
In case of grasslands, Leaf Area Index (LAI) data of a humid grassland experiment site (Hegy- hátsál: 46°57’20.76"N, 16°39’7.39"E; Barcza et al.2003; Nagy et al.2010) was used for model cali- bration.Photosynthesis, soil water stressandallocationrelated parameters were adjusted to match the LAI dynamics of the humid, productive grassland site. LAI was measured with an ACCUPAR LP-80 ceptometer (METER Group2021) several times during the vegetation period in four years between 2009 and 2012. Another parameter set representing dry grasslands was constructed so that the additional simulation results were consistent with observations made at a Hungarian sandy, dry, low productivity grassland site (Fülöpháza: 46°52’16.48"N, 19°25’17.44"E; Ónodi et al.
2018), where the maximum of LAI was measured in each year with the same instrument in the 2003–2012 period. For this purpose, thefraction of leaf N in Rubiscoand thespecific leaf areapar- ameter was decreased, and thesoil water content stress related aboveground senescencecoefficient was increased. Grass simulations were then validated by using the NUTS-3 level biomass data of the Hungarian Central Statistical Office.
For the deciduous forest simulations the input parameter set proposed by White et al. (2000) was used and the results were consistent with our best knowledge about Hungarian forest carbon uptake (Marjanovićet al.2010) and storage.
During the model setup (calibration and validation) the CARPATCLIM climatic and the EU- SHG soil databases were used. With a minor change, we applied the method suggested by Ojeda et al. (2018) to assess model performance both in calibration and validation. The following statisti- cal indicators were used: concordance correlation coefficient (CCC) defined by Lin (1989), mean absolute error (MAE) defined e.g. in Willmott and Matsuura (2005) and mean signed error (MSE, also known as bias) which is also defined in Lin (1989) We decided to use MAE instead of root mean square error as the former has some advantages over the latter: MAE is a more natural and unambiguous measure of average error (Willmott and Matsuura2005).
2.6. Model simulations
After calibrating the plant parameters, the three major land cover types were simulated by using the Biome-BGCMuSo model with specific plant parameter sets for crop-, grass- and forestlands. The model was run with all climate×soil dataset combinations but only for those grid cells where the share of the land cover type in question exceeds 20% according to the CORINE-2012 (EEA
Figure 4.Grid cells where the ratio of crop, grass and forest area exceeds 20%.
2021) database (Figure 4), resulting in 948×12 = 11376, 229×12 = 2748, 571×12 = 6852 30 year-long simulations for the 1981–2010 period for crop-, grass- and forestlands, respectively. The period was limited due to the CARPATCLIM database as it provides data series till 2010 only.
Composite grassland simulation was performed using the so-called NÖSZTÉP land cover data- base (Tanács et al.2019). By using the NÖSZTÉP data it was possible to distinguish between pro- ductive and less productive grassland sites in Hungary. Two grassland simulations were performed for each selected grid cells and the results were calculated by linear combination of the partial results considering the share of productive/less productive grassland area within the pixel.
2.7. Assessment of uncertainty
30-year-long (1981-2010) simulations were carried out with the calibrated Biome-BGCMuSo model using the twelve climate×soil input dataset combinations. Annual Net Primary Production (NPP), Annual Total Evapotranspiration (ET), Annual Total Respiration (TER) and Organic Carbon Con- tent Change Rate (SOCCR) of the topsoil results were compared across the simulations with paired samples t-tests (withα= 0.5 significance level) using MS Excel Analysis ToolPak. Model results obtained with a specific climate-soil input database combo were selected in every possible way, resulting in 12
2 =66 different pairs and comparisons. The simulations in each pair differed either in the used soil or climate or both input databases. The variance of the simulation results were investigated infive different ways. Spatial [1], temporal [2], spatiotemporal [3], climate data- base related [4] and soil database related [5] variances were calculated. Additionally, the mean of the investigated model outputs (MEANall) across the grid cell, simulation years and the applied input databases were also computed.
VARispat =MEAN(VAR(Xpi)
j,l,q) (1a)
VAR4spat =MEAN(VAR(X4p,30−X4p,1)
j,l) (1b)
VARitemp=MEAN(VAR(Xqi)
j,l,p) (2)
VARispattemp=MEAN(VAR(Xip,q)
j,l) (3)
VARiclimateDB=MEAN(VAR(Xji)
l,p,q) (4a)
VAR4climateDB=MEAN(VAR(X4j,30−X4j,1)
l,p) (4b)
VARisoilDB=MEAN(VAR(Xli)j,p,q) (5a)
VAR4soilDB =MEAN(VAR(X4l,30−X4l,1)j,p) (5b)
MEANalli =MEAN(Xij,l,p,q) (6) i,j[[1, 3]
l[[1, 4]
p[[1,N], q[[1, 30]
whereXij,l,p,qdenotes theith model output obtained with thejth climate andlth soil database for the pth grid cell in theqth simulation year. In case of i = 1, 2, 3 and 4,Xstands for the NPP, ET, TER and SOC, respectively. In case of j = 1, 2 and 3 the CARPATCLIM, FORESEE and ERA5 dataset, while in
case of l = 1, 2, 3 and 4 the EU-SHG, EU-PTF, HU-PTF and US-PTF databases were used in the simu- lations. In case of crop, grass and forest simulations N = 948, 229 and 571, respectively (cf.Figure 4.).
Temporal and spatiotemporal variability could not be defined for SOCCR, since this variable intrinsically carries temporal aspects by definition. Uncertainties originating from different sources were characterized by the above defined variations. Spatial variance (VARspat) is a demonstrative measure of model uncertainty that is a result of the spatial heterogeneity of the soil characteristics across the grid. Temporal variance (VARtemp) is a measure of uncertainty caused by the interannual variability of climatic parameters. Climate and soil database related variances (VARclimateDB and VARsoilDB) characterize the uncertainty originating from an arbitrary choice of climate and/or soil input database. Climate database related variances were compared to the temporal as well as to the spatiotemporal variances, and soil database related variances were compared to the spatial as well as to the spatiotemporal variances to demonstrate their relative significance. In order to pre- sent the spatiotemporal aspects of the climate and soil database related relative uncertainties (RUNC), the distributions of the ratios of the climate and/or soil database related variances and the spatiotemporal variance [6] [7] [8] across the years and grid cells were also investigated.
VARclimateDB and VARsoilDB measures were correlated to environmental parameters to locate domains where the selection of the input database could be a crucial issue.
RUNCiclimateDB=VAR(Xji)
l,p,q
VARispattemp (6)
RUNCisoilDB=VAR(Xli)j,p,q VARispattemp
(7)
RUNCiinputDB=VAR(Xij,l)
p,q
VARispattemp
(8)
i,j[[1, 3]
l[[1, 4]
p[[1,N], q[[1, 30]
The distribution of the SOC change rate model results across the grid cells were analysed more thoroughly as the sign of this output is related to a highly important issue in the context of climate change: whether the soil is a carbon sink or a carbon source under the investigated land-use types.
3. Results and discussion
3.1. Model calibration and validation
Performance of the calibrated Biome-BGCMuSo model in simulating maize GPP and yield as well as grass LAI is demonstrated in the Appendix on Figure A2. and A3., respectively. After calibrating the selected plant specific parameters the model was capable of estimating the observed values with a comparable efficiency reported in similar studies (Liu et al.2012; Bao et al.2017; Soufizadeh et al.
2018; Sándor et al.2017), except for the dry grassland site. Note that ceptometer measurements are quite problematic, loaded with considerable error and tend to underestimate the actual leaf area when LAI is below one (Pokovai and Fodor2019). Nevertheless, the model was able to capture the low productivity of the dry grassland site. The Biome-BGCMuSo model overestimated the NUTS-3 level observed production data (Figure A4.) used for validation. This is a general issue of crop models as those are still incapable of precisely simulating the impact of various abiotic and biotic stress factors and usually assume ideal (perfectly executed) agro-management which is rarely the case in real farm plant production.
3.2. Assessment of uncertainty
According to the t-tests, in the majority of the 66 cases, exchanging either the climate or soil or both input databases resulted in significant changes in the outputs (Table 2).
Based on the simulation results, exchanging the soil input database causes considerably smaller uncertainty in all investigated model outputs and for all land use types than exchanging the climate input database (Table 3). The relative significance of the different input database related uncertain- ties relative to the spatiotemporal uncertainty (RUNCsoilDB, RUNCclimateDB, RUNCinputDB) are pre- sented inFigure 5. The expected value of the soil database related uncertainty of NPP (indicated by the 50th percentile of theRUNCsoilDBvalues) is 17.0, 7.8 and 11.6% in case of croplands, grasslands and forests, respectively. The climate database related uncertainty (RUNCclimateDB) of NPP was found to be 53.1, 11.3 and 36.9% in case of croplands, grasslands and forests, respectively. The approximate uncertainty measures of the other investigated outputs can be read out fromFigure 5, by reading the abscissas corresponding to the 50% probability ordinates. Additionally, the relative significance of uncertainties originating from various sources could be estimated by calculating the ratio of two selected entries fromTable 3, avoiding inappropriate pairs, of course: e.g. variables with different units.
Putting the input database related uncertainty into context for croplands (0.0555 kgC m−2) by assuming that the 85% of the NPP is stored in the above ground biomass that has an average of 45% carbon content and also assuming a harvest index of 0.5, croplandVARinputDBcorresponds to 524 kg ha−1yield uncertainty. It is 9.2% of the long term average maize yield in Hungary and 38%
of the mean absolute error of the Biome-BGCMuSo simulated yields when the model was validated against NUTS-3 (county) level observed data. It seems that it is practically indifferent what climate or soil database is used when simulating the Net Primary Production or Annual Total Respiration of grasslands; the expected value of bothRUNCclimateDBandRUNCsoilDBis around 10%. However, it is only an apparently low variability that is caused by the relatively high spatiotemporal variability of the grassland NPP and TER (Table 3) compared toVARspattemp of croplands and forests. The reason of the relatively high spatiotemporal variability most likely lies in the following two facts.
Firstly, that grassland cells are located in highly different regions. Eighteen % of the cells are located on sandy soils (sand > 80%), 28% of the cells are located on clayey soils (clay > 30%), and these cells are situated on the relatively dry middle and Eastern part of the country while the rest of the cells are in the mountainous (altitude > 500 m a.s.l.), relatively wet parts of the study area. Secondly, grasslands are diverse ecosystems that was accounted for a simply way in the study: a wet and a dry grassland simu- lation were performed for each grid cells and the outputs were calculated as linear combinations of the partial results considering the share of the productive and the less productive grassland areas within the pixel. The share of the dry grasslands across the grid cells shows polarized, double peak distri- bution: 37 and 31% of the cells have less than 25 and more than 75% share of dry grasslands, respect- ively. Wet grasslands produce relatively large biomass even in dry years while dry grasslands produce relatively small biomass even in wet years, resulting in a relatively high spatiotemporal variability of carbon balance related outputs (NPP and TER). For the rest of the outputs and land use types the expected value of the climate database related uncertainty may approach or even surpass 50% of the spatiotemporal uncertainty. The soil database related uncertainty exceeds 15% of the
Table 2.Number and percentage of significant changes caused by exchanging either the climate or the soil or both of the input databases regarding the investigated land use types and model outputs.
Output \ Land use Cropland Grassland Forest
NPP 65/66 = 98.5% 48/66 = 72.7% 65/66 = 98.5%
ET 58/66 = 87.9% 61/66 = 92.4% 59/66 = 89.4%
TER 60/66 = 90.9% 50/66 = 75.8% 60/66 = 90.9%
SOCCR 58/66 = 87.9% 23/66 = 34.8% 59/66 = 89.4%
Note: NPP: Net Primary Production, ET: Annual Evapotranspiration, TER: Annual Total Ecosystem Respiration and SOCCR: Soil Organic Carbon Content Change Rate of the topsoil.
Table3.Variancesofthemodeloutputsresultingfromdifferentsources(definedby[1]–[5]). LanduseCroplandGrasslandForest OutputNPPETTERSOCCRNPPETTERSOCCRNPPETTERSOCCR UnitkgCm−2mmkgCm−2kgCm−2y−1kgCm−2mmkgCm−2kgCm−2y−1kgCm−2mmkgCm−2kgCm−2y−1 MEANall0.6209544.60.65240.01780.5386458.20.87520.02670.8892598.21.37660.0059 VARtemp15.312.611.3NA41.812.835.9NA14.913.28.4NA VARspat11.99.511.744.448.420.341.8113.911.211.113.791.5 VARspattemp17.414.415.0NA52.720.345.0NA17.015.615.5NA VARclimateDB9.66.07.420.28.07.36.716.17.07.24.454.2 VARsoilDB3.32.23.47.35.82.54.915.02.32.11.725.4 VARinputDB8.95.77.319.19.67.07.920.66.66.74.254.2 Note:MEANalldenotetheaverageoftheoutputvariableacrossthegridcellsandsimulationyears.VariancesareexpressedaspercentagesoftheMEANallvalues.
spatiotemporal uncertainty only in case of cropland NPP. To the contrary, the climate database related uncertainty is less than 15% of the spatiotemporal uncertainty only in case of grassland NPP and TER. In every other cases it is at least 25% of the spatiotemporal uncertainty. In the vast majority of the cases (cells and years) the soil and climate database related uncertainty is less than 25 and 75% of the spatiotemporal uncertainty, respectively. However, the climate database related uncertainty might exceed the spatiotemporal uncertainty in some cells and/or years (Figure 5, Crop- land NPP (96th percentile = 102%) and Forest ET (98th percentile = 108%)).
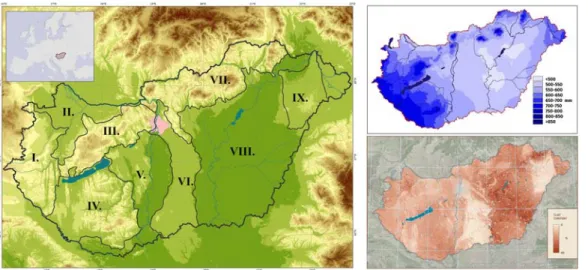
For the cropland NPP, a relatively strong linear relationship was found between the yearly com- ponent of the climate database related uncertainty and the average annual precipitation (AAPrec, mm): (VARclimateDB=0.0000942×AAPrec + 0.0039487; r= 0.548). An even stronger quadratic relationship was found between the grid cell specific component of the soil database related uncer- tainty and the clay fraction of the top soil (CLAY, %): (VARsoilDB= 0.0000245×(CLAY –18)2+ 0.0175;r= 0.645). The higher the annual precipitation amount the higher uncertainty the climate database selection may cause. In wet years, either or both the number of wet days and the precipi- tation amounts are higher providing more opportunities for differences between the input datasets, compared to dry years. The VARclimateDBseems to be more pronounced on sandy soils characterized by very low clay content and extreme water-balance regime (cf.Figures 1and6). The soil database related uncertainty has its highest values both for sandy and clayey soils, both having extreme water-balance characteristics: low water holding capacity for sandy soils and low permeability for clayey soils. Since it is always a challenge for databases to properly represent the extremes, no won- der that VARsoilDBexhibits the highest values for these soil types. Soil database related uncertainty is much more pronounced in dry years especially on clayey soils, but it still can be an issue in wet years on sandy soils (Figure 6.). If there is sufficient amount of precipitation (e.g. in 2010), it does not matter how different the soil characteristics (especially water holding capacity) are in the different
Figure 5.Importance of the soil database (orange, RUNCsoilDB), the climate database (blue, RUNCclimateDB) and the input data- base related uncertainty (black, RUNCinputDB) relative to the spatiotemporal uncertainty.
databases, there can be enough water in the soil for the plants not limiting their simulated growth.
In dry years (e.g. in 2007) several other soil parameter related factors become decisive for plant pro- duction: extreme low permeability (characteristic of clays) increases runoffand further decrease the available water content is the soil; the root zone is usually less deep in these years that make the potentially available water amount less that can be escalated by the fact that the most sporadic rain events can moisten only the topsoil.
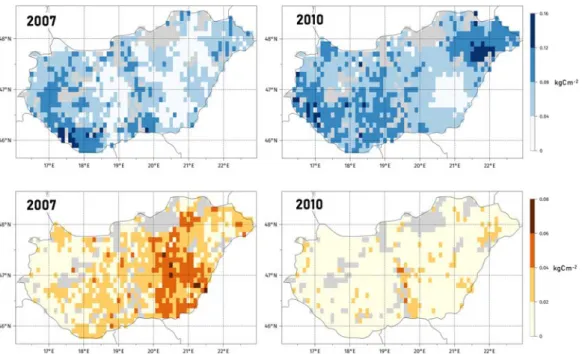
By looking at how the SOCCRchanges depend on the climate-soil input database combination across the grid cells (Figure 7.) it turns out that there are several grid cells: 17/948 (1.8% of crop- lands); 35/229 (15.3% of grasslands); 179/571 (31.3% of forests) where the SOC content change rate could be either negative (SOC decreases) or positive (SOC increases). The extent of this change, could reach 0.121 kgCm−2y−1 (changing from −0.053–0.068 kgCm−2y−1) on grasslands and 0.034 kgCm−2y−1(changing from−0.026–0.008 kgCm−2y−1) on forestlands depending on the cli- mate-soil input database combination used for the simulations. With only a couple exceptions on forestlands, the cells where the database selection change the sign of SOCCRare located in the hilly or mountainous regions (Figure 2., region I., III., IV., VII.). The ERA5 temperatures are clearly higher all year around (Figure 2shows the difference for May only) than theCARPATCLIMtemp- eratures that causes significantly more intense soil life, an accelerated respiration in the simulations when the CARPATCLIM database is used, in line with the findings of Davidson and Janssens (2006). When averaged across the different soil database selections, 415 and 526 cells are character- ized by decreasing soil organic carbon content when theERA5and theCARPATCLIM databases provide temperature data for the simulations, respectively. The soil input database change (with fixed climate input database) may also result in a sign change of SOCCR. In case of theCARPAT- CLIM,FORESEEandERA5databases, the number of cells with negative SOCCRvaries between 382 and 455, 454 and 487 as well as between 522 and 535, respectively. In every case, the use of the EU- SHG and the US-PTF database provided the lowest and the highest number of cells with decreasing soil organic carbon content, respectively. For these cells that are located in the wetter, hilly or
Figure 6.Spatial distribution of the yearly component of the climate (top) and soil (bottom) database related uncertainty of cropland NPP in a dry and in a wet year. 2007 was one of the most drought-affected years and 2010 was the wettest year of the investigated time period (1981-2010).
mountainous regions, the average Annual Total Ecosystem Respiration obtained with the US-PTF soil database is 0.018 kgCm−2y−1greater than the TER obtained with the EU-SHG database. This kind of difference can also be detected in the soil respiration component of TER that explains the more intense decrease of soil organic carbon when the US-PTF database is used. The rate of soil organic matter decomposition as well as the related CO2emission and SOC decrease are reciprocal functions of both the difference of the soil moisture contents atfield capacity and wilting point and the difference of thefield capacity and the hygroscopic soil moisture content. However,Figure 3 displays only the prior difference, which is practically the PEW value, it holds true for the latter difference as well, that both are clearly smaller in the US-PTF soil database.
4. Conclusions
Depending on the underlying data collection and data processing methodology, the available cli- mate and soil databases offer considerably different values even for key model inputs such as pre- cipitation amount and plant extractable water capacity. The input database choice introduces considerable uncertainty to the simulation results of the Biome-BGCMuSo model. Input database uncertainty is far from being negligible as it may introduce model output variability that is compar- able to the variability the year-to-year change of the weather or the spatial heterogeneity of the soil causes. Various environmental conditions, such as annual precipitation amount and soil clay con- tent strongly influence the extent of the input database related uncertainty, thus result in inhom- ogeneity in its spatial distribution. Input database selection could be a decisive factor in carbon sequestration related studies, especially when process- based models are used (e.g. Valkama et al.
2020), since depending on the choice, the soil carbon stock change estimates may either suggest that the simulated ecosystem is a carbon sink or to the contrary a carbon source on the long run. Climate database choice adds another source of uncertainty to climate projections as the related uncertainty propagates to an uncertainty in the projection through bias correction. Consid- ering its importance, the input database related uncertainty should be included in the ensemble modelling studies or in the super-ensemble probabilistic assessments (Tao et al.2018) in order to account for the uncertainties from various important sources. Careful evaluation of the quality of the climate and soil input databases seems to be an inevitable and highly relevant step towards more realistic plant production and carbon balance simulations.
Data availability statement
The data that support thefindings of this study are available on request from the corresponding author, [NF] The data are not publicly available due to [restrictions e.g. their containing information that could compromise the priv- acy of research participants].
Disclosure statement
No potential conflict of interest was reported by the author(s).
Figure 7.Distribution of the topsoil SOC content change rate across the grid cells depending on the climate-soil input database combination (3×4=12 combinations in total). From left to right: croplands, grasslands, forests.
Funding
This work was supported by Széchenyi 2020 programme, the European Regional Development Fund‘Investing in your future’, the Hungarian Government: [grant number GINOP-2.3.2-15-2016-00028]; Hungarian Scientific Research Fund: [grant number FK-128709,K-129118]; Advanced research supporting the forestry and wood-proces- sing sector´s adaptation to global change and the 4thindustrial revolution [grant number CZ.02.1.01/0.0/0.0/16_019/
0000803]financed by Operational Programme Research, Development and Education; János Bolyai Research Scho- larship of the Hungarian Academy of Sciences: [grant number BO/00088/18/4 and BO/00254/20/10].
ORCID
Brigitta Szabó http://orcid.org/0000-0003-1485-8908
References
Asseng, S., F. Ewert, P. Martre, R. P. Rötter, D. B. Lobell, D. Cammarano, B. A. Kimball, et al. 2014.“Rising Temperatures Reduce Global Wheat Production.”Nature Climate Change5: 143–147. doi:10.1038/nclimate2470.
Asseng, S., F. Ewert, C. Rosenzweig, J. W. Jones, J. L. Hatfield, A. C. Ruane, K. J. Boote, et al.2013.“Uncertainty in Simulating Wheat Yields Under Climate Change.”Nature Climate Change3: 827–832. doi:10.1038/nclimate1916.
Bán, I., A. Osváth, M. Tóth, L. Balogh, and P. Csóka.2001.“Forest resources of Hungary, 2001.”State Forest Service, Hungary, Budapest. ISSN 0238-1303. In Hungarian with English summary.
Bao, Y., G. Hoogenboom, R. McClendon, and G. Vellidis.2017.“A Comparison of the Performance of the CSM- CERES-Maize and EPIC Models Using Maize Variety Trial Data.”Agricultural Systems150: 109–119. doi:10.
1016/j.agsy.2016.10.006.
Barcza, Z., L. Haszpra, H. Kondo, N. Saigusa, S. Yamamoto, and J. Bartholy.2003.“Carbon Exchange of Grass in Hungary.”Tellus B: Chemical and Physical Meteorology55 (2): 187–196. DOI:10.3402/tellusb.v55i2.16695.
Barlow, K. M., B. P. Christy, G. J. O’Leary, P. A. Riffkin, and J. G. Nuttall.2015.“Simulating the Impact of Extreme Heat and Frost Events on Wheat Crop Production: A Review.”Field Crops Research171: 109–119. doi:10.1016/j.
fcr.2014.11.010.
Bassu, S., N. Brisson, J. L. Durand, K. Boote, J. Lizaso, J. W. Jones, C. Rosenzweig, et al.2014.“How do Various Maize Crop Models Vary in Their Responses to Climate Change Factors?.”Global Change Biology20 (7): 2301–2320.
doi:10.1111/gcb.12520.
Beven, K., and A. Binley.1992.“The Future of Distributed Models: Model Calibration and Uncertainty Prediction.” Hydrological Processes6 (3): 279–298. doi:10.1002/hyp.3360060305. ISSN 0885-6087.
Brisson, N., C. Gary, E. Justes, R. Roche, B. Mary, D. Ripoche, D. Zimmer, et al.2003.“An Overview of the Crop Model Stics.”European Journal of Agronomy18 (3–4): 309–332. doi:10.1016/S1161-0301(02)00110-7.
Copernicus Climate Change Service (C3S).2017. ERA5: Fifth generation of ECMWF atmospheric reanalyses of the global climate.”Copernicus Climate Change Service Climate Data Store (CDS). Accessed February 17, 2021.https://
cds.climate.copernicus.eu/cdsapp#!/home.
Cornes, R. C., G. van der Schrier, E. J. M. van den Besselaar, and P. D. Jones.2018.“An Ensemble Version of the E- OBS Temperature and Precipitation Data Sets.”Journal of Geophysical Research: Atmospheres123: 9391–9409.
doi:10.1029/2017JD028200.
Coucheney, E., H. Eckersten, H. Hoffmann, P. E. Jansson, T. Gaiser, F. Ewert, and E. Lewan.2018.“Key Functional Soil Types Explain Data Aggregation Effects on Simulated Yield, Soil Carbon, Drainage and Nitrogen Leaching at a Regional Scale.”Geoderma318: 167–181. doi:10.1016/j.geoderma.2017.11.025.
Davidson, E. A., and I. A. Janssens.2006.“Temperature Sensitivity of Soil Carbon Decomposition and Feedbacks to Climate Change.”Nature440: 165–173. doi:10.1038/nature04514.
DeJonge, K. C., J. C. Ascough, A. A. Andales, N. C. Hansen, L. A. Garcia, and M. Arabi. 2012. “Improving Evapotranspiration Simulations in the CERES-Maize Model Under Limited Irrigation.” Agricultural Water Management115: 92–103. doi:10.1016/j.agwat.2012.08.013.
Delerce, S., H. Dorado, A. Grillon, M. C. Rebolledo, S. D. Prager, V. H. Patiño, G. G. Varón, and D. Jiménez.2016.
“Assessing Weather-Yield Relationships in Rice at Local Scale Using Data Mining Approaches.”PLoS ONE11:
e0161620. doi:10.1371/journal.pone.0161620.
Dobor, L., Z. Barcza, T. Hlásny, Á Havasi, F. Horváth, P. Ittzés, and J. Bartholy.2014.“Bridging the gap Between Climate Models and Impact Studies: The FORESEE Database.”Geoscience Data Journal2: 1–11. doi:10.1002/
gdj3.22.
EEA.2021.“Co ORdinated INformation on the Environment (CORINE) Land Cover 2012, Version 18.4. European Commission - Directorate-General for Internal Market, Industry, Entrepreneurship and SMEs (DG-GROW, data owner).”European Environment Agency (EEA, data custodian). Accessed February 17, 2021. URL:http://land.
copernicus.eu/pan-european/corine-land-cover/clc-2012.