Understanding Student Preferences for Postpaid Mobile Services using Conjoint Analysis
Marija Kuzmanovic, Marko Radosavljevic, Mirko Vujosevic
University of Belgrade, Faculty of Organizational Sciences Jove Ilica 154, Belgrade, Serbia
marija.kuzmanovic@fon.bg.ac.rs, mari@fon.bg.ac.rs, mirkov@fon.bg.ac.rs
Abstract: In this paper, conjoint analysis is used to gain insights into how university students value various aspects of the postpaid mobile phone service. Preference-based segmentation is performed on the output from the conjoint analysis to isolate homogeneous consumer segments that possess similar preferences for mobile phone service. Based on the results the study suggests a marketing strategy for mobile phone operators.
Keywords: Conjoint analysis; students' preferences; mobile phone service; postpaid plan;
preference-based segmentation
1 Introduction
In recent years, the mobile communication market has developed rapidly. At the end of 2011, there were 6 billion mobile subscriptions, which is equivalent to 87 percent of the world population [1]. It has been estimated that by the end of 2013 there will be 6.9 billion mobile phone subscriptions worldwide [1]. Global mobile service revenue in 2009 was 840 billion US$, while the projected revenue for 2013 is 1038.6 billion US$ [2]. In Serbia, there were 10.2 million subscriptions in 2011 (corresponding to a 142.99% penetration rate), while the mobile service revenue for 2011 reached 846.7 million euros [3].
Despite its continued global expansion, mobile user growth is slowing. This decline is acute in developed markets, such as Serbia, and reflects saturating market conditions [1]. As mobile service providers seek to counter the slowing growth, the youth have emerged as an important segment. University students have been labeled as one of the most important target markets [4] as well as the largest consumer group for mobile phone services [5]. Recently, there have been several studies concerning the interaction of young people with mobile phone technology, e.g. their attitude [6], motivation [7], psychological effects [8, 9], the
impact on their social life [10], and their use of mobile phone services [5, 11].
However, there have been only a small number of attempts to explore student preferences towards certain features of a mobile phone service offering [12, 13].
The mobile phone markets show some changes from one country to the next [14].
There are three mobile phone operators in Serbia. All of them offer both prepaid and postpaid plans. University students are among the users that widely use postpaid services.
The objective of this paper is to determine the factors affecting the preferences of university students for postpaid service plans in Serbia, and to provide insights on how mobile phone operators can attract as many subscribers as possible. The results of our research are expected to inform mobile phone operators about student perceptions regarding various aspects of mobile phone services, and to help them design business models and perform successful marketing strategy based on the students‟ needs.
In order to measure student preferences, this paper used conjoint analysis.
Conjoint analysis is a multivariate technique that can be used to understand how an individual‟s preferences are developed. Specifically, the technique is used to gain insights into how consumers value various product attributes based on their evaluation of the complete product. Conjoint analysis has been widely used in marketing literature to evaluate consumer preferences for hypothetical products and services [15, 16, 17], as well as for pricing research [18]. The method has been applied to understanding the preferences in various markets including retail [19, 20], transportation [21], education [22], the labor market in the context of personnel selection decisions [23], telecommunications [24, 25] and health care services [26]. However, few studies have used conjoint analysis within the mobile industry [27, 28, 29].
This paper is organized as follows. The research design is covered in the following section. The type of data and how the data was collected, are also explained in that section. The main part of the paper is devoted to an explanation of the empirical results. Finally, the main conclusions are summarized.
2 Method
2.1 Conjoint Analysis
Conjoint analysis is an experimental approach used for measuring customer preferences regarding the attributes of a product or service. Originally developed in the field of mathematical psychology, conjoint analysis has attracted
considerable attention, especially in marketing research, as a method that portrays consumer decisions.
Conjoint analysis, sometimes called „trade-off analysis‟, reveals how people make complex judgments. The technique assumes that complex decisions involve not only one factor or criterion, but rather several factors „considered jointly‟. It is based on the simple premise that consumers evaluate the value of a product or service by combining the separate amounts of value provided by each attribute.
Accordingly, conjoint analysis enables the investigator to better understand the interrelationship of multiple factors as they contribute to the preferences.
Conjoint experiments involve individuals being asked to express their preferences for various experimentally designed, real or hypothetical alternatives. These hypothetical alternatives are descriptions of potential real-world alternatives, in terms of their most relevant features or attributes (both quantitative and qualitative); hence, they are multi-attribute alternatives. Lists of attributes describing single alternatives are called profiles or concepts. Typically, the set of relevant attributes is generated by expert opinions, reviewing the research literature and performing pilot research with techniques such as focus groups, factor listings, or repertory grids. Two or more fixed values, or “levels”, are defined for each attribute, and these are then combined to create different profiles.
Moreover, the number of product attributes selected must be reconciled with the characteristic of the given conjoint method: the traditional approach is ideal in the case of a maximum of six attributes, but if more than six attributes must be included, then the adaptive conjoint analysis is the appropriate method [30].
Though nowadays adaptive conjoint analysis and choice-based conjoint methods are very popular, sometimes it is more convenient to use the traditional approach.
Adaptive conjoint analysis must be computer-administered. The interview adapts to respondents‟ previous answers, which cannot be done via the "paper and pencil" method. On the other hand, the choice-based conjoint method can be administered by PC or via paper and pencil, but results have traditionally been analysed at the aggregate, or group, level. Aggregate-level analysis is useful for detecting and modeling subtle interactions that may not always be revealed with individual-level models. While these advantages seem to favor aggregate analysis from choice data, academics and practitioners have argued that consumers have unique preferences, and that aggregate-level models which assume homogeneity cannot be as accurate as individual-level models [31].
Thus, the traditional approach proved the better choice in this study, because it calculates a set of utilities for each individual. The experimental procedure involves profiles being presented to respondents who are asked to express their preferences by rating or ranking real or hypothetical profiles. Preference functions are estimated from this data, using ordinary least square regression for rating the data, as well as non–metric techniques when the rankings are obtained.
2.2 Postpaid Attributes and Their Levels
The first stage in the design of a conjoint analysis study is the selection of the attributes. The selection of key attributes in this study has been carried out through a preliminary survey. The survey was conducted using the traditional “paper and pencil” method. The respondents were asked to evaluate the significance of each of the 10 offered characteristics of post-paid mobile phone packages. The grading ranged from 1 to 10, where a score of 10 indicated the most important criterion, while the score of 1 indicated the least important criterion. The survey was completed by 28 respondents, members of the student population. The average score of each of the criteria as well as their ranking are presented in Table 1. A high value of standard deviation, especially in the case of the Mobile Phone Operator criterion, indicates heterogeneity of preferences of the student population.
A subset of 7 attributes that stood out by their average ranking was selected for the conjoint analysis. Although the Mobile Phone Operator criterion was ranked very low (last, ninth place) according to the results of pre-research, it has been added to the selected set of attributes in order to determine the student preferences towards the existing operators in Serbia, as well as their level of satisfaction with their currently selected operator. Two criteria have been omitted from further analysis:
the number of branches of the network operator, and the existence of tariff add- ons at extra cost.
Table 1
The results of the preliminary survey
Rang Criteria Avg. Rate St. Dev.
1 Possibility of transferring unused traffic to the next month 8.04 2.25 2 Conversation billing interval (1s; 60s+1s; 60s+60s) 7.21 2.67
3 Free internet within package 6.86 2.46
4 Account balance check (prompt or delayed update) 6.61 2.25 5 Promotions (discount) after expiration of the signed contract 5.43 2.67 6 Level of availability and quality of technical support 4.82 2.47 7 Possibility of choosing preferred phone number 4.57 2.78
8 Number of branch offices 4.04 2.28
9 Mobile phone operator 3.82 3.03
10 The existence of tariff add-ons at extra cost 3.61 1.93
Having chosen the attributes, levels must be assign to them. These should be realistic, plausible and capable of being traded. The attributes and levels chosen for this study are shown in Table 2.
Table 2 Attributes and their levels
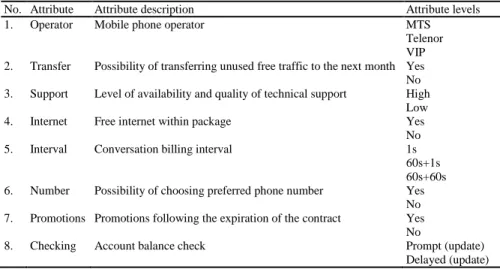
No. Attribute Attribute description Attribute levels
1. Operator Mobile phone operator MTS
Telenor VIP 2. Transfer Possibility of transferring unused free traffic to the next month Yes No 3. Support Level of availability and quality of technical support High
Low
4. Internet Free internet within package Yes
No
5. Interval Conversation billing interval 1s
60s+1s 60s+60s 6. Number Possibility of choosing preferred phone number Yes
No 7. Promotions Promotions following the expiration of the contract Yes
No
8. Checking Account balance check Prompt (update)
Delayed (update)
Three mobile operators are currently operating in Serbia: MTS, owned by the company “Telekom Serbia”, based in Belgrade, Serbia; Telenor, a member of the company “Telenor group” which is based in Oslo, Norway; and VIP, a part of the company “Telekom Austria”, with headquaters in Vienna, Austria. Accordingly, the attribute Operator belongs to the category of nominal attributes, and the existing three operators are the levels that are assigned to it. The next attribute, Transfer, refers to the possibility of transferring unused free minutes during one month (minutes of conversation, SMS, MMS, GPRS ...) to the free minutes intended for the next month. The practice of operators in Serbia is that if the option is available, the transfered traffic must be used within a certain period of time. This attribute is of the ordinal type, with levels where an option Exists (Yes) or Does not exist (No).
Support is an attribute that refers to the availability of technical support in terms of possibilities of establishing contact with call center operators. This attribute has been included in the analysis because practice has shown that it is frequently almost impossible to contact a call center, and the idea was to determine whether and to what extent this factor affects overall student preferences. The attribute is ordinal, with the levels of High and Low as the levels of availability and quality.
Internet is an attribute that describes whether the free traffic within the post-paid packages includes a certain extent of Internet access. Considering that students are the population that has the highest percentage of Internet and modern technologies users in Serbia, the assumption is that the existence of this option is an important criterion for choosing a particular mobile phone package among the student
population. The attribute is ordinal, with the levels Exists (Yes) and Does not exist (No).
Interval is an attribute that shows the manner in which time consumption is billed during conversations. The levels are: 1s - there is no rounding-off of the duration of a conversation, the exact number of seconds of a conversation shall be deducted from the remaining free minutes, or additionally charged if the free minutes have been used up; 60s +1s – as soon as a connection is established, the conversation is rounded off to 60 seconds, and after the first minute the billing is performed per second of conversation; 60s +60s - each initiated minute is billed as a minute spent. With certain postpaid packages, operators offer users the possibility to select a new phone number according to their wishes. Therefore, the analysis also includes the attribute Number, and it has been assigned the levels Exists (Yes) and Does not exist (No).
Promotions is an attribute that refers to the existence of promotions following the expiration of a time related contract between the user and operator (e.g., a cheaper phone if the user decides to renew a contract, a discount on a subscription for several months, etc.). The attribute is ordinal, and the levels are Exists (Yes) and Does not Exist (No). Checking is an attribute that refers to the promptness of updates of the remaining free traffic, or new billing after the use of a service by the user. In Serbia, it often happens that status updates are late by more than a week. The attribute is ordinal as the previous one, with the levels Prompt updates and Delayed updates.
2.3 Conjoint Experimental Design
Once attributes and attribute levels are selected, they must be combined to form different hypothetical services for survey respondents to assign preference ratings.
In this study, a full profile approach was used to design the product profiles. The attributes and levels in Table 2 gave rise to 576 possible profiles (32 x 26). Since it is difficult, from a customer‟s perspective, to evaluate a large number of service profiles, it is necessary to select fewer of them. Therefore in this study the fractional factorial experimental design was used. A component of the statistical package SPSS 16.0 (Orthoplan) was used to reduce the possible number of profiles to a manageable level, while still allowing the preferences to be inferred for all of the combinations of levels and attributes. The use of Orthoplan results in an orthogonal main effects design, thus ensuring the absence of multicollinearity between the attributes. Through the use of this design, the 576 possible profiles were reduced to 16. Two control profiles (holdout tasks) were added to the given design. These 2 profiles were not used by the conjoint procedure for estimating the utilities. Instead, the conjoint procedure calculates correlations between the observed and predicted rank orders for these profiles, as a check of the validity of the utilities. The 18 hypothetical service profiles considered are shown in Table 3.
Table 3
Hypothetical mobile service profiles
Profile Operator Transfer Support Internet Interval Number Promotions Checking
1 MTS Yes High Yes 60s+60s No Yes Prompt
2 VIP Yes Low No 1s Yes Yes Delayed
3 Telenor Yes Low No 60s+60s No Yes Delayed
4 Telenor No High Yes 1s No No Delayed
5 Telenor Yes Low Yes 60s+s1s Yes No Prompt
6 MTS Yes High Yes 1s Yes Yes Prompt
7 MTS No Low No 60s+60s Yes No Prompt
8 MTS No Low Yes 60s+1s No Yes Delayed
9 VIP Yes Low Yes 1s No No Prompt
10 h MTS No High Yes 1s Yes No Delayed
11 MTS Yes High No 60s+s1s Yes No Delayed
12 MTS Yes High No 1s No No Delayed
13 h MTS No High Yes 60s+1s No Yes Prompt
14 MTS No Low Yes 1s Yes Yes Delayed
15 VIP No High No 60s+1s No Yes Prompt
16 VIP No High Yes 60s+60s Yes No Delayed
17 MTS No Low No 1s No No Prompt
18 Telenor No High No 1s Yes Yes Prompt
h holdout profiles
2.4 Survey
The survey was conducted in Belgrade, Serbia, in February 2011. Data collection was conducted online through a web-based questionnaire. This method of data collection was chosen for several reasons:
Online surveys are less expensive than the traditional “paper and pencil”.
In this study specifically, free web hosting and a free domain were used.
An online survey can be filled out simultaneously by a greater number of people. The number is practically unlimited.
The collected data is very easily exported into SPSS or Excel format
The questionnaire is available to a greater number of people.
The questionnaire included: (1) Instructions for completion, (2) Demographic questions, and (3) Conjoint questions from an effective experiment plan with two control (holdout) tasks.
The instructions for completion explain to the respondents how the questioning is performed. The method of evaluation of whole profiles has been chosen as the method of evaluation by the respondents. The respondents expressed their preferences for a particular service, or the real or hypothetical combination of attributes of the mobile telephony, on a scale of 1 to 9, where 1 stands for absolutely undesirable, and 9 stands for absolutely desirable. The questionnaire
also included some basic demographic questions, but also questions related to the current habits of the students in relation to the services of the mobile operators.
The aim was to determine whether there is a difference in preferences among students of different demographic characteristics.
Given the subject matter and objective of the research, the respondents were exclusively members of the student population and were selected randomly.
Students were invited via email to complete a questionnaire which, as noted, was available online. A list of students' email addresses was drawn both from the some student forums and the official faculty mailing lists. We sent an invitation to a total of 700 addresses, and 146 students answered the survey (approximately a 21% response rate). After the elimination of incomplete surveys and ineligible participants, 134 eligible surveys were collected. The demographic information is summarized in Table 4.
Table 4
Demographics of respondents
Variable Description Count (n=134) Percent (%)
Gender Male 74 55.2%
Female 60 44.8%
Monthly income
/ 88 65.7%
Occasional income 30 22.4%
Regular income 16 11.9%
Residence
With parents 67 50.0%
In rented apartment 47 35.1%
On the Campus 20 14.9%
Current mobile phone operator
MTS 73 54.5%
Telenor 44 32.8%
VIP 17 12.7%
Current tariff plan Prepaid 60 44.8%
Postpaid 74 55.2%
Average monthly traffic consumption
0-500 RSD 27 20.1%
501-1000 RSD 57 42.5%
1001-1500 RSD 28 20.9%
1501-2000 RSD 14 10.4%
More than 2000 RSD 8 6.0%
2.5 Conjoint Model Specification
Having collected the information on individual preferences, the responses needed to be analysed. To determine the relative importance of different attributes to respondents, the trade-offs that individuals make between these attributes, as well as the overall benefit taking into account these trade-offs, a relationship must be specified between the attributes‟ utility and the rated responses. The simplest and most commonly used model is the linear additive model. This model assumes that the overall utility derived from any combination of attributes of a given good or service is obtained as the sum of the separate part-worths of the attributes. Thus, respondent i‟s predicted conjoint utility for profile j can be specified as follows:
1 1
, 1,..., , 1,...,
Lk K
ij ikl jkl ij
k l
U x i I j J
(1)where K is the number of attributes, Lkis the number of levels of attribute k, and
ikl is respondent i‟s utility with respect to level l of the attribute k. xjkl is such a {0,1} variable that equals 1 if profile j has attribute k at level l, otherwise it equals 0. ij is a stochastic error term.
The parameters ikl, also known as part-worth utilities, can be used to establish a number of things. Firstly, the value of these parameters indicates the amount of any effect that an attribute has on overall utility – the larger the coefficient, the greater the impact. Secondly, part-worths can be used for preference-based segmentation. Namely, given that part-worth utilities are calculated at the individual level, if preference heterogeneity is present, the researcher can find it.
Respondents who place a similar value on the various attribute levels will be grouped together into a segment. Thirdly, part-worths can be used to calculate the relative importance of each attribute, which is known as an importance score or value (FIik). These values are calculated by taking the utility range for each attribute separately, and then dividing it by the sum of the utility ranges for all of the factors. Calculations are done separately for each respondent:
1 2 1 2
1 2 1 2
1
max{ , ,... } min{ , ,... }
, 1,..., , 1,...,
max{ , ,... } min{ , ,... }
k k
k k
ik ik ikL ik ik ikL
ik K
ik ik ikL ik ik ikL
k
FI i I k K
(2)and the results are then averaged to include all of the respondents:
1
1 , 1,...,
I
k ik
i
FI FI k K
I
(3)To estimate the parameters of the model, this paper used the statistical package SPSS 16.0 (Conjoint procedure). The parameters were estimated for each respondent in the sample individually, as well as for the entire sample.
3 Analysis and Results
3.1 Results at the Aggregate Level (Averaged Preferences)
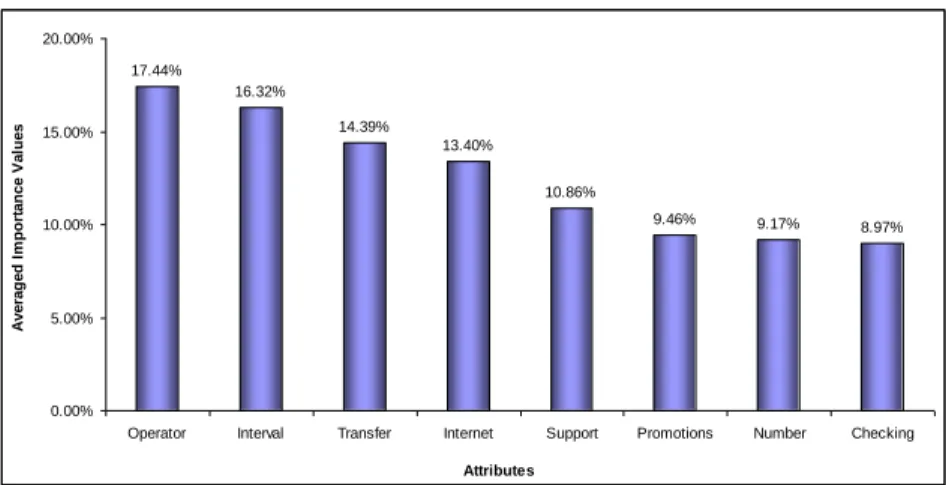
Results from the analysis are shown in Table 5 and Figure 1. Table 5 presents the (averaged) part-worth of each level of the attributes, while Figure 1 is the graph
description of the attributes importance. The goodness of fit statistics for the estimated models is reported also in Table 5.
Table 5
Averaged part-worth utilities
Attribute levels Part-worth utilities ( )
Mobile phone operator
MTS 0.188
Telenor 0.062
VIP -0.250
Possibility of transferring unused free traffic to the next month
Yes 0.531
No -0.531
Level of availability and quality of technical support
High 0.401
Low -0.401
Free internet within package
Yes 0.508
No -0.508
Conversation billing interval
1s 0.159
60s+1s 0.047
60s+60s -0.206
Possibility of choosing preferred phone number
Yes 0.302
No -0.302
Promotions following the expiration of the contract
Yes 0.321
No -0.321
Account balance check
Prompt 0.343
Delayed -0.343
Constant 4.622
Correlation between the observed and estimated preferences
Value Significance
Person‟s R 0.984 0.000
Kendall‟s tau 0.908 0.000
Kendall's tau for Holdouts 1.000
A high value of the Pearson coefficient, 0.984, confirms the high level of significance of the obtained results. Similarly, a high value of the Kendall correlation coefficient, 0.908, indicates a high level of correlation between the observed and estimated preferences. The Kendall coefficient for two holdout profiles has a value of 1.000, which is an additional indicator of the high quality of the obtained data.
As we can see in Table 5, when it comes to the only nominal attribute, the Operator, the highest average utility is held by the level MTS (0.188), followed by Telenor (0.062). The operator VIP was identified by the respondents as
undesirable, giving it a negative utility value of (-0.250). All of the other attributes are of the ordinal type, and the respondents displayed the expected behavior towards them, i.e. the levels that were presumed to have greater utility did indeed have it. For example, when it comes to the attribute Interval, the level “1s”, as expected, showed a greater utility (0.159) when compared to the intermediate level “60s+1s” (0.047) and the least desirable level “60s+60s” (-0.206).
The constant whose value is 4.622 represents a stochastic error obtained through regression analysis, and it is used to calculate the total utility of each profile.
17.44%
16.32%
14.39%
13.40%
10.86%
9.46% 9.17% 8.97%
0.00%
5.00%
10.00%
15.00%
20.00%
Operator Interval Transfer Internet Support Promotions Number Checking Attributes
Averaged Importance Values
Figure 1 Averaged importance values
It can be seen in Figure 1 that the most important attribute to users is the attribute Operator, and its average importance value at the aggregate level is 17.44%. This result is particularly interesting due to the fact that during pre-research, during direct method surveying, that same attribute was positioned in the penultimate place. Still, the question remains whether such a high importance of the attribute Operator is a result of the averaging of attribute importance values at the sample level, or the fact that the conjoint analysis revealed hidden respondent preferences.
The attribute Interval has shown to be second by importance (16.32%). Such a high ranking of this attribute is not surprising, because most conversations among the student population last for less than a minute. With this in mind, the respondents are fully aware of the fact that the package with fewer minutes and rounding off to 1 second is better for them then the package with a greater number of minutes and rounding off to 60s+1s or 60s+60s.
Next in line according to importance is the attribute Transfer (14.39%), which leads to the conclusion that a great number of respondents do not spend all of their free traffic within a month, and therefore they find it important to be able to
transfer the traffic onto the next month when it might be used, and therefore avoid additional billing.
High positioning of the attribute Internet (13.40%) is a result of the fact that the student population greatly uses the Internet, while mobile phones have become devices from which the internet is increasingly being accessed. In addition, there are a growing number of mobile phone services that require constant Internet access.
The poor positioning of the remaining attributes can be interpreted as the fact that students mostly think about current monthly spending and internet access, while the quality of service and potential future promotions have currently no great importance among the student population.
0.188 0.062
-0.25 0.531
-0.531 0.401
-0.401 0.508
-0.508 0.159
0.047
-0.206 0.302
-0.302 0.321
-0.321 0.343
-0.343
-0.6 -0.4 -0.2 0 0.2 0.4 0.6
MTS Telenor VIP Yes No High Low Yes No 1s 60s+1s 60s+60s Yes No Yes No Prompt Delayed
Operator Transfer Support Internet Interval Number Promotions Checking
Part-worth utilities
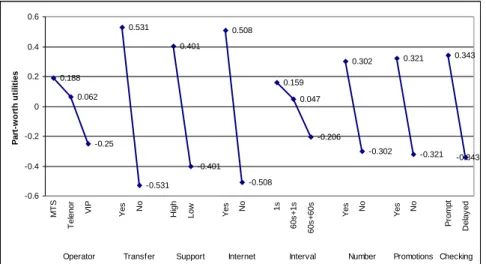
Figure 2 Part-worth utility functions
Figure 2 shows the part-worth utility functions for all of the attributes included in the study. It may be noted that all of them are extremely sensitive to level changes, but for the attribute Interval this sensitivity varies depending on the interval.
Namely, the preferences decline much faster in the interval 60s+1s to 60s+60s than in the interval 1s to 60s+60s. Nevertheless, only the best levels of each attribute increase the overall respondent preferences, while the worst decrease them (negative sign for part-worths).
3.2 Preference-based Segmentation
A more detailed analysis of part-worths at the individual level revealed wide heterogeneity in consumer preferences. Therefore, a cluster analysis was
performed to classify respondents into more homogeneous preference groups.
These part-worths are then used as input for cluster analysis. This approach has been conducted by various researchers across industries, in order to determine customer segments based on distinct preference profiles [19, 32, 33, 34].
The k-means cluster procedure in SPSS 16.0 was used to perform the segmentation. Based on the sample size, the solutions were searched in two and three clusters. The 3-cluster solution resulted in one segment that was very small in size and could not be statistically reliable (n < 15). A 2-cluster solution was chosen due to the size of the segments and statistical significance. An analysis of variance revealed that the segments in the 2-cluster solution differed significantly from each other, with respect to their part-worths generated by the conjoint analysis.
The mean part-worths for each of the levels of the attributes of the two segments are given in Table 6, while the importance scores are shown on Figure 3.
Table 6
Cluster analysis results of mean part-worths
Attribute and levels Segment I
n = 42 (31.34%)
Segment II n = 92 (68.66%) Mobile phone operator
MTS -0.4 0.45
Telenor 0.57 -0.17
VIP -0.18 -0.28
Possibility of transferring unused free traffic to the next month
Yes 0.36 0.61
No -0.36 -0.61
Level of availability and quality of technical support
High 0.39 0.4
Low -0.39 -0.4
Free internet within package
Yes 0.35 0.58
No -0.35 -0.58
Conversation billing interval
1s 0.73 -0.1
60s+1s 0.15 0
60s+60s -0.88 0.1
Possibility of choosing preferred phone number
Yes 0.24 0.33
No -0.24 -0.33
Promotions following the expiration of the contract
Yes 0.24 0.36
No -0.24 -0.36
Account balance check
Prompt 0.45 0.29
Delayed -0.45 -0.29
3.2.1 Characteristics of Segment I
The first and smaller segment consists of 42 respondents (31.34%). The most important attribute to them by far is the Interval (importance value = 24.25%), while the most preferred is level “1s”. Next by importance is the attribute
“Operator” with an importance value of 14.61%, while the most preferred operator is Telenor (part-worth utility = 0.57). Among the more important attributes in this group is also Checking (importance value = 13.55%).
If we observe the demographic data of the respondents that belong to this segment, it can be noted that the majority of them do not live with their parents (64.3%), and most of them are already using postpaid services (66.7%). It is also interesting that half of them are already using the services of Telenor. Based on this data, we can conclude that this segment mostly includes students who do not live with their parents, so they find it easier to have their parents pay the monthly phone bill instead of having to set aside money for credit several times a month.
Considering that they also find the manner in which their conversations are billed to be important, it can be concluded that they all very careful not to exceed their subscriptions.
An operator who wishes to win this segment over should offer such a service where the emphasis would be on rounding off conversations according to the “1s”
method, with instant balance updates. The possibility of transferring unused traffic and free internet within the package would only further attract new users, as well as keep the old ones.
24.25%
14.61%
13.55%
11.75%
10.84% 10.54%
7.23% 7.23%
3.29%
12.03%
9.56%
13.18%
19.11%
10.87% 11.86%
20.10%
0.00%
5.00%
10.00%
15.00%
20.00%
25.00%
30.00%
Interval Operator Checking Support Transfer Internet Number Promotions Attributes
Importance Values
Segment I Segment II
Figure 3
Importance values of attributes by segments
3.2.2 Characteristics of Segment II
The second, larger segment consists of 92 respondents (68.66%). The attribute with the greatest importance in this segment is the attribute Transfer (importance value = 20.1%), and right behind it is the attribute Internet with an importance of 19.11%. The third attribute by importance is the Support (13.18%), while fourth is the attribute Operator (12.03%) with an emphasis on the operator MTS. It is interesting that the attribute with the highest importance value in the first segment, the Interval, is by far in last place (importance value = 3.29%) in the second segment.
The demographic data of this segment shows that the majority of the respondents still live with their parents (56.5%), which is in sharp contrast with the first segment. Most of them use the services of MTS (62.0%), which indicates that they are satisfied with the current service.
The offer for this segment should emphasize the transfer of unused traffic, and free internet access within the package. Considering the fact that they do not find the billing interval to be very important, the model “60s+60s” could be left in this case, which allows for higher profits.
Conclusion
For mobile phone operators who operate in a highly competitive environment, it is very important to investigate the preferences of the segment of young people, who make up a significant base of future users. Meeting the needs and desires of this category of users can have an outcome of long-term loyalty to a particular company and its products or services.
The purpose of this paper was to use the conjoint analysis method to investigate how students from Serbia think when choosing a mobile postpaid package, i.e.
what is it precisely that makes them choose a package of a specific operator, and not the offered services of a competing company.
The findings of the study are significant to marketers on both the theoretical and practical level. On the theoretical level, they add to our knowledge of the relative importance of the various mobile phone service factors that influence young consumer decisions. On the practical level, the results provide information to mobile phone operators which could help them provide appropriate customer service levels more effectively. Namely, based on the results showing the level of perception that university students have regarding postpaid mobile services, this study suggested a marketing strategy for mobile operators. Moreover, the study identified two segments that differed according to preferences, and thus suggested two different marketing strategies for each of them.
The implementation of a conjoint analysis should be repeated after a certain period of time because user preferences change over time as well, and this is especially present in the high tech sector, which also includes mobile telephony.
Acknowledgement
This research was partially supported by the Ministry of Education, Science and Technological Development, Republic of Serbia, Project numbers: III44007 and TR33044.
References
[1] ITU: Key Global Telecom Indicators for the World Telecommunication Service Sector, 2011. Last retrieved October 15, 2012, from http://www.itu.int/ITU-D/ict/facts/2011/material/ICTFactsFigures2011.pdf [2] Plunkett's Wireless, Wi-Fi, RFID & Cellular Industry Almanac 2013. Last
retrieved October 15, 2012, from Plunkett Research:
http://www.plunkettresearch.com/wireless-cellphone-rfid-market- research/industry-statistics
[3] RATEL: An Overview of Telecom Market in the Republic of Serbia in 20011, Last retrieved October 15, 2012, from http://www.ratel.rs/market/overviews_of_telecom_market.129.html [4] Totten, J. W., Lipscomb, T. J., Cook, R. A., Lesch, W.: General Patterns of
Cell Phone Usage among College Students. Services Marketing Quarterly, 26(3) (2005) 13-39
[5] McClatchey, S.: The Consumption of Mobile Services by Australian University Students. International Journal of Mobile Marketing, 1(1) (2006) 1-9
[6] Aoki, K., Downes, E.: An Analysis of Young Peoples Use of and Attitudes toward Cell Phones. Telematics and Informatics, 20(4) (2003) 349-364 [7] Leung, L.: Unwillingness-to-Communicate and College Students' Motives
in SMS Mobile Messaging. Telematics and Informatics, 24 (2007) 115-129 [8] Ha, J. H., Chin, B., Park, D.-H., Ryu, S.-H., Yu, J.: Characteristics of Excessive Cellular Phone Use in Korean Adolescents. CyberPsychology &
Behavior, 11(6) (2008), 783-784. doi:10.1089/cpb.2008.0096
[9] Walsh, S. P., White, K. M., Cox, S., McD. Young R.: Keeping in Constant Touch: The Predictors of Young Australians‟ Mobile Phone Involvement.
Computers in Human Behavior, 27(1) (2011) 333-342
[10] Kennan, W., Hazleton, V., Janoske, M., Short, M.: The Influence of New Communication Technologies on Undergraduate Preferences for Social Capital Formation, Maintenance, and Expenditure. Public Relations Journal, 2(2) (2008)
[11] Kennedy, G., Krause, K., Judd, T., Churchward, A., Gray, K., Unit, B.:
First Year Students‟ Experiences with Technology: Are They Really Digital Natives. Educational Technology, 24(1) (2008) 108-122
[12] Akın, M.: Predicting Preferences of University Students for Prepaid vs Post Paid Cell Phone Service Plans. Expert Systems with Applications, 38(8) (2011) 9207-9210, doi:10.1016/j.eswa.2011.01.122
[13] Kohne, F., Totz, C., Wehmeyer, K.: Consumer Preferences for Location- based Service Attributes: A Conjoint Analysis. International Journal of Management and Decision Making, 6(1) (2005) 16-32
[14] Zhang, X., Prybutok, V.: How the Mobile Communication Markets Differ in China, the U.S., and Europe. Communications of the ACM, 48(3) (2005) 111-114
[15] Hair, J. F., Anderson, R. E., Tathan, R. L., and Black, W. C.: Multivariate Data Analysis, Englewood Cliffs, NJ: Prentice Hall, 1995
[16] Kuzmanovic, M., Martic, M.: An Approach to Competitive Product Line Design Using Conjoint Data. Expert Systems with Application, 39(8) (2012) 7262-7269. doi: 10.1016/j.eswa.2012.01.097
[17] Kuzmanovic, M., Martic, M.: Using Conjoint Analysis to Create Superior Value to Customers, Metalurgia International, 17(2) (2012) 93-99
[18] Kuzmanović, M., Obradović, T.: The Role of Conjoint Analysis in the New Product Price Sensibility Research. Management – Journal for Theory and Practice Management, 15(54) (2010) 51-58
[19] Kuzmanovic, M., Panic, B., Martic, M.: Identification of Key Positioning Factors in the Retail Sector: A Conjoint Analysis Approach, African Journal of Business Management, 5(26) (2011) 10376-10386
[20] Wilson-Jeanselme, M., Reynolds, J.: The Advantages of Preference-based Segmentation: An Investigation of Online Grocery Retailing. Journal of Targeting, Measurement and Analysis for Marketing, 14(4) (2006) 297-308 [21] Hensher, D.: The Valuation of Commuter Travel Time Savings for Car Drivers: Evaluating Alternative Model Specifications. Transportation, 28 (2001) 101-118
[22] Sohn, S. Y., Ju, Y. H.: Conjoint Analysis for Recruiting High Quality Students for College Education. Expert Systems with Applications, 37 (2010) 3777-3783
[23] Popović M., Kuzmanović M., Martić, M.: Using Conjoint Analysis to Elicit Employers‟ Preferences toward Key Competencies for a Business Manager Position. Management – Journal for Theory and Practice Management, 17(63) (2012) 17-26, doi: 10.7595/management.fon.2012.0011
[24] Kim, Y.: Estimation of Consumer Preferences on New Telecommunications Services: IMT-2000 Service in Korea. Information Economics and Policy, 17(1) (2004) 73-84
[25] Sobolewski, M., Czajkowski, M.: Network Effects and Preference Heterogeneity in the Case of Mobile Telecommunications Markets.
Telecommunications Policy, 36(3) (2012) 197-211
[26] Kuzmanovic, M., Vujošević, M., Martic, M.: Using Conjoint Analysis to Elicit Patients' Preferences for Public Primary Care Service in Serbia, HealthMED, 6(2) (2012) 496-504
[27] Head, M., Ziolkowski, N.: Understanding Student Attitudes of Mobile Phone Applications and Tools: A Study Using Conjoint, Cluster and SEM Analyses. Proceedings of the 18th European Conference on Information Systems (ECIS 2010) Pretoria, South Africa, 2010
[28] Kim, C., Choe, S., Choi, C., Park, Y.: A Systematic Approach to New Mobile Service Creation. Expert Systems with Applications, 35 (2008) 762-771
[29] Nakamura, A.: Estimating Switching Costs Involved in Changing Mobile Phone Carriers in Japan: Evaluation of Lock-In Factors Related to Japan‟s SIM Card Locks. Telecommunications Policy, 34(11) (2010) 736-746, doi:
10.1016/j.telpol.2010.10.003
[30] Majláth, M.: Evaluation of Environmentally Friendly Product Attribute – Results of an Empirical Research. Proceedings of the MEB 7th International Conference on Management, Enterprise and Benchmarking, Budapest, June 5-6, 2009, 201-212
[31] Orme, B.: Which Conjoint Method Should I Use? Research Paper Series, Sawtooth Software, Inc., 1996
[32] Baker, G. A., Burnham, T. A.: The Market for Genetically Modified Foods:
Consumer Characteristics and Policy Implications. International Food and Agribusiness, 4 (2002) 351-360
[33] Haddad, Y., Haddad, J., Olabi, A., Shuayto, N., Haddad, T., & Toufeili, I.:
Mapping Determinants of Purchase Intent of Concentrated Yogurt (Labneh) by Conjoint Analysis. Food Quality and Preference, 18 (2007) 795-802
[34] Makila, M.: Retaining Students in Retail Banking through Price Bundling:
Evidence from the Swedish Market. European Journal of Operational Research, 155 (2004) 299-316