Introduction
Knowledge-intensive industries and espe- cially the emergence and development of information and communication technolo- gies (ICT) opened a new chapter in urban development and is expected to be a sector that will determine economic development in the coming decades. In the post-industrial age, the transformation of urban networks
and urban regions was fundamentally influ- enced by the rapid spread of ICT. Urbani- zation and ICT have not only changed the physical environment of cities, but they have also influenced changes in the social and eco- nomic environment (Portugali, J. et al. 2012).
The restructuring of urban space has been strongly influenced by ICT. It has played an important role in all areas of human life and has also significantly reshaped people’s be-
1 Budapest Business School, University of Applied Sciences, Faculty of Commerce, Hospitality and Tourism.
Markó u. 29–31. 1055 Budapest, Hungary. Geographical Institute, Research Centre for Astronomy and Earth Sciences, Budaörsi út 45. 1112 Budapest; E-mail: egedy.tamas@uni-bge.hu
2 Centre for Social Sciences, CSS-Recens. Tóth Kálmán u. 4. 1097 Budapest, Hungary. E-mail: sagvari.bence@tk.hu
Urban geographical patterns of the relationship between mobile communication, social networks and economic
development – the case of Hungary
Tamás EGEDY1 and Bence SÁGVÁRI2
Abstract
In the post-industrial age, the transformation of urban networks and urban regions was fundamentally influ- enced by the rapid spread of infocommunication technologies (ICT) and the Internet. People share information in their daily lives with the help of various ICT devices and ultimately generate georeferenced data that could obtain important information about people’s use of space, spatial movement and social connections. The main aim of the study is to explore the urban geographical and spatial impacts of ICT and social media networks in Hungarian cities. We focus on drawing territorial and settlement hierarchical patterns and clusters based on the mobile communication and online social network relationship data of Hungarian cities. The paper highlights the relationship between the intensity of mobile communication and the density and expansion of intercity social relations and the settlements’ level of economic development, respectively. The methodology is based on mobile phone call detail record (CDR) analysis and intercity network analysis of social media activities. Our findings suggest that different communication networks follow divergent spatial patterns in Hungary. The traditional East–West dichotomy of the Hungarian spatial divide is still reflected in mobile communication, but intercity clusters based on social media activities are usually aligned to the borders of administrative structures. In several cases, we were able to identify strong intercity links between settlements with a similar level of economic development of the mesolevel spatial structure that traverses over different counties and regional borders. Results on social and demographic issues suggest that ‘generation Z’ could play a key role in dampening the social and economic tensions created by the digital divide in the long run.
Using a multidimensional explanatory model, we could demonstrate the growing interconnectedness between digital networks and economic development.
Keywords: ICT, mobile communication, cell data, ‘Apple index’, social media, intercity networks Received March 2021, accepted May 2021.
haviour (Alias, N.A. 2013; Wiig, A. 2014).
This is because people share information in their daily lives with the help of various info- communication technologies (mobile phones, smartphones, tablets, etc.) and ultimately generate knowledge in a bottom-up way.
If this shared information is georeferenced, we can also obtain important information about people’s use of space, spatial move- ment and social connections (Ciuccarelli, P. et al. 2014).
Sassen, S. (2001) pointed out that ICT transforms the spatial organization of society and economy, as well as consumption pat- terns. In recent years, however, several stud- ies have highlighted the contradictory effects of ICT on urban development and it is still unclear how ICT affects the transformation of urban space (Audirac, I. 2005), as telecom- munication technologies are changing very rapidly (Graham, S. and Marvin, S. 2002) or we are not even able to recognize the spa- tial effects of ICT (Firmino, R.J. et al. 2006).
One of the questions to be answered today is whether telecommunications, the intensity of connections are better supported by the close physical connection of people and companies or whether proximity and geographical loca- tion are losing their relevance because of vir- tual connections due to modern ICT systems.
This area of discussion could gain useful in- sights due to the COVID-19 pandemic that fundamentally (and prospectively not just temporarily) changed how people interact, work and move.
Many believe that ICT will fundamentally change and undermine the importance of geography and distance in urban develop- ment and a potential impact of ICT will be that people will be scattered in space and the role of cities as central places will dimin- ish (Iammarino, S. and McCann, P. 2013).
According to Cairncross, F. (2001), space and distance will play a smaller and small- er role in the future, and Gillespie, A. and Williams, H. (1988) make the point that ICT resolves geographical (territorial) differenc- es. In contrast, some experts believe that the effects of the Internet and cyberspace on the
space-time relationship will persist, so that geographical space, including spatial loca- tion and distance, will continue to play a key role in urban development (Jakobi, Á. 2013;
Lengyel, B. et al. 2015).
Tranos, E. (2013) draws attention to the fact that the Internet and telecommunications continue to be primarily urban phenomena.
Material and digital spaces are becoming more and more intertwined, building and working together. The economic perfor- mance continues to depend on stationary, material spaces, which are increasingly per- meated by the Internet and the cyber net- work (Graham, S. 1998). Thus, the Internet and ICT ultimately increase the importance of geography and distance (Tranos, E. and Nijkamp, P. 2013). The correlation between the use of ICT and the Internet and the city is not negative, and virtual and physical con- tact do not replace but rather complement each other.
The main aim of the study is to explore the urban geographical and spatial impacts of ICT and social media networks through the investigation of mobile phone cell data (call detail records CDR, big data analysis) and the intercity network linkages of an online social network.
Based on these two types of data we aim to answer the following research questions:
–What territorial and settlement hierarchi- cal patterns and clusters can be drawn based on the mobile communication and online social network relationship data of Hungarian cities?
–Are macro-level processes of mobile com- munication reflected in the demographic and spatial characteristics of mobile use?
–Is there any relationship between the in- tensity of mobile communication and the density and expansion of intercity social relations and the settlements’ level of eco- nomic development?
–What is the role and weight of different digital networks in shaping territorial pat- terns?
The main added value of the research is that based on a novel approach and innova-
tive methodology using cell phone data and social media network analyses simultane- ously, new scientific results are provided on the changing spatial structure of Hungary.
This allows us to get insights into differences between traditional territorial structures and the latent digital and virtual spatial patterns.
Theoretical background
Digital divide in a digitalising world
Socio-economic disparities in Europe have a profound impact on internet use, with the re- sult that EU countries are increasingly faced with growing digital inequalities (Stiakakis, E. et al. 2010). The concept of the digital di- vide emerged in the mid-1990s (Long-Scott, A. 1995) and became a focus of research in the second half of the 2000s. By the time research had drawn attention to the fact that Internet access and the development of the ICT sec- tor could fundamentally increase social and territorial inequalities (Rallet, A. and Ro- chelandet, F. 2007). In the 2010s, a growing body of research testified that ICT undoubt- edly contributes to economic development (Pepper, R. and Garrity, J. 2015). Therefore, there is no doubt that ICT and digital tech- nologies have a positive impact on economic development, but this development is highly uneven across countries (Richmond, K. and Triplett, R.E. 2017). This process has been highlighted by several international reports in recent years as well (The Global Informa- tion Technology Report 2015; World Devel- opment Report 2016).
The World Bank’s Digital Dividends (2016) report makes several key findings that are closely related to the topic of our study.
On the one hand, it states that ICT and the Internet are fundamental contributors to eco- nomic growth and social inclusion, but on the other hand, we cannot ignore the fact that the digital divide can be as large as the gap between countries’ economic development While 80 per cent of the world’s population has access to a mobile phone, internet access
is only 40 per cent. Of course, there is a sig- nificant gap in mobile and internet usage be- tween developing and developed countries.
Digital divide is predominantly increased by accessibility to the internet in developing countries and skills in the developed world and the European Union. There are also sig- nificant gender and age differences in the use of digital technologies: men and young people use them to a greater extent.
Cities as hubs of the digital space
An examination of the use of mobile com- munication devices in cities provides an excellent opportunity to explore the quality and characteristics of technology and com- munication. In urban space, the population moves between a relatively small number of locations, usually along well-defined trajec- tories. Csáji, B.C. et al. (2012) concluded that now people spend most of their time in a few locations and Song, C. et al. (2010) observed a 93 per cent potential predictability in user mobility. Due to urbanization, the proportion of the urban population is constantly increas- ing, so the population is increasingly tied to the urban space, and their daily life and mobility are increasingly taking place in the urban space. Mobile communication devices play a decisive role in communication and by collecting and examining the data gen- erated during their use, we can essentially gain insight into the operation of the city.
The easiest way to research mobile usage is to collect and analyze event-driven mobile phone network data (event means voice, SMS or data messages).
Most telephone networks generate call de- tail record (CDR) that are data records pro- duced by a telephone exchange document- ing the details of a phone call or SMS passed through the device. CDR data is extremely suitable to track the whole population for a long time and with relatively high spatial ac- curacy (Calabrese, F. et al. 2011a, b; Deville, P. et al. 2014). By implication, the more in- tense the mobile communication, the larger
the amount of CDR data generated, and the transmission of data requires an increasing- ly advanced technological background and mobile communication network. The capac- ity of the installed infrastructure varies dra- matically across different cities and regions, thus, affecting the aggregated opportunities in these areas to participate and enjoy the benefits of the digital economy (Tranos, E.
et al. 2013).
According to Raschke, M. et al. (2014) there is a close correlation between the construc- tion of the mobile communication network (i.e. digital accessibility) and the position of cities in the settlement hierarchy. However, the digital accessibility pattern reveals an alternative urban hierarchy incorporat- ing the cost and opportunities for virtual interaction. This new hierarchy, while still employing physical distance as a proxy for the cost and value of virtual interactions, re- sults in European geography, where the core remains similar to the one that is revealed by more traditional accessibility measures.
Research has moved to the direction of how to redraw the previous settlement hierarchy based on opportunities of mobile commu- nications and virtual interactions. In many cases, new settlements appear as dominant hubs within the socio-economic space.
Technological development, communica- tion and the use of mobile communication devices are predominantly concentrated in the urban areas, therefore cities can be inter- preted as independent communication hubs in the digital space. We hypothesize that the communication (event and data traffic) measured in each city is closely related to the economic role, competitiveness, and produc- tivity of the local economy.
Another source of information that can be utilized to capture the dynamics of so- cial relations is online social network data.
We suggest that it can be used as a proxy for real life social ties (Bailey, M. et al. 2018;
Norbutas, L. and Corten, R. 2018). While family and close friendship ties constitute bonding social capital (relations) that reflects connections characterised by high levels of
similarity not just in terms of demographic characteristics, values and attitudes but avail- able information resources (Granovetter, M. 1985; McPherson, M. et al. 2001). On the contrary, bridging social capital describes connections that link different social groups and therefore are essential to the spread of information, ideas and resources. Cities can also be described by aggregate network char- acteristics of their individuals both in terms of intercity (Pan, W. et al. 2013) and intracity connections (Tóth, G. et al. 2021).
Digital networks and the socio-economic development
Early big data and network research on mo- bile use began in the second half of the 2000s.
Dominant research institutions in this field were the Barabási’s ‘Center for Complex Network Research’, Ratti’s team of the ‘MIT SENSEable City Lab’ and Ahas’s ‘Mobility Lab 13’ of the University of Tartu. Thanks to the pioneering work of the three organi- zations, the number and scope of research expanded significantly in the early 2010s and nowadays three distinct scopes of research related to mobile use have emerged:
1. Research on the social environment and demographic characteristics of the local pop- ulation (e.g. Gonzalez, M. et al. 2008; Eagle, N. et al. 2009; Song, C. et al. 2010; Hernandez, M. et al. 2017);
2. Research related to the geographical and urban space (e.g. Ahas, R. et al. 2006; Becker, R.A. et al. 2011; EC 2014; Järv, O. et al. 2014);
3. Technology and network-oriented research (e.g. Onnela, J.-P. et al. 2007;
Lambiotte, R. et al. 2008; Wang, P. et al. 2009;
Calabrese, F. et al. 2011a, b).
Mobile phones and similarly innocuous de- vices opened the way to social network anal- yses and research on the geography of social networks (Blondel, V.D. et al. 2010, 2015;
More, J. and Lingam, C. 2013; Schläpfer, M.
et al. 2014). Since the mid-1990s, more and more research demonstrated that ICT is an important source of productivity.
The first studies to reveal the links between mobile use and socio-economic development appeared in the late 2000s. Eagle, N. et al.
(2010) in a study using data from the UK suggested that the social and geographical diversity of contacts correlates positively with the socio-economic characteristics of the neighbourhood, thus, there is a relation- ship between the structure of a user’s social network and the environment in which they live. Mao, H. et al. (2013) investigated the relationship between the characteristics of mobile phone network and the socio-eco- nomic status of a developing region in the Ivory Coast. They observed that high mobile communication activity seems to correspond well to regions that are important for the na- tional economy. Smith-Clarke, C. et al. (2014) found that poverty levels are also linked to deviations from the expected flow of com- munications: if the volume of communica- tion is significantly lower than expected from and to a certain area, then higher poverty levels are to be expected. Frias-Martinez, V. et al. (2013) observed that socio-economic levels follow a pattern which is basically pre- dictable by mobile phone data. Norbutas, L. and Corten, R. (2018) analyzed network structure and economic prosperity in Dutch municipalities. They recognized that geo- graphically long bridges are linked to eco- nomic prosperity at community level, and high network density and fragmentation are associated with lower economic pros- perity. Thus, over the past decade, countless research findings have shown that CDR to- gether with online social network data are a suitable way to demonstrate the economic performance of cities.
Methodological background
Analysis of urban mobile use based on cell data In recent years, several summary studies on the structure and operation of mobile net- works have been published, which provide a very good overview of the technological
background of mobile communication sys- tems and cell data processing (Calabrese, F. et al. 2014; He, Y. et al. 2016; Gregersen, F.A. and Lunke, E.B. 2018; Qin, S. et al. 2019).
Therefore, in the methodological part, we do not present the technological background of mobile network systems and only introduce the methodology of our specific research.
For the research, we used the mobile cell data of Telekom Hungary’s network (herein- after Telekom). The spatial projections of mo- bile cells are polygons, which denote the area served by each tower. To determine the posi- tion and extent of the polygons, Telekom uses a 127 x 127 m raster network that fully covers the territory of the country. The basic unit of a polygon is, thus, the raster, for which, how- ever, we have only estimated information.
In the network of the service provider, more than 24 million rasters, and 40,000 polygons cover the territory of Hungary. In this raster network, we can localize nearly 220 million events on an average day.
Cell data provided by Telekom Hungary records the coverage area within which the subscriber is likely to be during the active use of a SIM card. The system records the min- ute-based time of the activity indicating the start of the activity (i.e. the time of starting/
receiving a voice call, the time of sending/re- ceiving an SMS and the start of Internet use).
Besides location data, the database contains information on the country of origin, device type, age, gender, zip code and company type. The database of the service provider was supplemented with Corine Land Cover data updated in 2012 and information on the device used.
The most crucial methodological question was how to assign polygons to the examined settlements. This is because polygons can cover several settlements, rasters can appear inside or outside the city, even covering wa- ter surfaces. The most expedient solution was to divide cell data proportionally between the settlements and the areas of different character. So, if 70 out of the 100 rasters of a polygon is covering territorial unit A and 30 territorial unit B, then the equipment (SIM
card subscriber) using the tower was classi- fied 0.7 parts to unit A, and 0.3 parts to unit B. The sum of the fractional values shows more accurately the number of Telekom subscribers in a given city. We also weight- ed the cell data according to the character of the raster, as in the city, mobile use is much more likely to be related to residential areas or green spaces than to agricultural areas or even water surfaces. Depending on the type of rasters, the following weighting was ap- plied (in per cent):
–100: Residential areas, parks, cemeteries, green areas, sports courts, airports etc.
–50: Industrial areas, roads, railways, ports etc.
–20: Agricultural areas, forests, water sur- faces etc.
During the research, we collected data from 345 Hungarian cities and Budapest. The data was collected for 7 days between September 2018 and June 2019 including both typical weekdays and weekend days. All indicators used in the analysis are based on the average values calculated for these days.
The original dataset included several met- rics for the content and intensity for mobile communication, such as frequencies for in- coming and outgoing voice calls and SMSs;
number of online events that required trans- fer of data; and number of devices that were located in the cell coverage area linked to the particular settlement. In the analysis we used per capita ratio of events and events per equipment. We also made some experiments with a special index that shows the ratio of Apple devices compared to all devices in the total number of events. Since devices manu- factured by Apple are generally more expen- sive than competing brands, we hypothesize that the index might positively correlate with income at settlement level (Figure 1).
Online social network data
Besides CDR data we also used information on social relations derived from an online so- cial network. The iWiW (International Who Is
Who) was launched in 2002 and shortly be- came the most widely used online social net- work in Hungary. At its peak around 2010, it was one of the most visited national websites reaching most internet users of the country.
In February 2013, the entire dataset of iWiW with information on self-chosen location (at town level) and connection data (establish- ment of friendship ties) was made available for us for scientific research purposes. Use of the service was limited to those aged over 14, so theoretically the maximum number of po- tential users was 8,2 million people in Hun- gary. The total number of users who chose a Hungarian settlement as their home location reached 2.8 million by early 2013 (another 600,000 users were outside Hungary). This implies that about 33 per cent of Hungarians older than 14 years were part of the network.
Considering the level of internet users meas- ured by nationally representative surveys (76%) in 2013, close to 50 per cent of the adult online population were also iWiW users.
In our analysis, social connections repre- sented online are used as a proxy of real-life social connections. This approach is certainly a simplification of the complex social reality, but we argue that despite our data is imper- fect and has certain limitations (i.e. we do not know about the nature of social connections, their strength, frequency of communication, etc.), until now it is still the best available source, and there is no such systematic bias in the data that would question the validity of the analysis. Since our analysis if focus- ing only on cities (345 settlements excluding Budapest) in Hungary, the representativity of the data is better than using the full data- set that includes more than 2,000 additional villages with generally lower user rates.
The average iWiW user rate varied between 23 and 36 per cent across different city size categories. The use of online social networks (similar to the general use of technology) is potentially influenced by the level of eco- nomic development, therefore introducing some bias to the analysis. (Tóth, G. et. al.
2021). However, the use of weighted network metrics eliminates the problem.
Network measure for identifying the relative strength of city-to-city connections
Based on the methods described by Lengyel, B.
et al. (2015), Jakobi, Á. (2017), and Tóth, G. et al.
(2021) we calculated three network indicators for the subset of 345 cities in Hungary.
–The overall embeddedness of a given city was measured by the log-likelihood ratios of observed and randomly expected settle- ment-to-settlement tie weights. This indica- tor controls for the bias derived from the dif- ferent size (and therefore different number of iWiW users) of cities. Smaller values indicate generally weaker connections to other cities, while larger values imply a higher level of embeddedness to the social network of cities.
Figure 2 shows the slightly right skewed dis- tribution of average weights in cities peaking around -1.5.
–Average relative distance rates refer to the physical distance of connections a city has with other cities in the country. Since the absolute distance of connections largely de- pends on central or peripheral geo-position of a settlement (Jakobi, Á. 2017, 206) we used relative distance rates that account for the comparison of the observed and expected distance averages.
–While the first two measured were intended to capture the intercity network characteris- tics, social network fragmentation was calcu- lated for each intracity networks in our data-
set. Based on the Louvain algorithm the den- sity of edges within groups was compared to the density across groups, and then scaled by a theoretical maximum value when all edges were within the communities. Intracity net- works with high fragmentation have dense connections between the nodes within com- munities but sparse connections between nodes in different communities.
Results
Spatial and demographic characteristics of mobile use
The results of our big data analysis based on mobile phone use and related to the spatial patterns and networks of digitalization re- flect previous geographical results obtained using traditional research methods. Figure 3 shows the traditionally underdeveloped ar- eas, which proves that the results of big data investigations can be used in spatial analysis and urban mobile use investigations provide relevant information on spatial processes.
Based on the event per capita and the event per equipment indicator and related statis- tics, the following groups of settlements can be identified as defining digital nodes in the Hungarian city network system:
1. Budapest and Budapest Metropolitan Region. The city and districts of the downtown Fig. 1. Distribution of mobile communication metrics
(e.g. districts I., V. and VI.) as well as the cities of the western sector of the agglomeration zone (e.g. Törökbálint, Budaörs);
2. Cities along major transport axes and mo- torways (e.g. Komárom and Lébény along the Budapest–Hegyeshalom axis of M1 motorway leading to the West, Rácalmás – the headquar- ter of Hankook Tires in Hungary – along the M6 motorway leading to the South);
3. Cities and spa towns with significant tour- ist potential (e.g. Zamárdi and Zalakaros near Lake Balaton, and Visegrád near Budapest);
4. Cities located near significant border cross- ings (e.g. Záhony, at the border to the Ukraine).
The “digital desert” of the city network consists of the following groups of settlements:
1. Cities located on the periphery from a geographical settlement point of view (e.g.
Sajószentpéter in Borsod-Abaúj Zemplén county, and Salgótarján, the county seat of Nógrád county, both counties located in Northern Hungary);
2. Settlements located in so-called inner pe- ripheries from a socio-economic point of view (e.g. Rákóczifalva in the Great Plain, Sásd in Southern Transdanubia, and Répcelak in Western Transdanubia).
We hypothesized that mobile phone use re- flects Hungary’s traditional economic pattern.
Research over the past decades has shown that, on the one hand, the Hungarian economy is characterised by a significant West–East di- vide with higher levels of development in the central and western part of the country (e.g.
Budapest and Western Transdanubia), and on the other hand, the most underdeveloped ar- eas of the country are located in the south-west and north-east (e.g. Baranya, Borsod-Abaúj- Zemplén and Szabolcs-Szatmár-Bereg counties) (Nemes Nagy, J. and Tagai, G. 2011; Dusek, T.
et al. 2014; Győri, R. and Mikle, G. 2017).
To prove the West–East dichotomy in digi- talization and mobile use, we calculated the correlation between cell data and the coordi- Fig. 2. Distribution of network metrics
Fig. 3. Event per capita (left) and event per equipment (right) indicator in Hungarian cities.
nates of the GPS geodetic reference system of the WGS84 (World Geodetic System 1984).
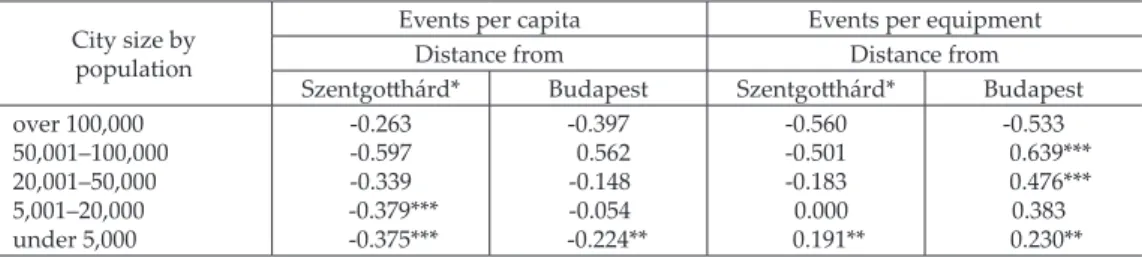
This grid system is used to determine the geo- graphical (spatial) position. During the investi- gations, we examined the correlation between the values of data traffic per event indicator measured in cities and the longitude coordi- nates of cities given in the WGS84 system. The reference settlement was Szentgotthárd as the most Western city in Hungary.
In the WGS84 system, the West–East slope was clearly detectable in the spatial change in mobile cell data. The farther to the East the city is from Szentgotthárd, the lower the data traffic/event index. The correlation shows a medium-strong co-movement with reverse sign in both small towns and large cities. We also calculated the correlation with Budapest as the reference settlement as well. Results indicate that mobile use decreased with dis- tance from the capital city, the correlation shows a moderate co-movement with reverse sign. The core–periphery relation shows a lower correlation than the West–East dichot- omy (Table 1).
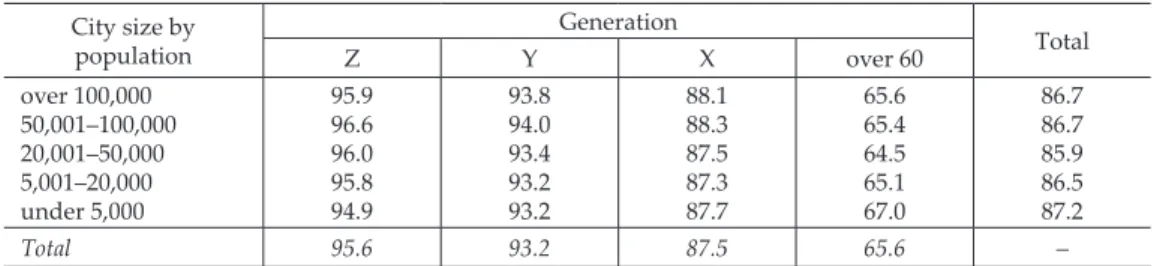
We also hypothesized that the spatial pat- terns drawn in urban mobile communica- tions are also reflected in the demographic and spatial characteristics of mobile use. We examined the demographic and territorial processes underlying mobile communication through the use of mobile devices by differ- ent generations (i.e. generations X, Y and Z).
The proportion of smartphones among mo- bile users is a simple yet excellent indicator that is suitable for exploring the differences in mobile use between generations and its
spatial pattern. Information on the age of the subscribers was provided by Telekom for 10-year cohorts, so generations could be defined as follows: generation X (41–60 years old), generation Y (21–40 years old), genera- tion Z (11–20 years old). Due to the division by cohorts, the identification of generations slightly differs from the official, scientific age classification of these generations.
Nationwide, the proportion of smartphone users is 85.5 per cent, which is for informa- tion only, as for many users, the cell infor- mation does not include the type of mobile device used. The technological proficiency of generation Z is well reflected in the type of mobile phones and communication devices used. Members of generation Z are virtu- ally born into the use of digital technologies and are often called digital natives (Prensky, M. 2001) who are accustomed to the rapid flow of information and the rapid reception of information. It is no coincidence that the proportion of smartphone users is higher in all city categories compared to other genera- tions (Table 2). In this table only those sub- scribers are counted whose mobile device could be identified.
The share of smartphones in all settlement categories shows significant differences be- tween generations. We can state that the use of smartphones, which actually represents a higher level of technology and require more proficiency, decreases with age. However, this trend will clearly fade out in the future, as with the ageing of generation Z, techno- logical proficiency will reach an ever higher level in society. On the other hand, we have
Table 1. Correlation between events per capita, events per equipment and distances from Szentgotthárd and Budapest City size by
population
Events per capita Events per equipment
Distance from Distance from
Szentgotthárd* Budapest Szentgotthárd* Budapest
over 100,000 50,001–100,000 20,001–50,000 5,001–20,000 under 5,000
-0.263 -0.597 -0.339 -0.379***
-0.375***
-0.397 0.562 -0.148 -0.054 -0.224**
-0.560 -0.501 -0.183 0.000 0.191**
-0.533 0.639***
0.476***
0.383 0.230**
*The most Western city in Hungary, **p < 0.05, ***p < 0.01.
to emphasize that no significant differences can be detected within the same generation at the different settlement category levels.
Comparing our results with those of Table 2, we can conclude that higher position in the settlement hierarchy brings along more active mobile phone use in each generation.
Looking at the spatial pattern of the use of communication devices in cities, we can state that the spatial characteristics of mobile phone users of generation Z in Hungarian cities significantly differ from those of gen- eration X and Y. For generation Z, no charac- teristic spatial pattern is recognizable, which means no significant difference can be detect- ed in the geographical pattern of mobile use (Figure 4). This process is particularly striking in the case of smaller cities. Thus, generation Z can successfully contribute to reducing the negative effects of the digital divide.
Another noteworthy result comes from the use of the ‘Apple index’ that was calcu- lated from the mobile communication dataset
(Figure 5). The share of Apple device users (compared to other brands) ranges from 7.98 per cent (in Mezőkovácsháza, average income per capita: 1.21 million HUF) to 35.91 per cent (in Budaörs, average income per capita: 1.92 million HUF) with a mean value of 18.19 per cent. Figure 5 shows that the ‘Apple index’
is a relatively reliable predictor (R2 = 0.69, p < 0.001) of income per capita at settlement level. (There might be some biases that we could not control for: mobile events might not only be linked to local population but also to devices that are owned by people who only temporarily work or just pass through the settlement.) Nevertheless, this indicator is a good example of such big data – CDR sources that could complement and/or validate of- ficial statistics (Blumenstock, J. et al. 2015).
In the tail end of the coordinate system, where the low share of Apple devices is cou- pled with low per capita income, we find mainly small towns with less than 5,000 in- habitants located in the periphery and inner Table 2. Ratio of smartphone users in the generations, %
City size by population
Generation
Total
Z Y X over 60
over 100,000 50,001–100,000 20,001–50,000 5,001–20,000 under 5,000
95.996.6 96.095.8 94.9
93.894.0 93.493.2 93.2
88.188.3 87.587.3 87.7
65.665.4 64.565.1 67.0
86.786.7 85.986.5 87.2
Total 95.6 93.2 87.5 65.6 –
Fig. 4. Ratio of smartphone users in the generations X (left) and Z (right) in Hungarian cities, in per cent
periphery of the country (where the average ratio of Apple devices is 17.2%). Moving up the settlement hierarchy, as the size of cities increases, the overall position of each category of cities in the model becomes more favour- able and the share of Apple devices increases (with average for cities with a population of more than 100,000 inhabitants of 21.2%). Large cities (regional centres and county seats) there- fore have an ’Apple index’ slightly above the national average. In the upper section of the coordinate system we find the wealthiest cit- ies located on the Buda side of the Budapest metropolitan region (Budaörs, Törökbálint, Budakeszi, Biatorbágy). Our results, thus, show a strong correlation between the ‘Apple index’, per capita income and position in the hierarchy of municipalities. The position of the towns alongside the Lake Balaton and spa towns with significant tourism is surprising:
an above-average ‘Apple index’ is associated with lower per capita income, supposing that these cities attract many people of the middle class in wealthier cities of the country as visi- tors and tourists. The ‘Apple index’ is the low- est in Békés county (12.6%), which is experi- encing significant social and economic difficul- ties, and highest in Pest county (24.3%), which actually includes the Budapest agglomeration.
Spatial patterns and clusters of intercity social networks
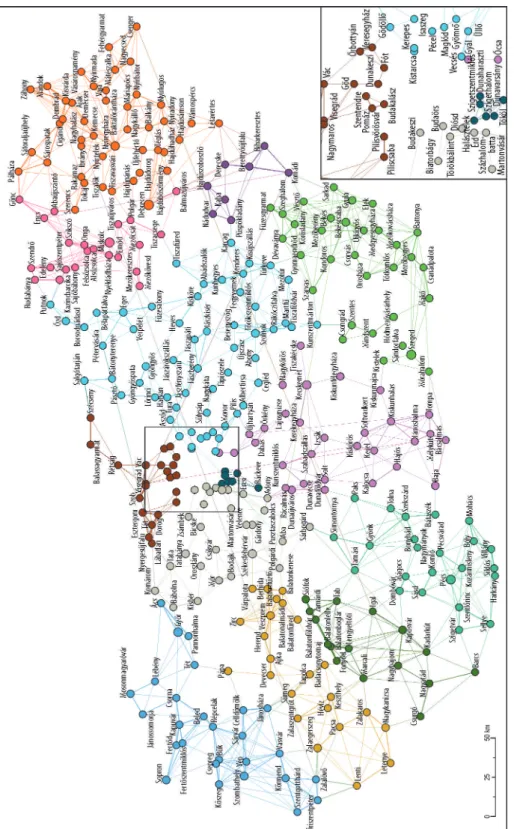
Using the pairwise LLR weights and filtering to city-to-city connections with LLR weights larger than 2, we were able to identify several (n = 13) densely connected groups of cities in Hungary. The clustering was based on the Louvain method (Blondel, V.D. et al. 2008).
Certainly, the results are in line with the find- ings of the earlier study of Lengyel, B. et. al.
(2015) using data for all available settlements in Hungary.
Based on the map of Figure 6 and 7, some general observations could be made. Most importantly, the borders of the clusters tend to resemble the administrative county and planning-statistical region borders, how- ever, in some cases they overlap them. The map of the clusters clearly demonstrates that based on their social connections, cities in the Budapest agglomeration does not constitute an integral spatial structure. Rather it dis- parts into independent northern, western, and eastern sectors that are only loosely con- nected to each other.
There are two remarkable natural barriers that also limit the formation of social con- nections. Ties overarching the northern and Fig. 5. Relationship between average income per capita and the share of Apple devices among users, in per cent
southern shore of Lake Balaton, and also ties between cities lying on the left and right sides of the Danube are clearly weaker.
Additionally, the administrative and inter- city social networks of the regions of Western and Central Transdanubia in the north- western part of the country does not overlap.
The less developed Zala county in Western Transdanubia is rather connected to the least developed Veszprém county of the Central Transdanubia region forming Cluster 2.
Cluster 13 mostly covers the western agglom- eration zone of Budapest. The administrative regional and county boundaries between regions of Northern Hungary and Northern Great Plain are increasingly blurred by the spatial pattern of intercity social network relations and are aligned with a west-east developmental slope (Clusters 7–10). A nar- row buffer zone (Clusters 8 and 10) separates the larger western half of the area (Cluster 7) and the smaller eastern half (Cluster 9). In the western and north-western as well as in the northern and north-eastern part of the coun-
try, digital networks could lead to a major change in the spatial pattern in the long term.
In terms of digital network interconnec- tions, the Southern Great Plain and South Transdanubia regions appear as well-defined autonomous areas. However, there are very few intercity network connections between the western half (Cluster 12 – Bács-Kiskun county, and Cluster 3 – Somogy county) and the east- ern half (Cluster 11 – Csongrád-Csanád and Békés counties, and Cluster 4 – Baranya and Tolna counties) of the two regions.
Budapest and Pest county (autonomous administrative regions since 2018) cannot be considered as separate territorial units from a digital network perspective. The circular ag- glomeration of Budapest does not constitute a unified cluster, instead it is split into northern, eastern, southern and western sectors.
Using data for 2018 we compared individ- ual cities and city clusters with their aver- age level of income per capita. The cities that build up each cluster have different positions in their sub-networks. In absolute terms, Fig. 6. Statistical-planning units in Hungary – Counties and regions
Fig. 7. Intercity clusters identified by the strongest ties across cities.
large cities (e.g. county seats) are responsi- ble for the majority of links in the network.
However, when controlling for their size, a different pattern emerges, and in many cases the strongest relative connections are to be found between smaller cities.
The presence of strong or weak external ties could also be linked to the economic develop- ment of cities. Left part of Figure 8 shows a sig- nificant linear relationship between city-to-city weighted connections and income per capita (r[345] = 0.60, p < 0.001). Similar pattern could be observed for the 13 intercity network clus- ters. The three clusters (No. 5, 6 and 13) that occupy the central region of Hungary have the highest level of income with larger LLR weights indicating stronger external connec- tions. At the opposite end of the plot, we find the majority of clusters (No. 8, 9, 10, 11 and 12) that represent the eastern part of Hungary with weaker average (weighted) intercity con- nections that also implies low average clus- ter-level incomes (Figure 8, right). We might conclude that cities having strong and exten- sive connections to other cities tend to have more wealthy inhabitants. On the contrary, cities that are weakly integrated with their close neighbourhoods and have less intense connections to farther cities (we might call it city-level bridging social capital) have lower levels of income. Furthermore, these pat- terns seem to be valid for networks of cities (Figure 8, right).
Discussion – Building a multidimensional explanatory model
The overall aim of our paper is to find con- nections between city-level measures of online social network indicators, patterns of mobile communication and the level of income. To understand the relationship among these fac- tors we applied a hierarchical multi-nominal regression model where the dependent varia- ble is the city-level average income per capita.
(Due to its size and other characteristics, Buda- pest was excluded from the analysis.) The first two models include social network and mobile communication variables separately. Their joint effect and control variables are incorpo- rated to the remaining two models (Table 3).
Results of Model 1 show that intercity and intracity social network characteristics are in strong connection with the average level of in- come. Intracity fragmentation of networks, to- gether with the two indicators measuring the strength of intercity connections and their av- erage distances explain 44 per cent (R2 = 0.440, F[3,340] = 88.89, p < 0.01) of the dependent var- iables’ variance. Beta coefficients indicate that higher levels of fragmentation and stronger intercity network ties are positively correlated with the level of income, while the average relative distance of intercity ties is negatively correlated with it. Certainly, the size of the set- tlement might be a confounding factor that is included in the final complex model.
Fig. 8. Average income per capita and city-to-city connections in cities (left) and clusters (right)
Table 3. Regression results using income per capita as the criterion Predictorbeta beta 95% CI [LL, UL]
sr2sr2
95% CI [LL, UL]
rFitDifference Model 1
Fragmentation Avg LLR weight Avg Relative Distance 0.32** 0.59** -0.21**
[0.24, 0.41] [0.49, 0.68] [-0.30, -0.11]
0.10 0.25 0.03 [0.05, 0.15] [0.17, 0.32] [0.00, 0.06]
– – –
– R2 = 0.440** 95% CI[0.36, 0.50]
– – –
Model 2 Events per capita Events per equipment ’Apple index’
-0.21** 0.23** 0.82**
[-0.30, -0.11] [0.14, 0.31] [0.73, 0.91]
0.03 0.04 0.46 [0.00, 0.05] [0.01, 0.07] [0.39, 0.54]
0.18** -0.06 0.68**
– R2 = 0.512** 95% CI[0.44, 0.57]
– ΔR2 = 0.072 95% CI[0.03, 0.11] Model 3
Fragmentation Avg LLR weight Avg Relative Distance Events per capita Events per equipment ’Apple index’
0.15** 0.25** -0.04 -0.16** 0.14** 0.58**
[0.07, 0.24] [0.14, 0.37] [-0.14, 0.06] [-0.25, -0.07] [0.05, 0.24] [0.46, 0.70]
0.02 0.03 0.00 0.02 0.01 0.12 [-0.00, 0.04] [0.00, 0.05] [-0.00, 0.01] [-0.00, 0.03] [-0.00, 0.03] [0.07, 0.17]
0.43** 0.55** 0.10 0.18** -0.06 0.68**
– – – – R2 = 0.560** 95% CI[0.49, 0.61]
– – – –
ΔR2 = 0.048** 95% CI[0.02, 0.08] Model 4
Fragmentation Avg LLR weight Avg Relative Distance Events per capita Events per equipment ’Apple index’ Population Distance from Budapest E-W distance from Szentgotthárd 0.16** 0.23** -0.13* -0.14** 0.16** 0.36** 0.12** -0.26** -0.12**
[0.08, 0.24] [0.12, 0.34] [-0.22, -0.03] [-0.23, -0.05] [0.07, 0.25] [0.23, 0.49] [0.04, 0.20] [-0.35, -0.17] [-0.20, -0.03]
0.02 0.02 0.01 0.01 0.01 0.04 0.01 0.04 0.01 [0.00, 0.04] [0.00, 0.04] [-0.00, 0.02] [-0.00, 0.02] [-0.00, 0.03] [0.01, 0.06] [-0.00, 0.02] [0.01, 0.06] [-0.00, 0.02]
0.43** 0.55** 0.10 0.18** -0.06 0.68** 0.28** -0.58** -0.36**
– – – – – – – R2 = 0.618** 95% CI[0.55, 0.66]
– – – – – – –
ΔR2 = 0.058** 95% CI[0.03, 0.09] Note: beta indicates the standardized regression weights; sr2 represents the semi-partial correlation squared; r represents the zero-order correlation. LL and UL indicate the lower and upper limits of a confidence interval, respectively. *p < 0.05, ** p < 0.01.
Model 2 (R2 = 0.512, F[3,340] = 118.9, p < 0.01) includes indicators that capture the mobile communication patterns. Events per capita and events per equipment have medium size ef- fects while the ‘Apple index’ seems to be a very strong predictor of average city-level income.
Events per capita has small but negative, and events per equipment has small but positive coefficients. This indicates that more devices per capita do not necessarily mean higher in- come, but the generally higher frequency of device use, and the presence of more Apple devices result in higher average income levels.
Model 3 (R2 = 0.560, F[6,337] = 71.4, p < 0.01) is an intermediary step and it includes vari- ables from both Model 1 and 2.
In Model 4 we introduced three control var- iables: population, distance from Budapest, and distance from the most Western city of the country (Szentgotthárd). The last two in- dicators are intended to measure the core-pe- riphery and East–West relations of the coun- try, therefore, we control for the most basic patterns of spatial inequalities in the country.
The overall fit of this complex model 62 per cent which could be considered as quite high (R2 = 0.618, F[9,334] = 61.93, p < 0.01), and ba- sic assumptions that relate to the residuals are met. (See Figure 9 for the distribution of studentized residuals, Q-Q plot of observed against theoretical values and a scatterplot of studentized residuals against predicted values.) The results show that both social
network indicators and measures of mobile communication are significantly predicting the average city-level income in Hungary.
The results of the above model indicate that both the characteristics of the settlement- level online social networks (as proxy for
‘real’ social network connections) and vari- ous measures of mobile communication pat- terns are in strong connection to the wealth of cities in Hungary. Echoing the findings of Jackson, O.M. (2008), Kadushin, C. (2012), and Helsley, R.W. and Zenou, Y. (2014) higher level of embeddedness to the network of other cities seems to be a particularly im- portant explanatory variable for economic development. However, not only the exten- sion of the social network, but the intensity of communication and the type of devices used for communication also matter. The results of the model and our preliminary descrip- tive analysis show that the penetration of de- vices both spatially and socially has reached a level of saturation. The possibility of mobile communication is almost evenly accessible throughout the country. On the contrary, our results are in line with previous findings of Eagle, N. et al. (2010) and Mao, H. et al.
(2013) that it is not the number of devices but the frequency of using them is that plays an important role in explaining the local level of income. In simple terms and empirically proving the common sense: sustained use of expensive devices are clear indicators of
Fig. 9. Analysis of studentized residuals and fitted values of the final model (Model 4)
wealth. The interconnection of these factors also holds when controlling for the basic in- herencies for spatial inequalities in Hungary.
Conclusions
Communication networks follow divergent spatial patterns in Hungary. The traditional East–West dichotomy of the Hungarian ter- ritorial system still seems to be reflected in ICT use in Hungary, however, there is growing spatial concentration that results in the weakening of the traditional West to East incline which is more and more re- placed by the distance from Budapest and to a lesser extent from the regional centres.
These trends can be explained by the grow- ing importance of Budapest and its agglom- eration in the Hungarian creative economy, and the metropolitan region of Budapest is the central hub for the development of the ICT sector (Egedy, T. et al. 2018). Our results fit with the mainstream research findings (e.g. Raschke, M. et al. 2014; Schläpfer, M.
et al. 2014) that the settlement hierarchy has great impact on the diffusion of ICT and the use of mobile devices.
There are significant differences between the different generations in the type of device across all categories of the settlement hier- archy (smartphone predominance in gen- eration Z). Within each generation, the main difference between settlement categories is in communication activity (more active mo- bile use in the higher levels of the settlement hierarchy and low activity in the peripheral small settlements).
Our research has further refined previ- ous international findings of Eagle, N.
et al. (2009), Richmond, K. and Triplett, R.E. (2017), and statements of the Digital Dividends Report (2016) in that to some ex- tent the digital divide that exists in the spa- tial structure can be compensated by social conditions. Different mobile device usage patterns of ‘generation Z’ could dampen the social and economic tensions created by the digital divide in the long run.
The second set of analysis focusing on in- tercity network did not unfold East–West dichotomy: clusters are usually aligned to the borders of administrative structures. In several cases we were able to identify strong intercity links between settlements with simi- lar level of economic development of the me- solevel spatial structure that traverse over different counties and regional borders. Our research has successfully contributed to pre- vious research of Onnela, J.-P. et al. (2007) and Blondel, V.D. et al. (2015) on the role and characteristics of social networks.
We also suggest from the results of the net- work analysis that signs of disintegration can be observed in the traditional administrative spatial structure: new sub-networks of nodes and links are emerging that are independ- ent from the trajectories of the administra- tive spatial divides of past and present. Our results corroborate the theory of Tranos, E.
et al. (2013) emphasizing the emergence of new hubs in city structures in digital networks and the growing importance of second-tier cities.
This process is particularly marked in the western and north-western and northern and north-eastern part of the country, respectively.
According to Tóth, G. et al. (2021) social network cluster borders are not only follow- ing administrative boundaries. The virtual structure of space is also affected by natu- ral geography (e.g. Lake Balaton, the river Danube, Bükk Mountains in the north-east).
These constitute strong natural barriers that also have a clear impact in the virtual space.
Based on our online social network data, the emergence of intercity networks cannot be separated from the physical space.
Infocommunication technologies and virtual networks are playing a key role in the devel- opment of smart cities in the digital age. Our results suggest that economic development is predominantly connected to the level of em- beddedness to intercity networks. The direc- tion of causality is rather twofold here, so it is not the case that dense connections are creat- ing wealth or higher level of wealth leads to more social connections. Here we see a complex interplay of historical trajectories and current
economic and social processes. ICT is active- ly shaping both the geographical and virtual space and therefore transforming the role of physical space and its interpretations. In the case of Hungary, it is mainly in the northern part of the country (both East and West) that digital networks are deviating more significant- ly from the classical administrative territorial structures and where a major transformation of digital patterns is expected in the near future.
The cluster analysis of the digital networks could support re-thinking the traditional spatial structure of Hungary, and also to out- line a new, network-based spatial structure.
However, it needs further fine-tuning with more research using alternative data sources.
Aknowledgements: The research presented in the paper was funded by the National Research, Development, and Innovation Office (NKFIH) Grant Agreement No. K128717 and the Artificial Intelligence National Laboratory Program. Special thanks to Richárd Tomka for the scientific assistance in the preparation of the originally submitted manuscript.
REFERENCES
Ahas, R., Aasa, A., Mark, Ü., Pae, T. and Kull, T. 2006.
Seasonal tourism spaces in Estonia: Case study with mobile positioning data. Tourism Management 28. (3): 898–910.
Alias, N.A. 2013. ICT Development for Social and Rural Connectedness. New York, Springer.
Audirac, I. 2005. Information technology and urban form: Challenges to smart growth. International Regional Science Review 28. 119–145.
Bailey, M., Cao, R., Kuchler, T., Stroebel, J. and Wong, A. 2018. Social connectedness: Measurement, determinants, and effects. Journal of Economic Perspectives 32. (3): 259–280.
Becker, R.A., Caceres, R., Hanson, K., Loh, J.M., Urbanek, S., Varshavsky, A. and Volinsky, C. 2011.
A tale of one city: Using cellular network data for urban planning. Pervasive Computing 10. (4): 18–26.
Blondel, V.D., Guillaume, J.-L., Lambiotte, R. and Lefebvre, E. 2008. Fast unfolding of communities in large networks. Journal of Statistical Mechanics:
Theory and Experiment 2008(10), P10008. Available at https://doi.org/10.1088/1742-5468/2008/10/P10008 Blondel, V.D., Krings, G. and Thomas, I. 2010.
Regions and borders of mobile telephony in Belgium and around Brussels. Brussel Studies 42.
Available at https://perso.uclouvain.be/gautier.
krings/docs/EN_129_BruS42EN.pdf
Blondel, V.D., Decuyper, A. and Krings, G. 2015. A survey of results on mobile phone datasets analy- sis. EPJ Data Science 4. 10. Available at https://doi.
org/10.1140/epjds/s13688-015-0046-0
Blumenstock, J., Cadamuro, G. and On, R. 2015.
Predicting poverty and wealth from mobile phone metadata. Science 350. (6264): 1073–1076. Doi:
10.1126/science.aac4420.
Cairncross, F. 2001. The Death of Distance: How the Communications Revolution is Changing our Lives.
Boston, Harvard Business Press.
Calabrese, F., Dahlem, D., Gerber, A., Paul, D., Xiaoji, C., Rowland, J., Rath, C. and Ratti, C. 2011a.
The connected states of America: Quantifying so- cial radii of influence. In Privacy, Security, Risk and Trust. IEEE Third International Conference on Socia Computing, 9–11. October, 2011. Boston.
SocialCom’11. Conference Proceedings, 223–230.
Calabrese, F., Smoreda, Z., Blondel, V.D. and Ratti, C. 2011b. Interplay between telecommunications and face-to- face interactions: A study using mobile phone data. PLoS ONE 6. (7): e20814. Available at https://doi.org/10.1371/journal.pone.0020814 Calabrese, F., Ferrari, L. and Blondel, V.D. 2014.
Urban sensing using Mobile phone network data:
A survey of research. ACM Computing Surveys 47.
(2): 1–20.
Ciuccarelli, P., Lupi, G. and Simeone, L. 2014. Visualizing the Data City: Social Media as a Source of Knowledge for Urban Planning and Management. Springer Science- Business Media.
Csáji, B.C., Browet, A., Traag, V.A., Delvenne, J.C., Huens, E., van Dooren, P., Smoreda, Z. and Blondel, V.D. 2012. Exploring the mobility of mobile phone us- ers. Physica A: Statistical Mechanics and its Applications 392. (6): 1459–1473.
Deville, P., Linard, C., Martin, S., Gilbert, M., Stevens, F.R., Gaughan, A.E. and Tatem, A.J. 2014. Dynamic population mapping using mobile phone data. PNAS Proceedings of the National Academy of Sciences of the United States of America. 111. (45): 15888–15893.
Dusek, T., Lukács, R. and Rácz, I. 2014. Development differences among the regions of Hungary. Procedia Economics and Finance 9. 264–277.
Eagle, N., de Montjoye, Y. and Bettencourt, L.M.
2009. Community computing: Comparisons between rural and urban societies using mobile phone data.
In Procedings of the 12th Computational Science and Engineering International Conference, 29–31. August, 2009 Vancouver, CDN, CSE ‘09, 144–150.
Eagle, N., Macy, M. and Claxton, R 2010. Network diversity and economic development. Science 328.
(5981): 1029–1031.
EC 2014. Feasibility study on the use of mobile posi- tioning data for tourism statistics consolidated report.
Eurostat Contract No 30501.2012.001-2012.452.
Available at https://ec.europa.eu/eurostat/docu- ments/747990/6225717/MP-Consolidated-report.pdf Egedy, T., Kovács, Z. and Szabó, B. 2018. Changing ge- ography of the creative economy in Hungary at the beginning of the 21st century. Hungarian Geographical Bulletin 67. (3): 275–291.
Firmino, R.J., Aurigi, A. and Camargo, A.R. 2006.
Urban and technological developments why is it so hard to integrate ICTs into the planning agenda?
Vienna, CORP 2006. Geomultimedia 06. 143–152.
Frias-Martinez, V., Soguero-Ruiz, C., Frias- Martinez, E. and Josephidou, M. 2013. Forecasting socioeconomic trends with cell phone records. Paper to the Proceedings of the 3rd ACM Symposium on Computing for Development. Article No. 15. New York, ACM.
Gillespie, A. and Williams, H. 1988. Telecommuni- cations and the reconstruction of regional compar- ative advantage. Environment and Planning A, 20.
1311–1321.
Gonzalez, M., Hidalgo, C. and Barabási, A.-L. 2008.
Understanding individual human mobility patterns.
Nature 453. (7196): 779–782.
Graham, S. 1998. The end of geography or the ex- plosion of place? Conceptualizing space, place and information technology. Progress in Human Geography 22. 165–185.
Graham, S. and Marvin, S. 2002. Telecommunications and the City: Electronic Spaces, Urban Places. London, Routledge.
Granovetter, M. 1985. Economic action and social structure: The problem of embeddedness. American Journal of Sociology 91. (3): 481–510.
Gregersen, F.A. and Lunke, E.B. 2018. The Application of Cellular Network Data for Travel Behavior Research.
Oslo, Institute of Transport Economics, Norwegian Center for Transport Research.
Győri, R. and Mikle, G. 2017. A fejlettség területi különbségeinek változása Magyarországon, 1910–
2011 (Transformation of regional development dis- parities in Hungary, 1910–2011). Tér és Társadalom 31. (3): 143–165.
He, Y., Yu, F.R., Zhao, N., Yin, H., Yao, H. and Qiu, R.C. 2016. Big Data Analytics in Mobile Cellular Networks. IEEE Access 4. 1985–1996.
Helsley, R.W. and Zenou, Y. 2014 Social networks and interactions in cities. Journal of Economic Theory 150. 426–466.
Hernandez, M., Hong, L., Frias-Martinez, V., Whitby, A. and Frias-Martinez, E. 2017. Estimating Poverty Using Cell Phone Data. Evidence from Guatemala.
Policy Research Working Paper 7969, World Bank Group, Macroeconomics and Fiscal Management Global Practice Group. Available at https://openk- nowledge.worldbank.org/handle/10986/26136 Iammarino, S. and McCann, P. 2013. Multinationals
and Economic Geography: Location and Technology, Innovation. Cheltenham, Edward Elgar Publishing.
Jackson, O.M. 2008. Social and Economic Networks.
Princeton–Oxford, Princeton University Press.
Jakobi, Á. 2013. Space and virtuality: New characteristics of inequalities in the information society and econo- my. Review of Applied Socio-Economic Research 5. 4–14.
Jakobi, Á. 2017. Proximity-driven motives in the evolu- tion of an online social network. In The Rise of Big Spatial Data. Lecture notes in geoinformation and cartography. Eds.: Ivan, I., Singleton, A., Horák, J.
and Inspector, T., Springer Verlag, Doi 10.1007/978- 3-319-45123-7_15
Järv, O., Ahas, R. and Witlox, F. 2014. Understanding monthly variability in human activity spaces: A twelve-month study using mobile phone call detail records. Transportation Research Part C: Emerging Technologies 38. 122–135.
Kadushin, C. 2012. Understanding Social Networks – Theories, Concepts and Findings. New York, Oxford University Press.
Lambiotte, R., Blondel, V., de Kerchove, C., Huens, E., Prieur, C., Smoreda, Z. and Dororen, P.V. 2008.
Geographical dispersal of mobile communication networks. Physica A: Statistical Mechanics and its Applications 387. 5317–5325.
Lengyel, B., Varga, A., Ságvári, B., Jakobi, Á. and Kertész, J. 2015. Geographies of an online social net- work. PLoS ONE 10. (9): e0137248. Available at https://
doi.org/10.1371/journal.pone.0137248
Long-Scott, A. 1995. Access denied? – Outlook 8. (1):
1–13.
Mao, H., Shuai, X., Ahn, Y.Y. and Bollen, J. 2013. Mobile communications reveal the regional economy in Côte d’Ivoire. Mobile phone data for development – analysis of mobile phone datasets for the development of Ivory Coast. Orange D4D challenge. 4. 17–34.
McPherson, M., Smith-Lovin, L. and Cook, J.M. 2001.
Birds of a feather: homophily in social networks.
Annual Review Sociology 27. 415–444.
More, J. and Lingam, C. 2013. Current trends in reality mining. IRJES 22. (2): 35–39.
Nemes Nagy, J. and Tagai, G. 2011. Regional inequalities and the determination of spatial structure. Regional Statistics 1. Special Issue, 15–28.
Norbutas, L. and Corten, R. 2018. Network structure and economic prosperity in municipalities: A large- scale test of social capital theory using social media data. Social Networks 52. 120–134.
Novák, J., Ahas, R., Aasa, A. and Silm, S. 2013.
Application of mobile phone location data in mapping of commuting patterns and functional regionalization:
a pilot study of Estonia. Journal of Maps 9. (1): 10–15.
Onnela, J.-P., Saramäki, J., Hyvonen, J., Szabo, G., Lazer, D., Kaski, K., Kertesz, J. and Barabási, A.L.
2007. Structure and tie strengths in mobile commu- nication networks. PNAS Proceedings of the National Academy of Sciences of the United States of America 104.
(18): 7332–7336. Available at https://doi.org/10.1073/
pnas.0610245104


![Table 3. Regression results using income per capita as the criterion Predictorbeta beta 95% CI [LL, UL]](https://thumb-eu.123doks.com/thumbv2/9dokorg/745311.31004/15.701.96.594.101.935/table-regression-results-using-income-capita-criterion-predictorbeta.webp)

