A predictive control for autonomous vehicles using big data analysis
D´aniel F´enyes∗,Bal´azs N´emeth∗∗,P´eter G´asp´ar∗∗
∗ Department of Control for Transportation and Vehicle Systems, Budapest University of Technology and Economics, Stoczek u. 2,
H-1111 Budapest, Hungary.
E-mail: fenyes.daniel@mail.bme.hu
∗∗ Institute for Computer Science and Control, Hungarian Academy of Sciences, Kende u. 13-17, H-1111 Budapest, Hungary.
E-mail: [balazs.nemeth;peter.gaspar]@sztaki.mta.hu
Abstract: Big data analysis has an increasing importance in the field of the autonomous vehicles. It is related to vehicular networks and individual control. The paper proposes the improvement of a lateral autonomous vehicle control design through big data analysis on the measured signals. Based on the data a decision tree is generated by using the C4.5 and the MetaCost algorithms. It results in the regions of vehicle dynamic states and guarantees the tracking of the autonomous vehicle. The lateral control problem is formed in an MPC (Model Predictive Control) structure, in which the results of the big data analysis are built as constraints. The efficiency of the proposed method is illustrated through a comparative simulation example through a high-fidelity vehicle control software.
Keywords: autonomous vehicle control, big data analysis, MPC control design, decision tree 1. INTRODUCTION AND MOTIVATION
A recent technology in intelligent transportation systems and autonomous vehicles is the processing of big data information. Both semi-autonomous and autonomous ve- hicle systems apply several on-board sensors of vehicle motion dynamics through their enhanced sensor networks, while they also require various signals from the road and traffic environments. It is predicted that the autonomous vehicle can generate over 1 Terabyte data per hour, see e.g. Xu et al. [2018]. However, the storage and processing of big data is a future technological challenge, see Daniel et al. [2017], Sherif et al. [2017]. Numerous measured data concerning autonomous vehicles are used for different pur- poses in driverless vehicles and intelligent traffic control.
One of the most important applications of big data is the coordination of autonomous vehicles in vehicular networks.
? The research reported in this paper was supported by the Higher Education Excellence Program of the Ministry of Human Capacities in the frame of Artificial Intelligence research area of Budapest University of Technology and Economics (BME FIKPMI/FM).
The research was supported by the Hungarian Government and co- financed by the European Social Fund through the project ”Talent management in autonomous vehicle control technologies” (EFOP- 3.6.3-VEKOP-16-2017-00001).
The work of Bal´azs N´emeth was partially supported by the J´anos Bolyai Research Scholarship of the Hungarian Academy of Sciences and the ´UNKP-18-4 New National Excellence Program of the Min- istry of Human Capacities.
The work of D´aniel F´enyes was partially supported by the ´UNKP- 18-3 New National Excellence Program of the Ministry of Human Capacities.
Cheng et al. [2018] reviewed the relationship between ve- hicle ad-hoc networks and big data, and the enhancement of the communication in the network through machine learning schemes was presented. Lin et al. [2017] proposed a social-based localization algorithm that used location prediction to assist in global localization in vehicular networks. Amini et al. [2017] proposed a comprehensive and flexible architecture based on a distributed computing platform for real-time traffic control. The architecture was based on a systematic analysis of the requirements of the existing traffic control systems. Traffic flow prediction using a deep-learning algorithm was presented in Lv et al.
[2015]. In that research a deep architecture model was applied using autoencoders as building blocks to represent traffic flow features for prediction. Similarly, Lasso regres- sion on big data was used for traffic flow prediction in Li et al. [2015]. Cell phone information-based big data analy- sis and control for transportation purposes were proposed in Dong et al. [2015].
Another important field of big data is its usage in indi- vidual autonomous vehicle control systems. First, it can be used for prediction and estimation purposes. Big data provides large amount of relevant information about the environment to improve perception as found in Xu et al.
[2018]. Moreover, big data have been used in the predic- tion of vehicle slip through the combination of individual measurements of the vehicle and database information, see Jeon et al. [2015], F´enyes et al. [2018a]. Lee and Wu [2015]
utilized data-mining algorithms to process electric vehicle battery data for energy-consumption and driving range purposes. Secondly, big data can be the part of the control
strategy. An optimal trajectory selection strategy focusing on the safety of the autonomous vehicles using cloud database was proposed by Najada and Mahgoub [2016].
Zhu et al. [2016] presented the idea of the path planning strategy of public vehicle systems which use traffic data.
The processing of the measured signals was also used to approximate the lateral stability domain of the vehicles, see some preliminary results in F´enyes et al. [2018b]. Al- though several results about the application of big data in the autonomous vehicles and vehicular networks have been proposed in the literature, the possible benefits of big data are not thoroughly utilized in the field of vehicle control design.
The contribution of the paper is the improvement of lat- eral autonomous vehicle control design through vehicle dynamic constraints from the big data analysis on the mea- sured signals. The control problem is formed in a Model Predictive Control (MPC) structure, which must guar- antee the path tracking of the autonomous vehicle. The motivation for MPC formulation is its flexible structure in the lateral vehicle control design. Although MPC has some weaknesses, it provides a systematic design procedure and the constraints can easily be incorporated as it is sum- marized in Dixit et al. [2018]. The numerous measured signals (e.g. acceleration, velocity, GPS position, heading angle, route information etc.) result in big data, which are processed through the C4.5 machine learning algorithm to generate a decision tree. The tree provides information about the regions of vehicle dynamic states, in which the performance of path tracking is acceptable. The advantage of the proposed method is that, although it is difficult to determine these regions analytically, the big data analysis provides an approximation of them. The resulting regions from the decision tree analysis are incorporated in the MPC control as constraints.
The structure of the paper is the following. Section 2 presents the method of data collection and a brief intro- duction of C4.5 and MetaCost algorithms. These meth- ods yield decision trees, whose incorporation in the MPC design is proposed in Section 3. Section 4 illustrates the application of the control method on a lateral autonomous vehicle control problem, in which the efficiency of the im- provement in a comparative study is highlighted. Finally, the contributions of the paper and the further challenges are summarized in Section 5.
2. DESCRIPTION OF BIG DATA ANALYSIS In this section the method of big data analysis is presented, which yields a decision tree based on collected data.
The data is provided by the sensors of the autonomous vehicles, such as inertial and gyro sensors, GPS velocity measurement and wheel speed sensors. Moreover, the big data analysis contains scenarios which are considered to be acceptable or unacceptable from the viewpoint of the path tracking of the autonomous vehicle. These scenarios are called good or bad instances in the dataset. The purpose of the decision tree generation is to find the set of relations with which the a current scenario can be classified as acceptable or unacceptable.
Each scenario requires a definition of a criterion to be acceptable. However, the path tracking scenarios demon-
strate that it is difficult to find an appropriate criterion.
For example, if the vehicle reaches an unstable state, the error in path tracking increases significantly. The criterion of acceptability cannot be clearly identified as a stability issue, as it is illustrated by the following counterexamples.
• It is difficult to determine the instability of the ve- hicle. Due to the nonlinearities in the lateral vehicle models the stability regions are generally computed on constant longitudinal velocities, see e.g. Sadri and Wu [2013], Masouleh and Limebeer [2018]. However, sometimes the instability of the vehicle leads to a significant reduction in the velocity, at which the sta- bility of the vehicle is restored. Thus, if the stability of the vehicle is evaluated depending on the velocity, the scenario is only locally unstable, but globally stable.
• Moreover, the increasing error in the path tracking of the autonomous vehicle is caused by deficiencies in the lateral control. In this case the error can be handled as a performance problem, not a stability issue. However, it may also depend on the designed controller, not only on the vehicle itself.
These examples illustrate that it may be difficult to find an appropriate criterion to evaluate the acceptability of the path tracking in a given database. The approach of this paper is based on the idea that the motion of the vehicle is generally acceptable for the human passengers in the linear region of the tire force characteristics. In this case the side-slip angle of the axles can provide information about the characteristics of the motion. Thus, the defined criterion expresses the similarity between the current side- slip of the front axle (1 +α1) and the expected side-slip based on the linear formulation of the vehicle (F´enyes et al.
[2018b]):
ithinstance is classified as acceptable if −ε < |1 +α1|
|1 +δ−β−lv1ψ˙
x|
−1≤ε, (1)
Otherwise,ithinstance is unacceptable.
where ε is an experimentally-defined parameter and the side-slip angle of the front wheels in the linear modeling of the vehicle is approximated asα1=δ−β−lv1ψ˙
x, where δis the steering angle,l1is the distance between the front wheels and the vehicle center of gravity, ˙ψ denotes the yaw-rate, β is the side-slip angle of the vehicle andvx is the longitudinal velocity. Based on experience the criteria (1) provide a suitable evaluation of the vehicle motion regarding to the path tracking. However, the definition of a more accurate vehicle dynamic criterion is a challenge in the application of big data analysis.
Generation of the decision tree
The result of the data collection and the evaluation based on (1) is a data setS, which is used for the generation of the decision treeT. The inputs of the decision tree are the longitudinal speed, the yaw-rate angle, the side-slip angle of the vehicle and the adhesion coefficient of the road (µ), while the output is the result of the classification. In this paper the generation is based on the C4.5 machine learning algorithm, whose result is improved through the MetaCost technique.
The C4.5 decision tree algorithm is one of the most widely- used machine learning classifiers. The original algorithm was proposed by Hunt [1962]. Just as other machine learning algorithms, the C4.5 requires two sets of data:
a training set and a test set. The training set is based on the collected data set, and it is used for building the decision tree, while the test set is used for the evaluation.
The purpose of the C4.5 algorithm is to create a set of rules (decision tree), by which the instances can be correctly classified according to the selected dependent (class) attribute. A decision tree consists of leaves, nodes and branches. A node is associated with a condition (e.g.
current value of an attribute is smaller/bigger than a given value). A branch is the outcome of a node (the condition is satisfied or not) and leads to another node or to a leaf.
Finally, a leaf determines the class of the instance.
Briefly, the C4.5 algorithm works in the following way:
• LetSdenote the training set, which contains all of the measured attributes. The disorder (or uncertainty) of the dataset can be expressed as the entropy of the data. The entropy of the set is calculated as:
E(S) =
n
X
i=1
Pilog2Pi, (2) wherePi denotes the ratio of the instances classified as classiandnis the number of the classes.
• The C4.5 algorithm tries to minimize the entropy of each subset, which is created from the original dataset. The entropy difference between the new subsets and the original set is called gain information and can be calculated as:
G(S, A) =E(S)−
k
X
i=1
|Si|
|S|
E(Si), (3) whereAis the chosen attribute andSiare the created subsets andkis the number of the subsets.
• Moreover, the method calculates the entropy of all created subsets, related to the number of instances in subsets. It is called split information and it can be determined as
SI(S, A) =−
k
X
i=1
|Si|
|S|log2
|Si|
|S|
. (4)
• Finally, the optimization problem is to maximize the ratio of the gain information and the split information
max
G(S, A) SI(S, A)
. (5)
The result of the optimization is the decision tree T. The background of the applied machine learning methods and the detailed description of the C4.5 are in Quinlan [1993].
The evaluation of the decision tree is an important step of the generation procedure. Several methods have been developed for this task, e.g. MetaCost algorithm (Domin- gos [1999]), Stratification, or Decision Trees with Minimal Costs (Ling et al. [2004]). The main advantage of the selected MetaCost algorithm is that it does not require a specified classifier, it can work with any classifier. The evaluation of T can be performed through various mea- sures, e.g. precision, recall, accuracy, f-measure etc. These measures use slightly different aspects to determine the
acceptability of the produced tree. Nonetheless, the easiest way to evaluate a decision tree is the examination of its confusion matrix. The confusion matrix summarizes the correctly and incorrectly classified instances of the test set.
Finally, the C4.5 and the MetaCost algorithms yield an iterative tree generation method, in which the MetaCost algorithm incorporates the C4.5 algorithm. The core of the method is to solve the optimization problem, which minimizes the misclassified instances
min
X
j
P(j|x)C(k, j)
. (6)
P(j|x) represents the probabilities of the classes through T, which are the elements of the confusion matrix
P(j|x) = 1 P
i
1 X
i
P(j|x, T), (7) where x is a given instance and j is the given class. In (6)P(j|x) are weighted through the cost matrixC, which guarantees the minimization of the misclassified instances.
3. PREDICTIVE CONTROL DESIGN USING DECISION TREES
In this section the lateral control design of the autonomous vehicle for a path tracking is presented. During the design the MPC structure is used, in which the result of the decision tree through the constraints is incorporated. The designed controller must adapt to the varying parameters, such as the adhesion coefficient and longitudinal velocity.
The control design is based on the lateral dynamics of the vehicle, which consists of three equations:
mvx( ˙ψ+ ˙β) =C1α1+C2α2, (8a) Jψ¨=C1α1l1−C2α2l2, (8b)
˙
vy =vx( ˙ψ+ ˙β), (8c) where J is the yaw inertia, m is the mass of the vehicle Ci represents cornering stiffness on the front and the rear axles and li is the distance between vehicle center of gravity and the wheels andα1=δ−β−ψl˙ 1/vxandα2= β+ ˙ψl2/vxare the tire side-slip angles. The lateral velocity of the vehicle is vy, from which the lateral displacement y can be computed. The equations can be transformed into a state space representation, whose state vector is x=
β ψ v˙ y yT
and the state-space representation is
˙
x=Ax+Bu, (9)
whereuis the steering angle.
The MPC control design requires a discrete-time model of the continuous system, therefore the presented state-space representation is discretized using the sampling time Ts. The discrete state-space representation is:
x(k+ 1) =φx(k) + Γu(k), (10) where φ = eATs and Γ =
(k+1)Ts
R
kTs
eA((K+1)Ts−τ)Bdτ. The motion of the vehicle is predicted fornsteps ahead of the vehicle. Using (10) the prediction is proposed as
ypred(k, n) =
y(k+ 1) y(k+ 2)
... y(k+n)
=
0 0 0 1
T
φ φ2
... φn
x(k)+ (11)
+
0 0 0 1
T
Γ 0 · · · 0 φΓ Γ · · · 0 ... . .. . .. ... φn−1Γ φΓ · · · Γ
u(k) u(k+ 1)
... u(k+n−1)
.
The purpose of the path tracking of the vehicle is the minimization of the tracking errorey, which is defined as ey(k, n) =yref(k, n)−ypred(k, n), (12) where the reference lateral position of the vehicle on the route ahead yref(k, n) is defined by the road geometry.
The minimization of the tracking error can be guaranteed by a cost function
J= 1
2ey(k, n)TQey(k, n) +U(k, n)TRU(k, n), (13) where U(k, n) = [u(k) . . . u(k+n−1)]T. Moreover, Q and Rare weighting matrices, which guarantee a balance between lateral error minimization and control actuation.
Using (11) and (12) the cost function can be transformed to
J =U(k, n)TσU(k, n) +νTU(k, n), (14) where σandν are matrices. The core of the MPC design problem is to find a solution on the quadratic optimization task
min
U(k,n)U(k, n)TσU(k, n) +νTU(k, n). (15) The computed solution U(k, n) of (15) guarantees the balance between the tracking error and the value of the steering angle. However, it is possible that the resulting vehicle motion is not acceptable from the viewpoint of human passengers. Therefore, the design procedure is improved through the consideration of the decision tree.
In the relationships in the decision tree the acceptability of the control input can be guaranteed.
The set of acceptable states in the MPC design through the limitation of control input are incorporated. It is defined the upperUmaxand lowerUminlimits on the control input sequenceU(k, n) such as
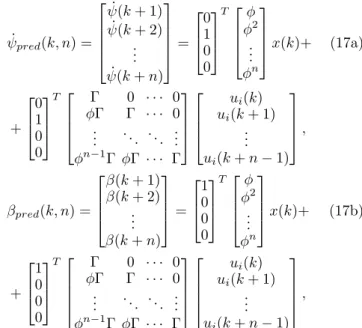
Umax= [umax. . . umax]T, Umin = [umin. . . umin]T, (16a) and the sizes of both vectors are n−1×1. The upper and lower limits must guarantee that the yaw rate and the side-slip angle of the vehicle are inside ofRgoodon the horizon n ahead. The prediction of ˙ψ(k+ 1). . .ψ(k˙ +n) andβ(k+ 1). . . β(k+n) are computed as
ψ˙pred(k, n) =
ψ(k˙ + 1) ψ(k˙ + 2)
... ψ(k˙ +n)
=
0 1 0 0
T
φ φ2
... φn
x(k)+ (17a)
+
0 1 0 0
T
Γ 0 · · · 0 φΓ Γ · · · 0 ... . .. . .. ... φn−1Γ φΓ · · · Γ
ui(k) ui(k+ 1)
... ui(k+n−1)
,
βpred(k, n) =
β(k+ 1) β(k+ 2)
... β(k+n)
=
1 0 0 0
T
φ φ2
... φn
x(k)+ (17b)
+
1 0 0 0
T
Γ 0 · · · 0 φΓ Γ · · · 0 ... . .. . .. ... φn−1Γ φΓ · · · Γ
ui(k) ui(k+ 1)
... ui(k+n−1)
,
whereuirepresentsuminorumax. Moreover, it is necessary to selectuminandumax, so thatRgood contains the entire trajectory:
maxumax s.t. ψ˙pred(k, n), βpred(k, n)∈Rgood, (18a) minumin s.t. ψ˙pred(k, n), βpred(k, n)∈Rgood. (18b) The result of (18a) is formed in a constraint on the control inputU(k, n)
M U(k, n)5H, (19)
where
M = I 0
0 −I
, H =
Umax
−Umin
. (20)
Finally, the improved MPC optimization task is formed using (15) and (19)
min
U(k,n)U(k, n)TσU(k, n) +νTU(k, n) (21a) s.t.
M U(k, n)5H. (21b)
The result of the optimization is U(k, n), and it is nec- essary to actuate u(k) = δ(k) at the time step k of the computation.
4. ILLUSTRATION OF THE PREDICTIVE CONTROL ALGORITHM
The proposed decision tree generation and improved MPC control design methods are presented through a simula- tion example. First, the results of the decision tree are presented, while secondly, the efficiency of the control algorithm is illustrated.
Results of the big data analysis
In this paper the data set for the analysis is provided by the high-fidelity car simulator CarSim. Through this software the required data can be collected, as detailed below.
(1) At the initial step, it is necessary to define the vehicle dynamic environment of the simulation. It is neces- sary to follow the path under various circumstances,
in which the yaw rate can vary between 0.1−0.5rad/s, vx = 10. . .130km/h and the adhesion coefficient is between 0.1 and 1. These wide ranges of parameters allow the vehicle to reach even extremely high states.
(2) Furthermore, it is necessary to design a lateral path following controller, by which the selected route can be performed. For data collection the conventional MPC design is used, see (15).
(3) In the simulations the following parameters are mea- sured: longitudinal velocity, yaw rate, the side slip of vehicle, the side slip of the wheels and the adhesion coefficient.
In this way, more than 10 million instances have been collected through the CarSim simulation software. The col- lected dataset contains both acceptable and unacceptable instances from the viewpoint of path tracking. E.g., the vehicle may leave the road because of the low adhesion coefficient, which is unacceptable.
The data set S is processed through the C4.5 and Meta- Cost methods, as it is presented in Section 2. In this paper, the machine learning software WEKA is used, in which the algorithm has been implemented, see Witten and Frank [2005]. The parameters of the generated deci- sion trees using the C4.5 can be found in Table 1. The first column in Table 1 shows the minimum number of instances which are contained by a leaf. The second and third columns give the percentage of the correctly classified instances and the percentage of the misclassified ’bad’
(unacceptable) instances. The sizes of the produced trees are in the last column. It can be seen that the trees with more minimum objects have lower accuracy but their sizes are smaller. While the total accuracy (correctly classified instances) of the trees is above 90%, the percentages of the misclassified ’bad’ instances are between 16.69% and 42.63%. The misclassification of the ’bad’ instances can be dangerous from a vehicle dynamic viewpoint, because a scenario with low performance is evaluated as acceptable.
Thus, is it is necessary to minimize the percentage of this kind of misclassification, which is the goal of the MetaCost algorithm.
Table 1. Relationship between the tree size and the object number
Min. Objects Corr. Class. Inst. Misclass. ’bad’ Inst. Size
2 95.5729% 16.69% 4029
20 95.0298% 19.33% 1867
200 93.4067% 28.43% 367
2000 91.6381% 42.63% 39
The MetaCost algorithm uses a cost matrix to determine suitable cost function. In this case, the dataset has only two classes, therefore the cost matrix is formed as
C=
0 Cg
Cb 0
, (22)
where Cb weights the misclassification of ’bad’ instances and Cg weights the misclassification of ’good’ instances.
Since the goal is to reduce the percentage of the misclas- sified ’bad’ instances, Cg is set at 1 and Cb is increased
gradually from 1 to 5. The results of the C4.5 with Meta- Cost algorithm are summarized in Table 2.
Table 2. Relationship between the tree size and the object number
Cb Corr. Class. Inst. Missclass. ’bad’ Inst. Size
1 91.6381% 42.63% 39
2 91.4861% 39.18% 33
3 88.0597% 24.01% 25
4 88.0627% 23.99% 21
5 83.3101% 14.97% 23
In this case the minimum object number is fixed at 2000, since that tree must be reasonable size to be used in the control design. Table 2 shows that the new trees have slightly lower accuracy but their percentages of misclas- sification of the class ’bad’ are significantly improved.
Moreover, the decision trees with higher cost matrix have higher accuracy at the class ’bad’, but their total accuracy decreases. For safety reasons, in the rest of the paper, the decision tree with the lowest misclassification percentage is used.
Results of the MPC design
In the rest of the section a comparative simulation example of the proposed control system is presented. The control system is implemented in CarSim, which works together with the Matlab/Simulink. In the simulation scenarios a mid-size passenger vehicle is selected, whose mass is 2015kg. In the simulations, the car must follow a prede- fined path, which contains various road segments, such as a sharp bend. The friction coefficient between the road and the tires is fixed to 0.5 during the simulations. However, the velocity of the vehicle varies during the maneuver as shown in Figure 4 (a).
0 10 20 30 40 50 60 70 80 90 100
42 44 46 48 50 52 54 56
Time (s) Vx (km/h)
(a) Velocity of the vehicle
720 740 760 780 800 820 840 860 880 900
−420
−410
−400
−390
−380
−370
−360
−350
X (m)
Y (m)
MPC with DT MPC without DT Road
(b) A sharp bend of the path
Fig. 1. Velocity and path of the vehicle
In the example two simulation scenarios are compared. In the first simulation, the car is controlled by the conven- tional MPC controller (15), while in the second simulation the vehicle is driven by the improved MPC control system (21a). It means that in the first simulation example the information about the acceptable states through the deci- sion tree is not considered. Figure 4 (b) shows the paths of the vehicle and the original track. It can be seen that the vehicle which is controlled by the conventional MPC controller is not able to follow the trajectory and its lateral error is above>5m. In contrast, the car controlled by the improved MPC controller accurately follows the path and its lateral error is below<0.5m.
Figure 4 (a) illustrates the actuated steering angles which are computed by the control systems. In the case of the conventional controller, the maximum of the realized steer- ing angle is above |δmax| > 0.3rad, which is close to the physical limit of the steering system. The improved MPC system computes smaller inputs (|δmax|<0.07rad) compared to the previous case. The reason for this ten- dency is that the control input of the extended system is continuously bounded by the constraint which is derived through the current attributes and circumstances.
0 10 20 30 40 50 60 70 80 90 100
−0.3
−0.25
−0.2
−0.15
−0.1
−0.05 0 0.05 0.1
Time (s)
Steering angle (rad)
MPC with DT MPC without DT
(a) Control input (steering angle)
0 10 20 30 40 50 60 70 80 90 100
−0.2
−0.15
−0.1
−0.05 0 0.05 0.1 0.15 0.2
Time (s)
Bounds of steering angle (rad) Upper bound
Lower bound
(b) Upper and lower bounds
Fig. 2. Steering angle and its bounds
The upper and lower bounds of the extended control system are depicted in Figure 4 (b). Except for a time section between 28 − 42s, the variation of the upper and lower bounds are small. However, between 28−42s the lower bound gradually increases, which results in a significant limit for the steering angle, as shown in Figure 4 (b).
5. CONCLUSIONS
The paper has presented a new application of decision trees in autonomous vehicle control design. It presents a big data-based analysis of the autonomous vehicles using the iterative method of the decision tree classifier the C4.5 extended with the cost-sensitive algorithm MetaCost.
Moreover, the resulting decision trees are built into the control system, which is formed in a model predictive structure. As a result of the decision tree generation, the MPC problem is improved by using constraints on the control actuation, which is related to the steering angle on the vehicle. Finally, the efficiency of the proposed control system has been demonstrated through a complex simu- lation example using the CarSim simulation environment.
The comparative simulations show the control input lim- itations, the significant reduction of the lateral error and the steering angle.
REFERENCES
S. Amini, I. Gerostathopoulos, and C. Prehofer. Big data analytics architecture for real-time traffic control. In5th IEEE Int. Conf.
Models and Technologies for Intelligent Transportation Systems, pages 710–715, 2017.
N. Cheng, F. Lyu, J. Chen, W. Xu, H. Zhou, S. Zhang, and X. Shen.
Big data driven vehicular networks. IEEE Network, pages 1–8, 2018.
A. Daniel, K. Subburathinam, A. Paul, N. Rajkumar, and S. Rho.
Big autonomous vehicular data classifications: Towards procuring intelligence in ITS. Vehicular Communications, 9:306–312, July 2017.
S. Dixit, S. Fallah, U. Montanaro, M. Dianati, A. Stevens, F. Mc- Cullough, and A. Mouzakitis. Trajectory planning and tracking for autonomous overtaking state-of-the-art and future prospects.
Annual Reviews in Control, 45:76–86, 2018.
P. Domingos. Metacost: A general method for making classifiers cost- sensitive.5th ACM SIGKDD Int. Cons. Knowledge discovery and data mining, San Diego, pages 155–164, 1999.
H. Dong, M. Wu, X. Ding, L. Chu, L. Jia, Y. Qin, and X. Zhou.
Traffic zone division based on big data from mobile phone base stations.Transportation Research Part C, 58:278–291, 2015.
D. F´enyes, B. N´emeth, M. Asszonyi, and P. G´asp´ar. Side-slip angle estimation of autonomous road vehicles based on big data analysis.
In26th Mediterranean Conference on Control and Automation, pages 849–854, June 2018a.
D. F´enyes, B. N´emeth, and P. G´asp´ar. Analysis of autonomous vehicle dynamics based on the big data approach. InEuropean Control Conference, pages 219–224, June 2018b.
E. B. Hunt.Concept Learning: An information Processing Problem.
Wiley, 1962.
J. Jeon, W. Lee, H. J. Cho, and H. Lee. A big data system design to predict the vehicle slip. In2015 15th International Conference on Control, Automation and Systems (ICCAS), pages 592–596, Oct 2015.
C. H. Lee and C. H. Wu. Collecting and mining big data for electric vehicle systems using battery modeling data. In 2015 12th International Conference on Information Technology - New Generations, pages 626–631, April 2015.
L. Li, X. Su, Y. Wang, Y. Lin, Z. Li, and Y. Li. Robust causal dependence mining in big data network and its application to traffic flow predictions. Transportation Research Part C, 58:292–
307, 2015.
K. Lin, J. Luo, L. Hu, M. S. Hossain, and A. Ghoneim. Localization based on social big data analysis in the vehicular networks.IEEE Transactions on Industrial Informatics, 13(4):1932–1940, Aug 2017.
C.X. Ling, Q. Yang, J. Wang, and S. Zhang. Decision trees with minimal costs. In ICML ’04: Proceedings of the twenty-first international conference on Machine Learning, page 69, 2004.
Y. Lv, Y. Duan, W. Kang, Z. Li, and F. Y. Wang. Traffic flow prediction with big data: A deep learning approach. IEEE Transactions on Intelligent Transportation Systems, 16(2):865–
873, 2015.
M.I. Masouleh and D.J.N. Limebeer. Region of attraction analysis for nonlinear vehicle lateral dynamics using sum-of-squares pro- gramming. Vehicle System Dynamics, 56(7):1118–1138, 2018.
H. A. Najada and I. Mahgoub. Autonomous vehicles safe-optimal trajectory selection based on big data analysis and predefined user preferences. In 7th Annual Ubiquitous Computing, Electronics Mobile Communication Conference, pages 1–6, Oct 2016.
J. R. Quinlan. C4.5: Programs for Machine Learning. Morgan Kaufmann Publishers, San Mateo, California, 1993.
S. Sadri and C. Wu. Stability analysis of a nonlinear vehicle model in plane motion using the concept of lyapunov exponents.Vehicle System Dynamics, 51(6):906–924, 2013.
A. B. T. Sherif, K. Rabieh, M. M. E. A. Mahmoud, and X. Liang.
Privacy-preserving ride sharing scheme for autonomous vehicles in big data era. IEEE Internet of Things Journal, 4(2):611–618, April 2017.
I.H. Witten and E. Frank.Data Mining Practical Machine Learning Tools and Techniques. Morgan Kaufmann Publishers, Elsevier, 2005.
W. Xu, H. Zhou, N. Cheng, F. Lyu, W. Shi, J. Chen, and X. Shen.
Internet of vehicles in big data era. IEEE/CAA Journal of Automatica Sinica, 5(1):19–35, Jan 2018.
M. Zhu, X. Y. Liu, M. Qiu, R. Shen, W. Shu, and M. Y. Wu. Traffic big data based path planning strategy in public vehicle systems. In 24th International Symposium on Quality of Service, pages 1–2, June 2016.