Mycena genomes resolve the evolution of fungal bioluminescence
Huei-Mien Kea,1, Hsin-Han Leea, Chan-Yi Ivy Lina,b, Yu-Ching Liua, Min R. Lua,c, Jo-Wei Allison Hsiehc,d, Chiung-Chih Changa,e, Pei-Hsuan Wuf, Meiyeh Jade Lua, Jeng-Yi Lia, Gaus Shangg, Rita Jui-Hsien Lud,h, László G. Nagyi,j, Pao-Yang Chenc,d, Hsiao-Wei Kaoe, and Isheng Jason Tsaia,c,1
aBiodiversity Research Center, Academia Sinica, Taipei 115, Taiwan;bDepartment of Molecular, Cellular and Developmental Biology, Yale University, New Haven, CT 06520;cGenome and Systems Biology Degree Program, Academia Sinica and National Taiwan University, Taipei 106, Taiwan;dInstitute of Plant and Microbial Biology, Academia Sinica, Taipei 115, Taiwan;eDepartment of Life Sciences, National Chung Hsing University, Taichung 402, Taiwan;fMaster Program for Plant Medicine and Good Agricultural Practice, National Chung Hsing University, Taichung 402, Taiwan;gDepartment of Biotechnology, Ming Chuan University, Taoyuan 333, Taiwan;hDepartment of Medicine, Washington University in St. Louis, St. Louis, MO 63110;iSynthetic and Systems Biology Unit, Biological Research Centre, 6726 Szeged, Hungary; andjDepartment of Plant Anatomy, Institute of Biology, Eötvös Loránd University, Budapest, 1117 Hungary
Edited by Manyuan Long, University of Chicago, Chicago, IL, and accepted by Editorial Board Member W. F. Doolittle October 28, 2020 (received for review May 27, 2020)
Mushroom-forming fungi in the order Agaricales represent an in- dependent origin of bioluminescence in the tree of life; yet the diversity, evolutionary history, and timing of the origin of fungal luciferases remain elusive. We sequenced the genomes and tran- scriptomes of five bonnet mushroom species (Mycenaspp.), a di- verse lineage comprising the majority of bioluminescent fungi.
Two species with haploid genome assemblies∼150 Mb are among the largest in Agaricales, and we found that a variety of repeats between Mycena species were differentially mediated by DNA methylation. We show that bioluminescence evolved in the last common ancestor of mycenoid and the marasmioid clade of Agar- icales and was maintained through at least 160 million years of evolution. Analyses of synteny across genomes of bioluminescent species resolved how the luciferase cluster was derived by dupli- cation and translocation, frequently rearranged and lost in most Mycenaspecies, but conserved in theArmillarialineage. Luciferase cluster members were coexpressed across developmental stages, with the highest expression in fruiting body caps and stipes, suggesting fruiting-related adaptive functions. Our results con- tribute to understanding a de novo origin of bioluminescence and the corresponding gene cluster in a diverse group of enig- matic fungal species.
fungal bioluminescence
|
luciferase cluster evolution|
genome evolutionT
he genus Mycena comprises ∼600 small mushroom species widely distributed around the world (1). Also known as bonnet mushrooms,Mycenaspecies are usually characterized by a bell-shaped cap, a thin stem (Fig. 1A), and a gilled or porioid hymenophore (2). Mycenaalso have a diversity of life history strategies; while many species are saprotrophic, they can be pathogenic as well as mycorrhizal (3). Despite its vast diversity of lifestyles and phenotypes, there are many questions concerning the basic biology, ecology, and genomics of this genus. One particular fascinating trait is bioluminescence, which is most widespread in the genusMycena. At least 68 of the 81 known bioluminescent fungi belong toMycena(4), yet these account for less than 12% of the approximately 600Mycenaspecies (5), sug- gesting an intricate loss/gain history and potential convergence within the genus.Fungal light emission involves two main steps. First, a luciferin precursor of hispidin is hydroxylated by hispidin-3-hydroxylase (H3H) into 3-hydroxyhispidin (luciferin) (6). Oxygen is then added to the luciferin by luciferase, producing a high-energy intermediate which is subsequently decomposed, yielding light emission. Previously, Kotlobay et al. have identified the fungal luciferase, which is physically adjacent to these enzymes and forms a gene cluster containing luciferase, hispidin synthase, and H3H (7). This cluster was found to be conserved across bioluminescent
fungi of three lineages: Armillaria, mycenoid, and Omphalotus (7). Phylogeny reconstruction suggested that luciferase origi- nated in early Agaricales. ArmillariaandOmphalotusbelong to the marasmioid clade, whereasMycenawas recently found to be sister of the marasmioid clade (8). Recent genome sequencing efforts in the marasmioid clade revealed diverse genomic and life history traits, including genome expansion and pathogenicity in Armillariaspp. (9), novel wood decay strategies (10), or fruiting body development (11). Genomes of twoMycenaspecies were sequenced (7); however, the fragmented assemblies (N50 5.8 to 16.7 kb) impeded comparative genomic analyses of features such as synteny (12). These resources provide a substrate for studies of genome evolution and of bioluminescence in fungi; however, several key questions remain unresolved. Here, we set out to
Significance
We present the genomes of five new bonnet mushroom Mycenaspecies, formerly the last fungal bioluminescent line- age lacking reference genomes. These genome-scale datasets allowed us to construct an evolutionary model pinpointing all possible changes in the luciferase cluster across all fungi and additional genes involved in bioluminescence. We show that luciferase clusters were differentially lost in different fungal lineages and in particular a substantial loss was observed in the mycenoid lineage. This can be attributed to genome regions of Mycenathat underwent different evolutionary dynamics. Our findings offer insights into the evolution of how a gene cluster emerged 160 million years ago and was frequently lost or maintained due to differences in genome plasticity.
Author contributions: H.-M.K. and I.J.T. conceived the study; I.J.T. led the study; H.-M.K., C.C.-C., G.S., and H.-W.K. sampled theMycenaspecies in Taiwan; H.-M.K., P.-H.W., and C.-Y.I.L. conducted the experiments; M.J.L. and J.-Y.L. designed the Illumina sequencing experiment; H.-H.L. and I.J.T. performed the assemblies and annotations of theMycena genomes; H.-M.K., H.-H.L., Y.-C.L., and I.J.T. conducted the repeat analysis; L.G.N. and I.J.T.
carried out phylogenomics analyses and the divergence time estimation; H.-M.K., H.-H.L., Y.-C.L., and I.J.T. carried out comparative genomic analyses; H.-M.K. and M.R.L. analyzed the RNA-seq data; H.-M.K., H.-H.L., J.-W.A.H., R.J.-H.L., and P.-Y.C., carried out the methylation analyses; and H.-M.K. and I.J.T. wrote the manuscript with input from L.G.N. and P.-Y.C.
The authors declare no competing interest.
This article is a PNAS Direct Submission. M.L. is a guest editor invited by the Editorial Board.
This open access article is distributed underCreative Commons Attribution-NonCommercial- NoDerivatives License 4.0 (CC BY-NC-ND).
1To whom correspondence may be addressed. Email: cotton@sinica.edu.tw or ijtsai@
sinica.edu.tw.
This article contains supporting information online athttps://www.pnas.org/lookup/suppl/
doi:10.1073/pnas.2010761117/-/DCSupplemental.
First published November 23, 2020.
EVOLUTION
understand how the luciferase cluster originated and was lost or retained, determine levels of variation in this cluster across these lineages, and identify novel genes involved in bioluminescence.
To gain insights into the evolution of fungal bioluminescence and the ecology of mycenoid species, we sequenced the genomes of four bioluminescent (Mycena chlorophos,Mycena kentingen- sis, Mycena sanguinolenta, and Mycena venus) and one non- bioluminescent (Mycena indigotica) species. We conducted comparative genomics with representative genomes of all biolu- minescent fungal clades, putting particular emphasis on genome- wide synteny to investigate the evolutionary dynamics of the lu- ciferase gene cluster through hundreds of millions of years. The variability in genome sizes amongMycenais likely associated with the differential expansion of repeats in the genomes, potentially due to the differential control on repeat activity by DNA meth- ylation. Members of the luciferase cluster were up-regulated in the transcriptome of bioluminescent mycelium, and coexpression analyses identified specific genes likely to associate with the bio- luminescence and development inMycena. Based on comparative analyses from 15 available genomes of bioluminescent fungi, we
reconstructed and formulated a model for the evolution of fungal bioluminescence.
Results
Assemblies and Annotations of FiveMycenaSpecies.We sequenced the genomes of the bioluminescent fungiM. chlorophos,M. ken- tingensis, M. sanguinolenta, and M. venus, as well as the non- bioluminescentM. indigotica(Fig. 1A). These species were chosen for their phylogenetic positions (SI Appendix, Fig. S1) and because they displayed different bioluminescence intensities. An initial assembly of each species was produced from Oxford Nanopore reads of each species (SI Appendix, Table S1) using the Canu (13) assembler. Only M. indigotica was successfully isolated from a basidiospore, and the four species that were isolated from het- erokaryotic mycelium yielded assemblies 1.3 to 1.8 times larger than haploid genome sizes estimated from Illumina reads using GenomeScope (14) (SI Appendix, Table S2). Mitochondrial ge- nomes in these species were separately assembled into single circular contigs of 88.3 to 133 kb long (SI Appendix, Fig. S2), and haploid nuclear genomes were constructed. The assemblies were
B C
0 0 0 0 0 0 0 0 0 0 0 00 0 0 1 1 1 0 0 0 0 0 1 1 0 0 1 1 1 1 1 1 1 1 10 1 1 2 1 1
OG0009249 luz 0 1 1 1 1 1 1 1 1 2 1 11 1 1 1 1 1 1 2 1 2 1 1 2 1 1 1 2 2 2 2 2 2 2 20 1 2 1 1 2
0 0 0 0 0 0 0 0 0 0 0 00 0 0 0 0 0 0 0 0 0 0 0 0 0 0 1 1 1 1 1 1 1 1 10 1 1 2 1 1
0 2 0 0 0 0 0 5 2 3 0 00 1 1 0 0 0 0 2 0 1 0 1 1 0 0 2 2 2 3 3 3 2 2 30 1 1 1 4 4
13
0 0 0 0 0 0 0 0 0 0 0 00 0 0 1 1 0 0 0 0 0 1 1 1 0 0 1 1 1 1 1 1 1 1 131
7 25 31 10
OG0002489
OG0000706 OG0009696 OG0002332
hisps h3h
cyp450 cph Panellus stipticus
Mycena venus
Armillaria ectypa Mycena indigotica Mycena chlorophos Mycena kentingensis Mycena sanguinolenta
Guyanagaster necrorhiza Armillaria mellea Armillaria gallica Armillaria cepistipes Armillaria borealis Armillaria solidipes Armillaria ostoyae Armillaria tabescens
Flammulina velutipes Cylindrobasidium torrendii Neonothopanus gardneri Omphalotus olearius Gymnopus luxurians Rhodocollybia butyracea
Volvariella volvacea Amanita muscaria Amanita thiersii Flagelloscypha sp.
Auriculariopsis ampla Schizophyllum commune Fistulina hepatica Marasmius fiardii Dendrothele bispora Gymnopus androsaceus
Fibulorhizoctonia sp.
Galerina marginata Hypholoma sublateritium Coprinopsis cinerea
Laccaria bicolor Laccaria amethystina Hebeloma cylindrosporum
Plicaturopsis crispa Pleurotus ostreatus Agaricus bisporus
Paxillus involutus
Cenozoic Cretaceous
Jurassic Bioluminescent
Bioluminescent but w/o ref.
non-Bioluminescent Marasmioid Mycenoid
Agaricales
100
200 0
Time before present (Myr)
Bioluminescent clade
PANBI_079140 Mven_02536400 Msan_01367200 Msan_01367500
Ompol1_7904 Schco3_2637688 Armect1_613630 Armtab1_139364
Fishe1_70153 Armosto1_262487
Mk_01106900
Choiromyces venosus Armost1_956899
Guyne1_929646
Auramp1_505697 NEOGA_075400 Armga1_268845
Tuber aestivum Armcep1_10573
Armbor1_1731568
Armmel1_1001304 Mc_00780800
Ascomycota
D
Mycena venus
Mycena sanguinolenta
Mycena kentingensis
Mycena chlorophos
Mycena indigotica
A
005001051 Mb LTRs
DNA LINES
Unclassified SINES Small Satellite Simple Low Genome w/o repeat and gene Exon Intron Gene feature
1.1
P. stipticusM. venus M. indigotica M. chlorophos Mycena kentingensis M. sanguinolenta Repeat
E
11.5%
100%
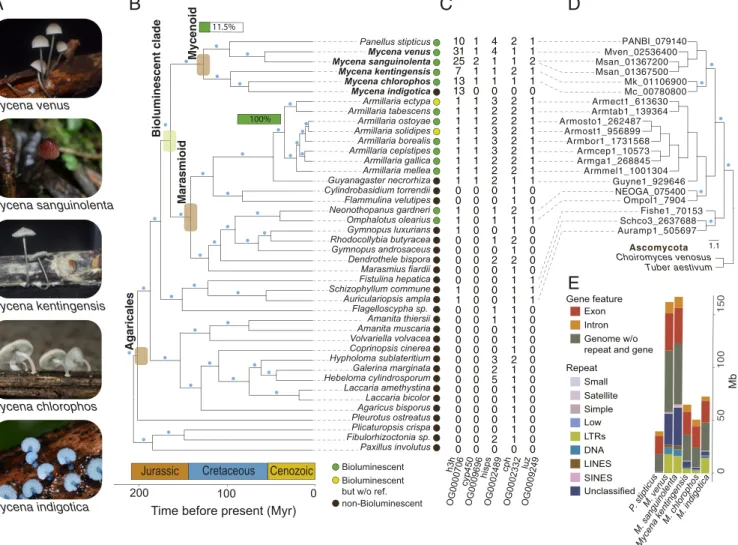
Fig. 1. Phylogenomic analysis ofMycenaand related fungi. (A) The five species sequenced in this study. (B) Species trees inferred from a concatenated supermatrix of the gene alignments using the 360 single-copy orthogroups. Thexaxis denotes divergence time estimates. Blue dot on a branch indicates a bootstrap value>90. Green horizontal bars indicate the percentage of bioluminescent fungi found in either the mycenoid or theArmillarialineage. (C) Gene copy number in the OGs associated with luciferin biosynthesis pathway including luciferase (luz), hispidin-3-hydroxylase (h3h), hispidin synthase (hisps), cy- tochrome P450 (cyp450), and caffeylpyruvate hydrolase (cph). (D) Reconciliated phylogeny of fungal luciferase. Blue dot on a branch indicates a bootstrap value>90. (E) Haploid genome sizes for mycenoid species broken down by repeat types and gene features. Repeats including TEs are LTRs, long interspersed nuclear elements (LINES), short interspersed nuclear elements (SINEs), DNA transposons (DNA), and other types of repeats, such as small RNA (small), simple repeats (simple), and low complexity repeats (low).
further polished using Illumina reads and had consensus quality values (QVs) of 31.1 to 36.8 (SI Appendix, Table S2), which is similar to the QVs of recently published nanopore assemblies in human (also polished with Illumina reads; 23.7 to 43.5) (15).
These haploid nuclear genomes were 50.9 to 167.2 Mb long, and two of them were among the largest in Agaricales reported to date. The assemblies consisted of 30 to 155 contigs with N50 2.0 to 5.5 Mb (SI Appendix, Table S2), which were comparable to rep- resentative fungal reference assemblies (SI Appendix, Fig. S3) and allowed for synteny comparisons (12). Stretches of TTAGGG hexamers were identified at the end of scaffolds, indicating telo- meric repeats commonly found in Agaricales (16, 17). The largest scaffolds inM. indigotica and M. kentingensiswere telomere to telomere, indicating gapless chromosomes.
Using a combination of reference fungal protein homology support and mycelium transcriptome sequencing (Dataset S1), 13,940 to 26,334 protein-encoding genes were predicted in the Mycenagenomes using MAKER2 (18) pipeline, and were 92.1 to 95.3% complete (SI Appendix, Table S3) based on BUSCO (19) analysis. Orthology inference using Orthofinder (20, 21) placed these gene models and those of 37 other Basidiomycota genomes (SI Appendix, Table S4) into 22,244 orthologous groups (OGs;SI Appendix, Table S5). Of these OGs, 44.3% contained at least one ortholog from another basidiomycete, while 15 to 29% of the proteomes in eachMycenaspecies were species specific (Dataset S2). The genome sizes were positively correlated with proteome sizes, with the largest (M. sanguinolenta) and smallest (M.
chlorophos) varying two- and threefold, respectively. Interest- ingly, the mitochondrial genomes were larger in species with smaller genomes, and this was because nine out of 16 genes had gained many introns (SI Appendix, Table S6 and Fig. S2).
Interplay between Transposable Elements and DNA Methylation in Mycena.Similar to other fungal genomes (22, 23), much of the variation in theMycenanuclear genome sizes can be explained by repetitive DNA content (SI Appendix, Table S7). Only 11.7%
of the smallest genome (M. chlorophos) was repeats, which is in stark contrast to the 39.0% and 35.7% inM. sanguinolentaand M. venus, respectively. The majority of transposable elements (TEs) in Mycena were long terminal repeat (LTR) retro- transposons (60 to 85%), followed by DNA transposable ele- ments (11 to 24%) (Fig. 1E and SI Appendix, Table S7).
Interestingly, the larger genomes of M. sanguinolenta and M.
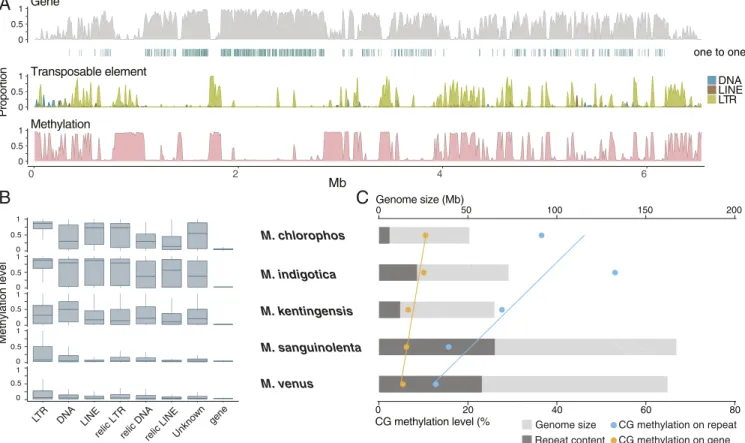
venuscontained the lowest proportion of LTRs (24.9 and 31.1%, respectively), but the highest proportion of unclassified repeats (55.4 and 50.3%, respectively) (SI Appendix, Table S7). A total of 16.6 to 36.5% of the unclassified repeat families shared 53.8 to 60.5% nucleotide identity with known transposable elements, suggesting they were degenerated copies which we defined as relic TEs (SI Appendix, Table S8). Fig. 2Ashows that the largest assembled chromosome ofM. indigotica exhibits high protein- coding gene content and low transposable element density at scaffold centers, which is typical of fungal chromosomes (24, 25).
Such observations were consistent across largeMycenascaffolds (typically>1 Mb), suggesting that our assemblies were robust enough to capture evolutionary dynamics across chromosomes.
We detected 5-methylcytosine (5mC) DNA methylation levels across the fiveMycenaassemblies with nanopore long reads us- ing deepsignal (26) which was initially trained with M. kentin- gensis bisulphite sequences (Methods). CG sites were found either highly (mCG level>60%) or weakly (<15%) methylated in gene body, displaying a bimodal distribution (SI Appendix, Fig.
S4). Such a bimodal distribution has also been observed in plants, animals, and other fungi, includingTuber melanosporum andPseudogymnoascus destructans(27–32). WithinMycena, the CG methylation in genes (5.4 to 10.5%) was much lower than that in repeats—i.e., TEs and unclassified repeats (11.6 to 84.5%) (Fig. 2Band SI Appendix, Table S9). The level of CG
methylation in these genomes is comparable with those of a previous survey on DNA methylation in 528 fungal species (32), which revealed that 5mC levels were highest in Basidiomycota, further indicating that DNA methylation has a specific effect on repeats in Mycena genomes. DNA transposons or LTR were enriched in 5mC levels and were higher than flanking regions (SI Appendix, Fig. S5). Except for DNA transposons in M. kentin- gensis, LTR retrotransposons had the highest CG methylation levels of all types of transposable elements (Fig. 2B). Further- more, CG methylation in relic TEs was clearly lower than that in classic TEs (SI Appendix, Table S9). Among theMycenaspecies, we found that M. sanguinolentaand M. venus with larger ge- nomes and higher repeat content had lower levels of methylation in the repeats, and the repeat methylation was much higher inM.
indigotica,M. chlorophos, andM. kentingensis, which have smaller genomes (Fig. 2C). The same pattern was also observed in genes, though they had fewer changes in their methylation level than did repeats. Our results indicate that the variant composition of repeats is differentially mediated by DNA methylation among closely related Mycena species. Hence, genome expansion in Mycenawas likely a result associated with transposable element proliferation and the accumulation of relic TEs, which yielded reduced methylation in active copies; this is also observed in some plants, e.g.,Arabis alpina(33) andManihot esculenta(34).
A Single Origin of Bioluminescent Fungi in the Ancestor ofMycena and the Marasmioid Clade.Phylogenomic analyses based on single- copy ortholog sets have placedMycenasister to the marasmioid clade, includingArmillariaandOmphalotus, which are the other two lineages in which bioluminescent species have been identi- fied. This species phylogeny was recovered in both maximum likelihood analysis (35) of a concatenated supermatrix of single- copy gene alignments (Fig. 1B) and coalescent-based analysis using 360 gene trees (36) (SI Appendix, Fig. S6). In our four bioluminescent Mycenaspecies, we identified genes involved in luciferin biosynthesis and their orthologs across species (Fig. 1C). Fig. 1D shows phylogenetic reconciliation, which suggests that the orthogroup containing luciferases was present in the last common ancestor of the mycenoid + marasmioid clade and Schizophyllaceae, predating their incorporation into the luciferase cluster. This is in contrast to a previous report (7) suggesting that luciferase originated in the last common ancestor of the Agaricales. Phylogenies of other members of the luciferase cluster were also congruent with the species tree (SI Appendix, Fig. S7 A–D). Using MCMCtree (37) with three fossil calibra- tions, we estimated the age of mycenoid most recent common ancestor to be 105 to 147 million years ago (Mya) in the Cre- taceous (Fig. 1B). This is consistent with recent estimates [78 to 110 (8) and mean 125 (1) Mya] and overlaps with the initial rise and diversification of angiosperms (38), suggesting thatMycena are ecologically associated with plants acting as saprotrophs or mycorrhizal partners (3). Finally, the age of mycenoid and marasmioid which was also the age of the luciferase cluster in fungi was estimated to originate around 160 million years ago during the late Jurassic (Fig. 1B).
Differential Conservation of Synteny Regions acrossMycenaGenomes.
We attempted to characterize chromosome evolution in the myce- noid clade using the newly available, highly contiguous assemblies for Mycena. We first compared the patterns of 4,452 single-copy ortho- log pairs between assemblies ofM. indigotica andArmillaria ectypa (SI Appendix, Fig. S8). The majority of scaffolds between the two species could be assigned one-to-one relationships unambiguously, providing strong evidence that macrosynteny has been conserved between the marasmioid and mycenoid clades. Such chromosome- level synteny remained conserved until the last common ancestor of the Agaricales, whenM. indigoticawas compared against the genome of Pleurotus ostreatus (SI Appendix, Fig. S9). Based on the
EVOLUTION
clustering of single-copy orthologs, we identified 10 linkage groups resembling the number of known karyotypes in Basidio- mycota, suggesting possible ancestral chromosome numbers (25).
TheM. indigoticascaffolds exhibit high orthologous gene den- sity in the centers of scaffolds (Fig. 2A). Fungal chromosomes can
typically be compartmentalized into chromosomal cores and subtelomeres which display differential evolutionary dynamics (24, 39). In some extreme cases, filamentous pathogenic fungi contain entire lineage-specific chromosomes that are gene sparse and enriched in transposable elements (40). In the case of
0 2 4 6
0 0.5 1
0 0.5 1
Mb
Proportion
DNALINE LTR
| || || || |||||||||| ||||||||||||||| ||||||||||||||||||||||||| ||||||| |||||||||||||||||||||||||||||||||||||||||||||||||||||||||||||||||||||||||| ||||||||||||||||||||||||||||||| ||||||||||||||||||||||||||||||||||||||||||||||||||||||||||||||||||||||||||||||||||||||||||||||||||||||| ||||||||||||||||| |||||||||||||||||||||||||||||||||||||||||||||||||||||||||||||||||||||||||||||||||||||||||||||| ||||||||||||||| |||| ||||| |||||||||||||||||||| || | ||||||| ||||||||||| ||||||||||||| ||| || ||||||||||||||||| | || ||| || | ||| | |||||||||||||| ||||| | ||| ||||| ||||| ||| |||||||||||||||||||||||| | || |||| ||||||| ||| |||| ||| ||| ||| |||||| ||||||||||||||||||||||||||| || | || ||| ||||||||||| | 0
0.5 1
one to one Gene
Transposable element
Methylation
Methylation level
0 50 100 150 200
0 20 40 60 80
Genome size (Mb)
CG methylation level (%
A
M. chlorophos
M. indigotica
M. kentingensis M. sanguinolenta M. venus
B C
Genome size Repeat content
CG methylation on repeat CG methylation on gene
0 0.5 1
0 0.5 1
0 0.5 1
0 0.5 1
0 0.5 1
LTR
DNA LINE
relic LTRrelic DNArelic LINEUnkn own gene
Fig. 2. Distribution ofMycenagenome features. (A)M. indigoticachromosome one. For every nonoverlapping 10-kb window, the distributions fromTopto Bottomare: 1) Gene density (content in percentage). Blue stripes denote positions of single-copy ortholog withM. chlorophos. 2) Density of TEs, including LTRs, LINES, and DNA. 3) Average methylation level called from CpG sites per window. The high methylation window generally clustered in high TE regions with low gene density. (B) Methylation level in genes and different types of repeats. (C) Relationships among genome size, number of repeats, and CG methylation levels inMycena.
01(H)
02 04 05 07' 09' 03 08'
10 11 3426 3322 13' 19' 12' 32' 14 39 15 18 20 23 25 2728 2930 3135 36 37 3840
01' 14' 13' 06 08' 02' 04' 05' 11 10' 03 09 07 12(H) 15
16' 21' 17 19' 18 20
22 32 31'33 41' 2324 25 26 27 29 3034 35 36 37 38' 3940(H)42 43 44 45 46 47
01
02' 03
04'
06' 07 21 13 08 16' 10'20'1814 15'12'1722
02 05 07 08 10
11
12 14' 15 18 19
01' 02 03
04 09' 10 05' 08' 07 12'1106'
13 15 27 21'26' 17 20 22'25'19'14'2416 23
T
T T T T T TT T T
T T
T T
T T TT T T T T
T T T
T
T T T
T T T T T T T
M. venus M. sanguinolenta M. kentingensis M. indigotica M. chlorophos
Luz Luciferase cluster
Luz
Luz Luz
Luz
Fig. 3. Genome synteny inMycenagenomes. Schematic representation of the interscaffold relationship between species. The lines between scaffolds denote single-copy orthologs between a pair of species. Shaded areas in each scaffold denote high-synteny regions defined by DAGchainer (41) and colors denote linkage groups assigned by most abundant pairwise single-copy orthologs. Lines are color coded according to corresponding linkage groups. Black triangles denote locations of luciferase clusters.
Mycena, a multigenome comparison showed that synteny con- servation was typically either lost at the scaffold ends or ex- tended by several megabases across the assemblies (Fig. 3).
Defining precise boundaries between regions with and without synteny is challenging. Based on the clustering of orthologous genes using DAGchainer (41), we partitioned the scaffolds into low and high synteny regions. As expected, highly syntenic re- gions inMycenawere typically found at the scaffold centers. In contrast, synteny was not identified in part of scaffolds or, in some cases, throughout the entire scaffolds, as was the case for the largest (12.0 Mb) assembled scaffold ofM. venus (Fig. 3).
These regions are highly enriched in repeats; they have 1.5 to 2.6-fold higher methylation levels and are overrepresented in expanded and contracted OGs compared to high synteny regions (SI Appendix, Fig. S10 and Table S10; two-proportionztest,P<
2.1E-9). Expansions and contractions of gene families were 1.8- to 4.2- and 1.4- to 2.9-fold higher in the low than high synteny regions, respectively; differential gain and loss of genes in these regions may have important implications forMycena.
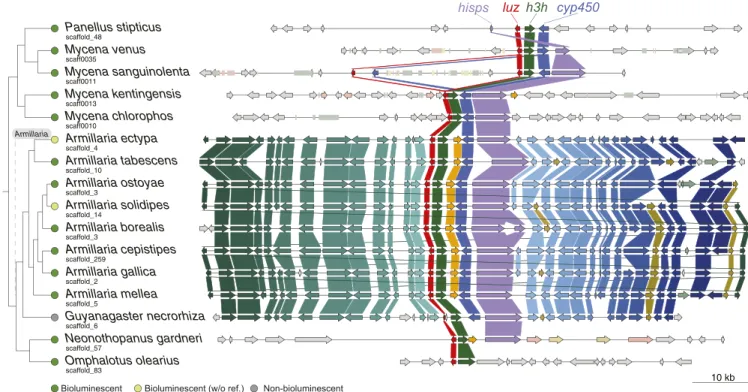
Evolutionary Dynamics of Luciferase Clusters.One of the outstanding questions surrounding the evolution of fungal bioluminescence is why bioluminescent species are scattered across the mycenoid and marasmioid clades. The mechanism of fungal biolumines- cence is homologous across species (6), and this implies that nonbioluminescent mycenoid and marasmioid species must have lost the functional luciferase gene cluster. To investigate the evolutionary dynamics of the luciferase cluster, we examined all highly contiguous assemblies across the bioluminescent lineages available and inspected adjacent synteny (Fig. 4). The majority of theMycenaluciferase clusters included luciferase (luz), hispidin- 3-hydroxylase (h3h), cytochrome P450 (cyp450), and hispidin synthase (hisps). We found that physical linkage was only maintained within the luciferase cluster, and synteny was lacking
in genes surrounding the luciferase cluster (Fig. 4) of species in the mycenoid and Omphalotus lineages. Coupled with the aforementioned synteny analysis, we hypothesized that the lu- ciferase cluster residing in a fast-evolving genomic region may result in it frequently being lost. The nearest TE sequence ad- jacent to luciferase cluster in Mycenaspecies were 2 to 8.9 kb away and separated by 0 to 5 genes, suggesting possible roles of transposons mediating rearrangements (Fig. 4). Additionally, the luciferase cluster of different Mycena species was identified in low synteny regions of different linkage groups (Fig. 3), provid- ing evidence that the location of the cluster had been extensively rearranged. In contrast, the genes surrounding the luciferase cluster among the eightArmillariaspecies were generally in the same order, with collinearity partially lost only inGuyanagaster necrorhiza(a very close relative ofArmillaria, Fig. 4). We found that the synteny surrounding theArmillarialuciferase cluster was maintained since the common ancestor of Agaricales (SI Ap- pendix, Fig. S11). The up- and downstream regions of the lucif- erase cluster belonged to two separate regions of the same ancestral chromosome linkage group, suggesting that these re- gions were previously rearranged—including the luciferase cluster—and were subsequently retained (SI Appendix, Fig. S11).
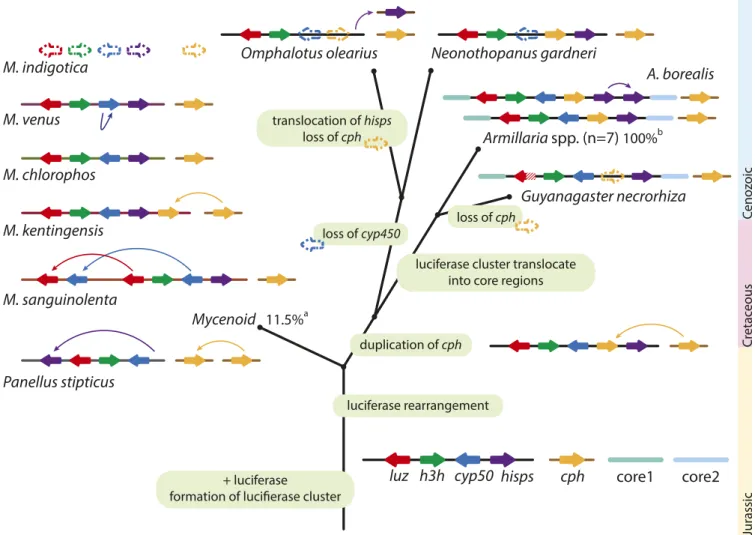
These observations led us to propose a most plausible evolu- tionary scenario in which the luciferase cluster evolved across all available bioluminescent fungi (Fig. 5). We inferred that the ancestral luciferase cluster consisted of luz, h3h, cyp450, and hisps, with caffeylpyruvate hydrolase cph—involved in oxy- luciferin recycling (6, 7)—also present on the same chromosome.
This combination was found in 14 of the 15 bioluminescent species used in this study. Our data outline two contrasting scenarios by which the luciferase cluster was retained. First, the luciferase clusters in family Physalacriaceae are located in slow- evolving chromosomal regions, resulting in all members of the Armillariasynteny retaining both many of the genes adjacent to
scaffold_48 scaff0035 scaff0011 scaff0013 scaff0010 scaffold_4 scaffold_10 scaffold_3 scaffold_14 scaffold_3 scaffold_259 scaffold_2 scaffold_5 scaffold_6 scaffold_57 scaffold_83
hisps luz h3h cyp450
Bioluminescent (w/o ref.) Non-bioluminescent Armillaria
Bioluminescent
10 kb
Panellus stipticus Mycena venus Mycena sanguinolenta Mycena kentingensis Mycena chlorophos Armillaria ectypa Armillaria tabescens Armillaria ostoyae Armillaria solidipes Armillaria borealis Armillaria cepistipes Armillaria gallica Armillaria mellea Guyanagaster necrorhiza Neonothopanus gardneri Omphalotus olearius
Fig. 4. Synteny around the luciferase cluster among bioluminescent fungi. The OGs shared by at least two species are labeled with the same color, regardless of their orientation. Arrows and rectangles denote protein-encoding genes and transposable element, respectively. Different colors of rectangles denote TE types (pink: LINE and LINE relic; light green: LTR and LTR relic; yellow: DNA and DNA relic). Thecphgene in some species was located in other scaffolds (SI Appendix, Fig. S12).
EVOLUTION
the luciferase cluster and the uniform luciferase cluster in their genomes. By residing in slow-evolving regions, the luciferase cluster in Armillaria might not be prone to losses by frequent chromosomal events (rearrangements, TE activity, etc.), explain- ing why it is conserved in the genus. On the other hand, the lu- ciferase cluster in the mycenoid lineage is located in a highly dynamic genomic partition with low synteny (Fig. 3), which could explain whyMycenafungi had a higher tendency to lose the lu- ciferase cluster compared toArmillariaspecies.
Variations were common in the luciferase cluster. cph was located in different scaffolds in four of the fiveMycenaspecies (SI Appendix, Fig. S12). InM. sanguinolenta,luzandcyp450were duplicated adjacent to the luciferase cluster (Fig. 4). Losses were observed at different positions in the phylogeny. The non- bioluminescentM. indigoticalost the entire luciferase cluster, but h3hhomologs were found in other regions of the genome, whileG.
necrorhiza has a partial luciferase (7) and three other enzymes (Fig. 4), suggesting that an independent loss of luciferase function alone was enough for it to lose its bioluminescence. Interestingly, we found that the cphgene was independently translocated adja- cent to the luciferase cluster in bothM. kentingensisand the an- cestor of the marasmioid clade (SI Appendix, Fig. S13); it was
presumably favored and maintained here by natural selection (42).
A selection analysis of genes in the luciferase cluster revealed that 23.1 to 45.2% of conserved sites exhibit purifying selection, with only 7 to 28 sites under episodic selection (SI Appendix, Fig. S14).
Expression Profile of Luciferase Cluster and Identification of Conserved Genes Involved in Fungal Bioluminescence.Fungal bioluminescence is believed to have ecological roles, such as attracting insects, and is regulated by circadian rhythms (43); however, the complete repertoire of genes involved in bioluminescence is still unknown.
We carried out transcriptome profiling between mycelia with different bioluminescent intensities in fourMycenaspecies, and identified genes that were either differentially expressed or positively correlated with bioluminescent intensities (Methods).
There were 29 OGs found to contain up-regulated gene mem- bers in all fourMycenaspecies (Fig. 6A), includingluz,h3h, and hisps, consistent with bioluminescence intensity dependent on the expression of these three genes in the luciferase cluster. In particular,luzexpression was significantly different between two tissues with relative high and low bioluminescence in M. ken- tingensis(log fold change [logFC] 3.0; adjustedP<0.001) andM.
chlorophos (logFC 4.7; adjusted P < 0.001); there was also a
Fig. 5. Evolutionary scenario for luciferase cluster evolution. The formation of the luciferase cluster originated at the dispensable region of the last common ancestor and was susceptible to translocate to different genomic locations through rearrangement. In the ancestor of marasmioid,cphwas duplicated and translocated into the luciferase cluster. Before the ancestor of the Physalacriaceae family emerged, the luciferase cluster was translocated into the core region and have since kept its synteny in theArmillarialineage. In the most recent common ancestor ofMycenaspecies, the luciferase cluster was located in the dispensable region and have since been susceptible to further rearrangement. Arrow box indicates gene. The dashed arrow box denotes the loss of gene.
Fishhook arrow denotes translocation event.aPercentage of bioluminescent fungi found in the mycenoid lineage (5).bPercentage of bioluminescent fungi found inArmillarialineage (47).
significant correlation between bioluminescent intensity and ex- pression level inM. sanguinolenta(Pearson’s correlation coeffi- cient [PCC] 0.82;P<0.005) andM. venus(PCC 0.86,P<0.005;
Dataset S3). InM. chlorophos, however, itscyp450andh3hwere not differentially expressed, and four distant homologs ofh3h were found to be up-regulated (SI Appendix, Fig. S7A). Although a second copy ofluzandcyp450were found inM. sanguinolenta, they showed much lower expression (2 and 3 transcripts per million [TPM], respectively) than those in the cluster (282 and 138 TPM, respectively). The remaining OGs up-regulated in mycelia showing higher bioluminescence included ABC trans- porters and acetyl-CoA synthetases which also showed a pre- dicted function in metabolic adaptations to bioluminescence in firefly and glowworm (44, 45) (Fig. 6AandSI Appendix, Table S11). In particular, four OGs were annotated as FAD or NAD(P)-binding domain-containing proteins. As these genes do
not bear sequence similarity toh3hwhich is also a NAD(P)H- dependent enzyme, they are likely involved in other biochemical processes that are required during bioluminescence.
Differences in bioluminescent intensity have been recorded in tissues of fungi both in nature (4, 5, 46–48) and—for M.
kentingensis—in a laboratory environment, in which the life cycle can be completed (Fig. 6B). To investigate putative roles of bioluminescence across developmental stages, additional tran- scriptome profiling was carried out in the primordia, young fruiting body, and cap (pileus) and stipe of the mature fruiting body ofM. kentingensis. Bioluminescence was stronger in the cap than in the stipe, so we expected the luciferase cluster genes to have higher expression in the cap tissue. However,luzandh3h showed opposite expression patterns (Fig. 6CandDataset S4), suggesting that there may be other regulators involved in biolu- minescence inM. kentingensis.
Mycena venus
Panellus stipticus Armillaria ectypaM. indigotica M. chlorophos M. kentingensis M. sanguinolenta
Guyanagaster necrorhiza A. melleaA. gallica A. cepistipes A. borealis A. solidipesA. ostoyae A. tabescens
Flammulina velutipes Cylindrobasidium torrendii Neonothopanus gardneri Omphalotus olearius Gymnopus luxurians Rhodocollybia butyracea
Flagelloscypha sp.
Auriculariopsis ampla Schizophyllum commune Fistulina hepatica Marasmius fiardii Dendrothele bispora Gymnopus androsaceus
Average of outgroup speceis (n=14)
h3h hispscph luz cyp450
MycenoidPhysalacriaceaeMarasmiaceaeSchizophyllaceae
OG0009249OG0000706OG0009696OG0002489OG0002332OG0000386OG0000288OG0000215OG0001192OG0001818OG0000591OG0000147OG0000398OG0000593OG0000348OG0000253OG0000022OG0000345OG0000143OG0000048OG0000014OG0000134OG0000005OG0000066OG0000034OG0000026OG0000007OG0000006OG0000097OG0000004OG0000000 FAD or NAD(P)-
binding Acid proteasePeptidase S41ABC transporterTransporterHypothetical
proteinGH79GH67 HydrolaseCyp450Zinc fingerTFIIAAcetyl-CoA synthetaseAnkyrin repeat Kinase-likeTransmembrane DehydrogenaseArgonaute-like
A
number ofupregulated genes number of genes 300
50 1
0.0 2.5 5.0 7.5 10.0 12.5
Module 50 Adjacent genes
log2tpm
Mycelium
low bioluminescence Primordia
YFB FB-stipe FB-cap
hisps luz h3h cyp450 Mycelium
high bioluminescence Mycelium
Primordia
YFB
FB Cap Stipe
B C
D
DEG analysis
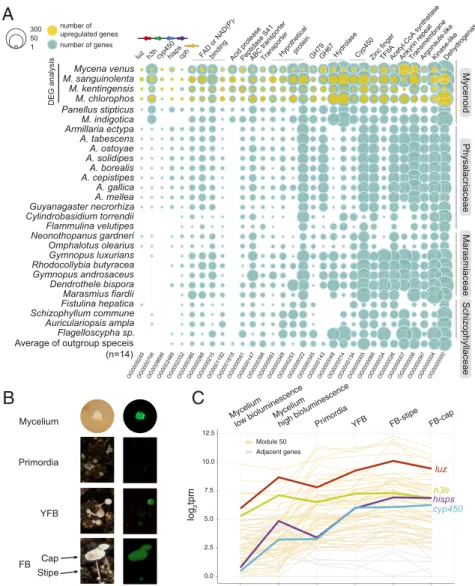
Fig. 6. Expression analysis to identify genes involved in bioluminescence. (A) Conserved up-regulated OGs. DEGs between mycelia with different biolumi- nescent intensities were identified in four bioluminescentMycenaspecies, and all 29 OGs—except OG0009249 and OG0000706—contain at least one up- regulated gene. A detailed annotation of the genes in the OGs is listed inSI Appendix, Table S11. (B) Tissues used for transcriptomic data analysis inM.
kentingensis. TheLeftandRightsides are the tissues under light and dark conditions, respectively (captured by a Nikon D7000). The camera setting for each tissue: mycelium, Sigma 17- to 50-mm ISO100 f2.8 with 16-min exposure time; primordia, AF-S Micro Nikkor 60-mm ISO800 f/11 with 122.4-s exposure time;
YFB, AF-S Micro Nikkor 60-mm ISO800 f/11 with 60.6-s exposure time; FB, AF-S Micro Nikkor 60-mm ISO800, f/11 with 9.3-s exposure time. YFB, young fruiting body (0.5 to 1 cm). FB, mature fruiting body (>1 cm). FB-cap, cap from FB. FB-stipe, stipe from FB. (C) Expression profile of luciferase cluster across devel- opmental stages ofM. kentingensis. Bold lines indicate four genes in the luciferase cluster. These four genes and the other 53 genes (yellow) were assigned into the same module (Module50) with similar expression patterns. The genes located up- or downstream (gray) of the luciferin biosynthesis cluster had lower expression levels than the four genes in the cluster.
EVOLUTION
The regulation of bioluminescence inM. kentingensisduring development was determined by performing a weighted corre- lation network analysis (WGCNA) (49, 50), which identified 67 modules of coexpressed genes in these stages (SI Appendix, Fig.
S15). All members of the luciferase clusterluz,h3h,cyp450, and hisps belonged to the same module (Module50; Fig. 6C) of 57 genes, suggesting that the expression of the luciferase cluster members are coregulated during developmental stages. Only two genes belonging to OG0001818 (acid protease) and OG0000000 (short-chain dehydrogenase) which were part of the 29 afore- mentioned OGs associated with bioluminescence in the myce- lium samples across Mycena. Six genes in this module were annotated as carbohydrate-active enzymes (Dataset S5): one GH75 (chitosanase), one AA1_2 (laccase; ferroxidases), two GH16, and two genes with two CBM52 domains. GH16 (gluca- nases) and AA1 (laccases) are known to be differentially expressed during fruiting body development (51), implying a possible link between cell wall remodelling during development and bioluminescence. In addition, we reanalyzed the tran- scriptomes ofArmillaria ostoyaeacross different developmental stages from Sipos et al. (9). Consistent with the observation that bioluminescence was only observed in mycelia and rhizomorphs inA. ostoyae(52, 53), the expressions ofluz,h3h,cyp450, andcph were highest in these tissues (SI Appendix, Fig. S16). Together, these results imply that the luciferase cluster was differentially regulated during development and that the extent of the ex- pressions was also different among bioluminescent species of different lineages.
Gene Families Associated with the Evolution of Mycenoid Species.We assessed orthologous group evolution by analyzing OG distri- bution dynamics along a time-calibrated phylogeny using CAFE (54). The rate gene family changes in mycenoid were comparable to those of other branches of Agaricales (likelihood ratio test;
P=0.25). A total of 703 orthologous groups were expanded at the origin of the mycenoid lineage (SI Appendix, Fig. S17).
Analysis of gene ontology terms showed that these genes were enriched in NADH dehydrogenase activity, monooxygenase ac- tivity, iron ion binding, and transferase activity (Dataset S6).
Additionally, we sought to identify proteins specific to mycenoid species by annotating protein family (Pfam) domains and com- paring them with those of species outside this lineage (Dataset S7). A total of 537 Pfam domains were enriched in the mycenoid lineage (onefold by Wilcoxon rank sum test with P < 0.01;
Dataset S8) of which 3 to 17 were species specific. Acyl_transf_3 (acyltransferase family; PF01757), contained in a range of acyl- transferase enzymes, was the only domain found in all six mycenoid species. The closest homologs were found in ascomy- cetous Cadophora, Pseudogymnoascus, or Phialocephala (31 to 35% identity with 73 to 100% coverage). Four of the enriched domains are known pathogenesis-related domains expanded in pathogenic Agaricales Moniliophthora (55) and Armillaria spe- cies (9): COesterase (PF00135; carboxylesterase family), thau- matin (PF00314), NPP1 (PF05630; necrosis-inducing protein), and RTA1 (PF04479; RTA1-like protein) (SI Appendix, Fig.
S18). Moreover,M. sanguinolentaandM. venuscontained over 100 and 17 copies of COesterase and thaumatin (median 37 and 4 copies in other fungal species of this study), respectively.
Discussion
Bioluminescence is one of the most unusual and fascinating traits in fungi, but the evolutionary history of the luciferase gene cluster, which underlies this phenomenon, has remained elusive.
Here, we produced highly contiguous genome assemblies using nanopore technology and annotations for fiveMycenaspecies to examine their genome dynamics and evolutionary histories of fungal bioluminescence. The results of phylogenomic analyses
on these genomes have important implications for the origin of luciferases.
The first question we addressed is whether fungal biolumi- nescence originated once or multiple times. Our species phy- logeny is in good general agreement with comparative genomic analyses around this group (9). We show that the fungal lucif- erase, which represents a de novo origin of luciferase activity different from that in other lineages (insects, bacteria, etc.), first appeared together with other members of the luciferase cluster in the last common ancestor of mycenoid and marasmioid clades.
Compared to previous inferences that this cluster had a single origin, our results imply extensive loss of the luciferase cluster in these two clades (Fig. 1BandC) to explain the patchy phylo- genetic distribution of and minor presence for bioluminescence in fungi. An alternative scenario could be that fungal biolumi- nescence arose multiple times through convergent evolution.
Although multiple origins yield a more parsimonious model, we can confidently reject this hypothesis because both the fungal luciferase and the luciferase gene cluster are clearly homologous across distant bioluminescent fungi (6). Although a single origin and the excessive number of implied losses may appear coun- terintuitive, models of trait evolution and recent empirical evi- dence of phylogenetically patchy, but homologous traits (56, 57) has emerged offering a biologically reasonable explanation. One attractive model is the latent homology model (58), which posits that precursor traits can potentiate lineages for easily and re- currently evolving similar traits. More comprehensive surveys of genomes in these lineages are needed to make informed spec- ulations on whether latent homologies might have facilitated the evolution of bioluminescence in fungi.
The next outstanding question therefore is what caused the frequent losses of bioluminescence in fungi? Our evolutionary reconstructions show that the luciferase cluster might have originated in a low-synteny region of genomes (Fig. 3), making it susceptible to rearrangement, which suggests it is highly prone to loss and explains why most mycenoid and marasmioid species are nonbioluminescent. This is consistent with a previous report that the main evolutionary process in fungal gene clusters is vertical evolution followed by differential loss (59). Interestingly, synteny was retained in luciferase clusters and adjacent genes ofArmil- lariaspecies (Fig. 4), which are better known for their roles as plant pathogens (9). Such synteny remained detectable when compared toMycena, representative Agaricales, andP. ostreatus genomes, suggesting that inArmillaria, the luciferase cluster was translocated to a region of the genome where synteny was maintained since the common ancestor of Agaricales and P.
ostreatus. Indeed, bioluminescence was identified in all nine ex- amined Armillaria species (47). One alternative but less parsi- monious scenario would be that the luciferase cluster originated in a high-synteny region and subsequently translocated to low- synteny regions in ancestors of both mycenoid and various families within the marasmioid clade. The repeated duplication and relocation ofcphthat we observed in the luciferase cluster is under selection pressure, suggesting that bioluminescence was maintained in fungi that still exhibit this phenotype. A systematic quantification of bioluminescence and more complete genome assemblies will help reconstruct the evolutionary events that contributed to the polymorphism and functional diversity in the luciferase clusters.
Researchers have long been puzzled over the ecological role of bioluminescence in fungi. One explanation that has been put forth forNeonothopanus gardneriis that bioluminescence follows a circadian rhythm to increase spore dispersal by attracting ar- thropods in the evening (43). If true, this is most likely a derived adaptation, as most bioluminescent fungi—including Mycena, Omphalotus, and Armillaria species—disperse spores via wind, display bioluminescence continuously, and are not known to attract insects (60). Besides, attraction is insufficient to explain
luminescence in the mycelium. We have shown that the luciferase cluster inM. kentingensis is constitutively expressed throughout development. We further identified a handful of genes whose expressions are correlated with fungal bioluminescence and may therefore be candidates for experimental follow-up studies (Fig. 6). If fungal bioluminescence originated as a byproduct of a biological process that is currently unknown, the ecological role was likely to be initially limited, which may explain why it has undergone subsequent losses in many species. For those that have retained bioluminescence, its ecological role remains unknown, but we speculate that it may be species specific, explaining why the luciferase cluster had been maintained across hundreds of millions of years.
In summary, our comparative analyses allowed us to propose an evolutionary model pinpointing changes in the luciferase cluster across all bioluminescent fungi with published genomes.
Our findings offer insights into the evolution of a gene cluster spanning over 160 million years and suggest that the retained luciferases were under strong purifying selection. OurMycena genome sequences may complement ongoing research on the application of bioluminescent pathways (7) and shed light on the ecological role of bioluminescence in fungi.
Methods
More detailed information on the materials and methods used in this study are provided inSI Appendix.
De Novo Assemblies ofMycenaSpecies.Haploid genome length and hetero- zygosity of the fiveMycenaspecies (M. kentingensis,M. venus(61),M. san- guinolenta,M. indigotica, andM. chlorophos) were estimated from Illumina reads using GenomeScope (14) (ver. 2.0). Oxford nanopore reads were as- sembled using the Canu (13) (ver. 1.8) assembler. Consensus sequences of the assemblies were polished first by five iterations of Racon (62) (ver. 1.3.2) fol- lowed by Medaka (ver. 0.7.1;https://github.com/nanoporetech/medaka) using Oxford nanopore reads. HaploMerger2 (63) (ver. 20180603) was then run on to generate haploid assemblies. Finally, the consensus sequences were further corrected with Illumina reads using Pilon (64) (ver. 1.22). QVs of the final as- semblies were calculated as described in Koren et al. (65). Throughout each stage the genome completeness was assessed using fungi and the basidio- mycete dataset of BUSCO (19) (ver. 4.1.2). Putative telomeric repeats were searched for copy number repeats of fewer than 10 mers using Tandem Re- peat Finder (66) (ver. 4.09; options: 2 7 7 80 10 50 500). The hexamer TTAGGG was identified (SI Appendix, Table S12).
Gene Predictions and Functional Annotation.Protein sequences from Uniprot fungi (32,991 sequences; downloaded December 20, 2018) andCoprinopsis cinerea,P. ostreatusPC15 (v2.0), Schizophyllum commune, andArmillaria melleafrom MycoCosm (67) portal were downloaded as reference pro- teomes. Transcriptome reads were first mapped to the corresponding ge- nome assemblies using STAR (68, 69) (ver. 2.5.3a) and subsequently assembled into transcripts using Trinity (70) (ver. 2.3.2; guided approach), Stringtie (71) (ver. 1.3.1c), CLASS2 (72) (ver. 2.1.7), and Cufflinks (73) (ver.
2.2.1). The samples used for input are listed inDataset S1. Transcripts gen- erated from Trinity were aligned to the references using GMAP (74). All transcripts were merged, filtered, and picked using MIKADO (75) (ver. 1.1).
The gene predictor Augustus (76) (ver. 3.2.1) and gmhmm (77) (ver. 3.56) were trained using BRAKER2 (78) (option fungi and softmasked), and SNAP (79) was trained using the assembled transcripts with MAKER2 (18) (ver.
2.31.9). The assembled transcripts, reference proteomes, and BRAKER2 an- notations were combined as evidence hints for input in the MAKER2 (18) annotation pipeline. MAKER2 (18) invoked the three trained gene predictors to generate a final set of gene annotation. Descriptions of amino acid se- quences of the proteome were annotated using Blast2GO (80) and gene ontology (GO) terms were annotated using Argot (ver.2.5 (81). A total of 80.0 to 86.7% of proteomes were assigned at least one GO term. Genes encoding carbohydrate-active enzymes were identified using dbCAN (82) (database ver. Hmm9.0; code ver. 2.0.0) by searching for sequence homologs with HMMER (83). Consensus (library) sequences of repetitive elements were identified using the pipeline described in Berriman et al. (84).
Methylation Analyses.High-quality paired-end reads were aligned to the genome assemblies ofM. kentingensisusing the bisulfite-specific aligner BS-
Seeker2 (85). Only uniquely mapped reads were retained. The cytosines covered by at least four reads were included in the data analysis, and the DNA methylation level for each cytosine was estimated as #C/(#C+#T), where #C is the number of methylated reads and #T is the number of unmethylated reads.
One or two nanopore flowcells for eachMycenaspecies were selected to infer methylation information using deepsignal (26) (ver. 0.1.5) (M. kentin- gensis: FAH31207,M. chlorophos: FAH31470,M. indigotica: FAH31228,M.
sanguinolenta: FAK22405 and FAH31211, and M. venus: FAK22389 and FAH31302). The machine learning-based model was trained with one bi- sulfite dataset (YJMC0389) and one nanopore dataset (FAH31207) ofM.
kentingensis. The bisulfite result was first filtered for depth >20, then methylation levels>0.9 and<0.01 were selected for positive and negative validation datasets, respectively. All seven flowcells were called for meth- ylation information with a customized model and default arguments. A minimal depth of 4 was applied to the results for further analysis. In the estimates of DNA methylation levels between nanopore long reads and the Illumina BS-seqs, the Pearson correlation coefficient was as high as 0.96 in the methylomes ofM. kentingensis(SI Appendix, Fig. S19).
Phylogenomic Analyses. OGs among 42 species were identified using OrthoFinder (20, 21) (ver. 2.2.7). A total of 42 sets of amino acid sequences from 360 single-copy OGs were aligned independently using MAFFT (86) (ver. 7.271; option–maxiterate 1000). A total of three approaches were used to infer the species tree. The first two approaches relied on maximum like- lihood phylogenies from individual OG alignments computed using RAxML- ng (87) (ver. 0.9.0; options:–all–model LG+I+F+G4–seed 1234–tree pars 10–bs-trees 100) with 100 bootstrap replicates. The best phylogeny and bootstrap replicates were separately used to infer a consensus tree using ASTRAL-III (36). Finally, a maximum likelihood phylogeny from the concat- enated amino acid alignments of the single-copy orthogroups was con- structed with 100 bootstrap replicates using RAxML-ng (87) (ver. 0.9.0;
options:–all–seed 1234–tree pars 10–bs-trees 100 with–model LG+I+F+G4 partitioned with each OG alignment).
Estimation of Divergence Time.The divergence time of each tree node was inferred using MCMCtree in PAML (37) package [ver. 4.9g with approximate likelihood (88); the JC69 model and the rest were default]. The individual amino acid alignments of 360 single-copy orthologs were converted into corresponding codon alignments using PAL2NAL (89) (ver. 14). The species tree and concatenated alignments of these single-copy orthologs were used as the input for MCMCtree. The phylogeny was calibrated using fossil re- cords by placing soft minimum bounds at the ancestral node of: 1) mar- asmioid [usingArchaeomarasmius legettii94 to 90 Ma (90); 90 was used], 2) Agaricales [usingPaleoagaricites antiquus110 to 100 Ma (91); 100 was used], 3) Taxon A [∼99 Ma (92); 95 was used], and 4) a soft bound of 200 Ma for the phylogeny. The entire analysis was run five times to check for convergence.
Synteny Analyses.Linkage groups (LGs) betweenM. indigoticaandA. ectypa and betweenM. indigoticaandP. ostreatuswere assigned, based on the reciprocal majority of the single-copy orthologs (SI Appendix, Figs. S8 and S9). Scaffolds that contained fewer than 10 single-copy orthologs, shorter than 500 kb, or shorter than species N90 were excluded from the analysis.
Linkage groups withinMycenawere assigned based on majority and at least 10% of single-copy ortholog links withM. indigoticascaffolds. Subsequent scaffolds were identified as the same linkage group if they contained a majority of pairwise one-to-one single-copy orthologs belonging to theM.
indigoticaLG. Synteny blocks of each species were estimated from pairwise proteome comparisons against its closest relative using DAGchainer (41) (options -Z 12 -D 10 -g 1 -A 5). Synteny around luciferase cluster was plotted using the genoPlotR (93) package.
RNA-Seq Analysis of Differential Bioluminescent Mycelium.Quality trimming of the RNA sequencing reads was conducted using Trimmomatic (94). The sequencing reads were mapped to the genome using STAR (68, 69) (ver.
STAR_2.5.1b_modified; default parameters). Raw read counts of the gene models were quantified by FeatureCounts (95) (ver. v1.5.0; -p -s 2 -t exon).
ForM. kentingensisandM. chlorophos, the differentially expressed genes (DEGs) were analyzed using DESeq2 (96). Genes with logFC >0 and false discovery rate (FDR)≤0.05 were defined as DEGs. ForM. sanguinolentaand M. venus, the DEGs were identified by the Pearson correlation coefficient between the bioluminescence intensity (relative light unit [RLU]) normalized by weight (RLU/mg) and log transformation of counts per million. Genes with correlation coefficient>0.7 andP<0.01 were defined as DEGs.
EVOLUTION