Systems/Circuits
Heterogeneous Origins of Human Sleep Spindles in Different Cortical Layers
Donald J. Hagler, Jr.,
1X István Ulbert,
2,3X Lucia Wittner,
2Loránd Ero˝ss,
3,4Joseph R. Madsen,
5X Orrin Devinsky,
6X Werner Doyle,
6XDániel Fabó,
7* Sydney S. Cash,
8and XEric Halgren
1,9*
1Department of Radiology, University of California at San Diego, La Jolla, California 92093,2Institute of Cognitive Neuroscience and Psychology, Research Center for Natural Sciences, Hungarian Academy of Science, Budapest, Hungary 1117,3Pe´ter Pa´zma´ny Catholic University, Faculty of Information Technology and Bionics, Budapest, Hungary 1117,4Department of Functional Neurosurgery, National Institute of Clinical Neurosciences, Budapest, Hungary 1145,5Departments of Neurosurgery, Boston Children’s Hospital and Harvard Medical School, Boston, Massachusetts 02115,6Comprehensive Epilepsy Center, New York University School of Medicine, New York, New York 10016,7Epilepsy Centrum, National Institute of Clinical Neurosciences, Budapest, Hungary 1145,8Department of Neurology, Epilepsy Division, Massachusetts General Hospital, Harvard Medical School, Boston, Massachusetts 02114, and9Department of Neuroscience, University of California at San Diego, La Jolla, California 92093
Sleep spindles are a cardinal feature in human NREM sleep and may be important for memory consolidation. We studied the intracortical organization of spindles in men and women by recording spontaneous sleep spindles from different cortical layers using linear microelectrode arrays. Two patterns of spindle generation were identified using visual inspection, and confirmed with factor analysis. Spindles (10 –16 Hz) were largest and most common in upper and middle channels, with limited involvement of deep channels. Many spindles were observed in only upper or only middle channels, but approximately half occurred in both. In spindles involving both middle and upper channels, the spindle envelope onset in middle channels led upper by ⬃25–50 ms on average. The phase relationship between spindle waves in upper and middle channels varied dynamically within spindle epochs, and across individuals. Current source density analysis demonstrated that upper and middle channel spindles were both generated by an excitatory supragranular current sink while an additional deep source was present for middle channel spindles only. Only middle channel spindles were accompanied by deep low (25–50 Hz) and high (70 –170 Hz) gamma activity. These results suggest that upper channel spindles are generated by supragranular pyramids, and middle channel by infragranular. Possibly, middle channel spindles are generated by core thalamocortical afferents, and upper channel by matrix. The concurrence of these patterns could reflect engage- ment of cortical circuits in the integration of more focal (core) and distributed (matrix) aspects of memory. These results demonstrate that at least two distinct intracortical systems generate human sleep spindles.
Key words: cortex; human; layer; memory; spindle
Introduction
Spindle oscillations are a characteristic feature of non-rapid eye movement (NREM) sleep that were first described 80 years ago
based on scalp EEG in humans (Loomis et al., 1935). They are bursts of
⬃10 –16 Hz activity lasting⬃0.5–2 s that occur duringReceived Aug. 7, 2017; revised Jan. 9, 2018; accepted Jan. 10, 2018.
Author contributions: I.U. and E.H. designed research; I.U., L.W., L.E., J.R.M., O.D., W.D., D.F., S.S.C., and E.H.
performed research; D.J.H., L.W., and E.H. analyzed data; D.J.H. and E.H. wrote the paper.
This work was supported by National Institutes of Health Grants R01-MH-099645 and R01-EB-009282, U.S. Office of Naval Research Grant N00014-13-1-0672, MGH Executive Council on Research, Hungarian National Brain Research Program Grant KTIA_13_NAP-A-IV/1-4,6, NAP 2017-1.2.1-NKP-2017-00002, and Hungarian Government Grants
KTIA-NAP 13-1-2013-0001, OTKA PD101754 and OTKA K119443. We thank Burke Rosen, ChunMao Wang, Adam Niese, Maxim Bazhenov, and Terrence Sejnowski for commentary, feedback, and technical support.
The authors declare no competing financial interests.
*D.F. and E.H. contributed equally to this study as co-senior authors.
Correspondence should be addressed to Dr. Eric Halgren, Department of Neuroscience, University of California at San Diego, MC 0852, La Jolla, CA 92093. E-mail:ehalgren@ucsd.edu.
DOI:10.1523/JNEUROSCI.2241-17.2018
Copyright © 2018 the authors 0270-6474/18/383013-13$15.00/0
Significance Statement
Bursts of ⬃ 14 Hz oscillations, lasting ⬃ 1 s, have been recognized for over 80 years as cardinal features of mammalian sleep. Recent
findings suggest that they play a key role in organizing cortical activity during memory consolidation. We used linear microelec-
trode arrays to study their intracortical organization in humans. We found that spindles could be divided into two types. One
mainly engages upper layers of the cortex, which are considered to be specialized for associative activity. The other engages both
upper and middle layers, including those devoted to sensory input. The interaction of these two spindle types may help organize
the interaction of sensory and associative aspects of memory consolidation.
normal NREM sleep (Lu¨thi, 2014). Recent evidence supports a role for spindles in organizing replay of prior events as critical step in memory consolidation (Mednick et al., 2013; Rasch and Born, 2013). The basic neurophysiological mechanism of spindle generation involves intrinsic T and H currents in thalamic neu- rons and reciprocal connections between inhibitory cells in the thalamic reticular nucleus and bursting thalamocortical neurons (McCormick and Bal, 1997; Lu¨thi, 2014). The thalamocortical cells project this rhythmic activity onto pyramidal cells, inducing currents that are then the proximal cause for spindles recorded in cortical local field potentials (LFPs), EEG, and the MEG.
Spindles were originally considered to be global thalamocor- tical events. As measured with scalp EEG in humans (Dehghani et al., 2010, 2011a) or on the cortex of anesthetized cats (Contreras et al., 1996), spindles tend to be widespread and highly synchro- nous. Spindle synchronization is thought to arise from cortical feedback to the thalamic rhythm generators, as decortication leads to desynchronization of thalamic spindles (Contreras et al., 1996), and this mechanism is supported by computational mod- eling (Bonjean et al., 2012). Recent evidence, however, suggests that spindles are not homogeneous. Whereas scalp EEG spindles tend to be distributed and synchronous, simultaneous MEG measurements have found them to be asynchronous and focal (Dehghani et al., 2010, 2011a). This is consistent with intracranial recordings, which find that most, but not all, sleep spindles occur locally (Andrillon et al., 2011; Piantoni et al., 2017).
The thalamocortical projection is known to be organized into two systems: “core” focal projections and diffuse “matrix” pro- jections (Jones, 1998; Zikopoulos and Barbas, 2007), suggesting that local and global spindles may be mediated by core and matrix systems, respectively (Piantoni et al., 2016). Because core and matrix systems project differentially to different cortical layers (Zikopoulos and Barbas, 2007), this implies that different spin- dles would evoke different intracortical laminar profiles of LFPs.
Early work in cats suggested that the intracortical physiology of spindles was similar to recruiting responses, diffuse long-latency, gradually increasing cortical potentials to stimulation of nonspe- cific thalamic nuclei at
⬃10 Hz (Dempsey and Morison, 1941; Li et al., 1956). However, Spencer and Brookhart (1961) also found patterns resembling augmenting responses, focal short-latency, rapidly increasing cortical potentials to stimulation of specific thalamic nuclei at
⬃10 Hz, and suggested that both specific and nonspecific systems are engaged in spindle generation, often dur- ing the same spindle discharge. They recorded relative to a distant reference, which renders laminar localization of transmembrane currents problematic (Kajikawa and Schroeder, 2011). Kandel and Buzsa´ki (1997) reported that the main laminar pattern of spindles in unanesthetized rats resembled augmenting responses, but mentioned that other patterns were also present. Thus, these earlier studies, while suggestive, are limited in either their tech- nical implementation or focus and, in any case, were in different species, which may have differently organized sleep spindles. We report here what appears to be the first description of laminar profiles of spontaneous sleep spindles, recorded using linear mi- croelectrode arrays in epilepsy subjects, focusing on the question of multiple spindle generators.
Materials and Methods
Participants and data collection.Five subjects (15– 42 years old; 3 female;
Fig. 1) with long-standing pharmaco-resistant complex partial seizures participated after fully informed consent according to the Declaration of Helsinki guidelines as monitored by the local Institutional Review Boards. Subdural grid and strip electrode arrays were placed to confirm
the hypothesized seizure focus, and locate epileptogenic tissue in relation to essential cortex, thus directing surgical treatment. The decision to implant, the electrode targets, and the duration of implantation were made entirely on clinical grounds without reference to this research.
NREM sleep was detected by the prevalence of generalized slow rhythms and spindles in cortical and scalp electrodes.
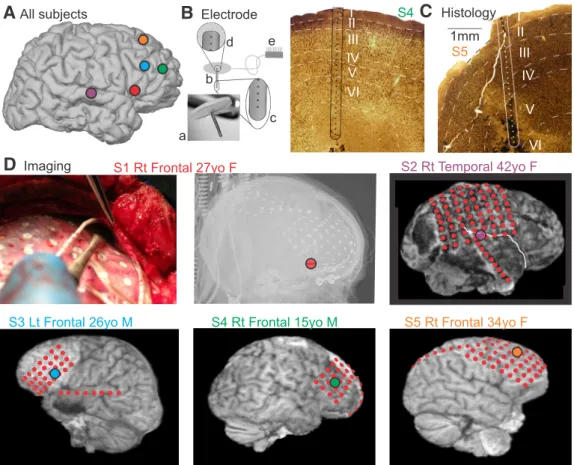
Electrodes and localization. A laminar microarray containing 24 90%Pt/10%Ir contacts, each 40m in diameter, at 150m center-to- center spacing (Ulbert et al., 2001), was placed under the grid in cortex that had been previously identified as probably epileptogenic, in the center of the likely surgical target in the frontal or temporal association cortex (Fig. 1A,B,D). Gyral localization was based on direct visualization during surgery in all subjects, supplemented with transmission x-ray (Subject 1), or structural MRI with electrodes in place (Subjects 2–5).
Localization with respect to cortical lamina was based on surgical pro- cedure and electrode design, confirmed by histology in 2 subjects (Fig.
1C). The neurosurgeon placed the electrode under direct visualization, perpendicular to the cortical surface. The electrode is designed with a thin Silastic flap, which adheres by surface tension to the pial surface, and the electrode is kept in place because it is underneath the clinical grid and dura. The micro-contacts are positioned at fixed distances from the un- derside of the Silastic flap, constraining their distance from the pial sur- face. Specifically, the first contact was centered⬃150m below the pial surface, and the 24th contact at⬃3600m below the pial surface. Al- though this does not allow absolute localization of the contacts with respect to cortical lamina, it does permit their correspondence to be estimated from previous measurements of laminar width in human cor- tex (Hutsler et al., 2005).
In 2 of the 5 subjects, it was possible to removeen blocthe cortex immediately surrounding the microelectrode array at the therapeutic cortectomy. Histological analysis of the microelectrode tracks was per- formed as described previously (Csercsa et al., 2010). Briefly, tissue blocks were fixed with 4% PFA, 0.1% glutaraldehyde, and 0.2% picric acid in 0.1Mphosphate buffer (PB). Sixty-micron-thick sections were cut with a Vibratome, thoroughly washed with PB, immersed in 30% sucrose for 1–2 d, and then frozen three times over liquid nitrogen. Endogenous peroxidase was blocked by 1% H2O2in PB for 10 min. Nonspecific immunostaining was blocked by 5% milk powder and 2% BSA. Mouse monoclonal antibody against the neuronal marker NeuN (1:3000, Milli- pore Bioscience Research Reagents) was used for 2 d. For visualization of immunopositive elements, biotinylated anti-mouse IgG (1:300, Vector Laboratories) was applied, followed by avidin-biotinylated HRP com- plex (ABC; 1:300, Vector Laboratories). The immunoperoxidase reac- tion was developed by DAB (Sigma-Aldrich), as a chromogen. Sections were then osmicated (0.25% OsO4in PB) dehydrated in ethanol, and mounted in Durcupan (ACM, Fluka).
Considering a larger sample of patients with laminar electrodes, his- tological localization of laminar electrode contacts was available in 9 subjects, 2 of which (Subjects 4 and 5) are included in this paper. Surgical constraints did not allowen blocresection of the implantation site in the other subjects. The 9 subjects with histology include one that was (inten- tionally) placed in a tuber, and 1 that was not perpendicular to the surface (Subject 5 of the current paper). Omitting these 2 subjects, the mean⫾ SD of the center contact in each layer were as follows: layer 1, contact 1.00⫾0.00; layer 2, contact 3.43⫾0.53; layer 3, contact 7.00⫾1.00;
layer 4, contact 10.14⫾1.21; layer 5, contact 14.00⫾2.00; and layer 6, contact 19.14⫾3.39. The insertion point of the electrode in Subject 5 was displaced from the crown of the gyrus and thus was at an angle to the cortical layers. Consequently, the central contacts of the layers in this subject were as follows: layer 1, contact 2; layer 2, contact 5; layer 3, contact 10; layer 4, contact 14; layer 5, contact 21; and layer 6, not sam- pled. The electrode tracks in all of the other 8 subjects were perpendicular to the layers, and the surgeon in Subjects 1– 4 of the current paper at- tempted to place the electrodes in the gyral crown. Given the consistency of the overall histological results, and the lack of individual histological localization in three of the 5 subjects, we elected to analyze the data with respect to contact, and to use the minimal labels of “upper,” “middle,”
and “lower” rather than the 6 canonical layers. Channels 1– 4, labeled
“upper” would include layer 1 and parts of layer 2; channels 10 –14,
labeled “middle” would include layer 4 and parts of surrounding layers;
channels 20 –23, labeled “deep” would include layer 6 in most subjects.
This conservative approach is based on the known contact-layer relation- ship imposed by the physical constraints of the implantation and elec- trode design, and confirmed by histological analysis when available. Data are thus presented as averages by channel across subjects (seeFigs. 3,4,7, 8), as well as individual subject data to permit variability to be evaluated (seeFigs. 5,6,8). This approach is further validated by the similarity of the laminar LFP gradient (LFPg) and current source density (CSD) pro- files across subjects (seeFig. 5).
Recordings and preprocessing.LFPg recordings were made from 23 pairs of successive contacts. After wideband (DC 10,000 Hz) preamplifi- cation (gain 10⫻, CMRR 90db, input impedance 1012ohms), the signal was split into LFPg (filtered at 0.2–500 Hz, gain 1000⫻, digitized at 2000 Hz, 16 bit) and action potentials (filtered at 200 –5000 Hz, gain 1000⫻, digitized at 20,000 Hz, 12 bit), and stored continuously. Differential recording permitted adequate signal-to-noise ratio on active wards due to high common mode rejection ratio of radiated noise common to adjacent leads (Ulbert et al., 2001). Furthermore, modeling studies dem- onstrate that the LFPg between contacts at 150m centers assures that activity is a reliable probe of locally generated activity, unlike referential LFP (Kajikawa and Schroeder, 2011). CSD is also reliably local but is a derived measure with multiple assumptions (e.g., radial symmetry of the generator around the electrode track, and constant extracellular conduc- tivity) and more susceptible to noise, gain equalization, and other instru- mentation issues. Consequently, both LFPg and CSD data are displayed.
Data were collected in an Epilepsy Monitoring Unit during naturally occurring nocturnal sleep. Epochs were chosen for analysis when the patient was behaviorally asleep and widespread slow waves (␦activity) were present in the electrocorticogram, identifying NREM sleep, includ-
ing both Stages N2 and N3 because both include sleep spindles (Andril- lon et al., 2011;Mak-McCully et al., 2017;Piantoni et al., 2017), and to increase comparability to rodent studies where the N2/N3 distinction is not clear. An average of 50 min sleep (SD⫽21, range⫽16 – 67) was analyzed per subject.
The recordings often exhibit various electrical artifacts, for example, caused by the participant changing head position. Being epilepsy sub- jects, abnormal spiking activity is also possible. Furthermore, defective electrode contacts result in unusable recordings from two adjacent dif- ferential amplifier channels. To handle such artifacts, laminar electrode data were preprocessed to filter line noise, exclude high-amplitude spikes, and replace “bad” channels through interpolation and slight spa- tial smoothing. To suppress line noise, a notch filter was applied (zero phase shift, frequency domain), with a stop frequency of 50 or 60 Hz (depending on acquisition site) and a transition band equal to 30% of the stop frequency. This means that, for a stop frequency of 50 Hz, oscilla- tions between 50 and 65 Hz were gradually attenuated, until being com- pletely passed⬎65 Hz. “Bad” channels, which typically exhibit frequent, high-amplitude artifacts, usually occurring with opposite polarity in two adjacent channels, were identified visually for each laminar recording (i.e., the time series data collected with a laminar electrode array for a single subject). There were between 2 and 10 of these bad channels in each recording (mean⫽5.4, SD⫽3.0; S1: [17, 18]; S2: [13, 14, 22, 23];
S3: [1, 3, 4, 12, 13, 15, 16, 19, 20, 23]; S4: [13, 14, 18, 19, 23]; S5: [7, 10, 16, 17, 19, 20]). Time windows of high-amplitude fluctuations were ex- cluded using a manually determined masking threshold. For each lami- nar recording, time series data were visually reviewed (excluding “bad”
channels) and a threshold value was chosen to be greater than the normal fluctuations from the mean but less than the sharp, high-amplitude de- viations from the mean. This threshold was applied to create a binary
S1 Rt Frontal 27yo F S2 Rt Temporal 42yo F
S3 Lt Frontal 26yo M S4 Rt Frontal 15yo M S5 Rt Frontal 34yo F I II III
IV V VI III
III IV V VI
S4
S5 All subjects
A B
ElectrodeC
HistologyD
Imaginga b
c
d e 1mm
Figure 1. Electrode localization.A, Approximate locations of laminar probes are mapped on a standard right hemisphere.B, The laminar microarray.Ba, Photograph.Bb, Schematic of the entire array (3600m long, 350m diameter), and Silastic flap placed on the cortical surface.Bc, Closeup of tip showing the five deepest contacts (each 40m diameter, on 150m centers).Bd, Closeup of the three most superficial contacts.Be, Connector to amplifiers.C, Histology of the implant sites in 2 subjects, stained with NeuN.D, Imaging of electrode locations, showing placement of the laminar probe under direct visualization in Subject 1 together with postimplant x-rays, and postimplant MRIs in Subjects 2–5. The hemisphere and lobe implanted, age, and gender of the 5 subjects are also shown.
(0 or 1) time series mask. Time points within 2 s of threshold crossings were set to 0, as were time windows⬍5 s in duration between poten- tial artifactual periods to eliminate periods with repeated abnormal activity. Data for bad channels were replaced by the weighted aver- age of neighboring, good channels, with weights that decrease with increasing spacing between channels according to an exponential decay function (decay constant⫽0.1 channel spaces). One-dimensional spatial smoothing was then applied across channels (Gaussian
⫽ 0.64 channel spaces, equivalent to FWHM⫽1.5). This slight spatial smoothing was applied to ensure gradual and continu- ous variation across channels, which is com- monly done to suppress false sources and sinks due to slight signal fluctuations. An av- erage of 7.5% of the analyzed sleep period (SD⫽6.4%, range⫽2.1%–16.4%) was re- jected per subject.
Spindle detection.Spindles were detected us- ing custom methods developed to accommo- date the observed characteristics of spindles in laminar potential gradient recordings. The spindle detection algorithm, described in detail below, was based on the standard criterion of sustained power in the spindle band (Andrillon et al., 2011). Sensitivity was increased by relax- ing amplitude and duration criteria, whereas selectivity was maintained by adding rejection criteria from adjacent bands (Mak-McCully et al., 2017), and validating with visual inspection (Fig. 2). Time courses of spindle-band ampli- tude were calculated by applying to the mini- mally processed single-channel LFPg (Fig. 2B), a zero-phase shift, frequency domain, band- pass filter (10 –16 Hz;Fig. 2C), with transition bands equal to 30% of the cutoff frequencies.
These cutoff frequencies were chosen as a com- promise between the current clinical standard of 11–16 Hz (Silber et al., 2007), and previous publications describing sleep spindles using 9 –15 Hz (Andrillon et al., 2011;Piantoni et al., 2017) or 10 –16 Hz (Mak-McCully et al., 2017).
Absolute values of the filtered data were smoothed across time by convolving with a ta- pered cosine (Tukey) (Harris, 1978) window (width⫽300 ms, ratio of cosine taper to con- stant region⫽0.5;Fig. 2D). To account for between-channel differences in spindle-band amplitude, channel-specific, median values of spindle band amplitudes were subtracted from each channel. Offset spindle-band am- plitudes were then normalized by dividing by a robust estimator of the SD (rSD: the me-
dian absolute deviation divided by 0.6745). To preserve relative dif- ferences in spindle amplitudes between channels, rSD values were averaged across channels and then applied as a uniform normaliza- tion factor.
Potential spindles were identified independently for each channel by finding peaks in the normalized spindle-band envelope time courses with amplitudes⬎1. Spindle onset and offset were estimated by finding the nearest time points before and after the peak of the spindle-band enve- lope with amplitudes⬍1. Possible spindles were excluded if the esti- mated spindle durations were⬍200 ms. Epochs containing a possible spindle in one or more channel were then identified, and the overall spindle epoch onset and offset were estimated as the earliest onset and the latest offset across channels.
To avoid filtering artifacts, such as ringing, and to adequately account for the reported variation in spindle frequency, a relatively broad band- pass filter was used to identify spindle epochs. Consequently, this method is sensitive to high-amplitude, transient increases in power at frequencies that are slightly lower or higher than the spindle range of 10 to 16 Hz. For this reason, we excluded events with relatively high amplitude in lower and higher frequency bands. To exclude such epochs, low-band (4 – 8 Hz) and high-band (18 –25 Hz) time courses were calculated as described above for the spindle-band, except with different bandpass filters (Fig.
2D). Epochs were rejected if they contained low- or high-band ampli- tudes⬎5 (relative to the rSD of low- or high-band amplitude) between the supposed spindle onset and offset in any of the channels containing a supposed spindle for that epoch. This strategy also rejected theta bursts, -2
0 2 4 6 8
A Laminar Local Field Potential gradient (LFPg)
B Minimally processed single-channel LFPg
C Spindle-band filtered LFPg (10-16 Hz)
D Band-pass filtered LFPg envelopes
normalized amplitude
upper layersdeep layers
spindle (10-16 Hz) high (18-25 Hz)
low (4-8 Hz)
1s
1mV/mm 200µV/mm 1mm
middle layers
S1
-
+
1 2 3 4
spindle
spindle
rejected rejected downstat e
downstat e
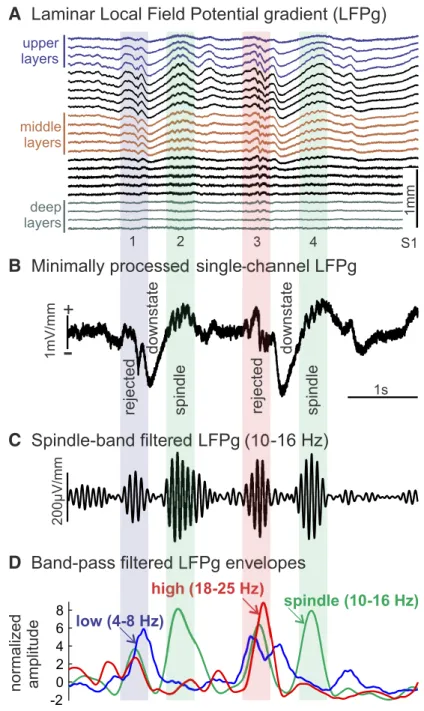
Figure 2. Spindle detection.A, Example of laminar recordings of two spindles (2, 4) following downstates. The first spindle is clear in both upper channels (blue traces) and middle channels (brown traces), whereas the second is only clear in middle channels.
Data were minimally preprocessed: 60 Hz notch filter, interpolation to replace bad channels and slight spatial smoothing.B, Spindles detected in one middle channel are marked with green background. Potential spindle events were rejected for excessive low-frequency (blue bar, event 1) or high-frequency (red bar, event 3) power.C, Bandpass filtered data in spindle band (10 –16 Hz) from middle layer channel.D, Normalized amplitude envelopes of low- (4 – 8 Hz), spindle-, and high-band (18 –25 Hz) oscillations.
which have a frequency profile that often extends into spindle range, and can be seen to occur before downstates inFigure 2A, whereas spindles occur after downstates.
Spindle identification inevitably results in false-positives and false- negatives, especially near the detection threshold. False-negatives are a particular concern in evaluating spindle spread between layers, where they could result in an underestimation of the degree of intracolumnar spread. To determine whether characteristics of spindles were robust to the choice of detection threshold, we initially used a relatively low am- plitude threshold to detect spindles in as many channels as possible, and then repeated our analyses including only spindles with overall ampli- tudes above the median. The overall amplitude of a given spindle epoch was defined in this context as the maximum across channels of the peak spindle-band amplitude. Spindle co-occurrence rates for both analyses are reported, but our primary analyses focused on the “strong” spindles with amplitudes greater than or equal to the median amplitude. An av- erage density of 13.1 strong spindles per minute (SD⫽2.0, range⫽ 10.5–15.8) were detected across subjects.
CSD.Population trans-synaptic current flows were estimated using CSD analysis (Nicholson and Freeman, 1975). As preprocessing specific to CSD calculations, additional one-dimensional smoothing, was ap- plied across channels (⫽0.85, FWHM⫽2). CSD time courses were then calculated from the smoothed LFPg data by applying a regularized inverse (signal-to-noise ratio⫽20) matrix operator calculating the sec- ond spatial derivative (Pettersen et al., 2006). The equivalent current dipole was calculated from the estimated CSD by essentially calculating a distance-from-center weighted average of the CSD, implemented using trapezoidal integration. One-dimensional CSD assumes that the extra- cellular tissue conductance does not change over the sampled trajectory, and that the transmembrane currents are symmetrical around that trajectory.
Phase amplitude coupling.Spindle epochs were sorted into two groups based on detection in upper channels but not middle, or in middle chan- nels but not upper. For each channel group, a reference channel was selected based on highest fraction of spindles detected for a given record- ing. We define the fraction of spindles detected as the number of spindles detected in a given channel relative to the total number of spindles de- tected in any channel. Centered on each spindle (with spindle epoch center determined by the average of estimated epoch onset and offset), 4000 ms epochs were filtered for three different frequency bands (spin- dle: 10 –16 Hz; low gamma: 25–50 Hz; high gamma: 70 –170 Hz) using a zero-phase shift, frequency domain, bandpass filter, with transition bands equal to 30% of the cutoff frequencies. Amplitude and phase were obtained from the Hilbert transformation. To avoid edge artifacts, and to limit analysis to the stronger part of the spindle, the epoch was then reduced to⫺400 to 400 ms relative to the center of each spindle epoch.
Spindle phase and gamma amplitudes were sampled from a single CSD- derived channel corresponding to the peak of the current sink. Spindle phases for each epoch were sorted into 32 bins (10 degrees) and low and high gamma amplitudes were averaged across time points within each phase bin.
To visualize this phase amplitude relationship (seeFig. 4), spindle time courses and low and high gamma amplitude were averaged across epochs for each channel, time-locked to the largest spindle-band peak in the channel with the highest fraction of spindles detected, for epochs that were either in upper channels only or middle channels only, and then averaged across subjects (n⫽5). Gamma amplitudes were transformed intozscores before averaging across subjects, using the average and SE of gamma power across all epochs between⫺400 and 400 ms of spindle center.
Phase differences between channels.Spindle epochs were selected based on detection in both upper channels and middle channels. One reference channel was selected for each channel group, as described above for phase amplitude coupling analysis. The average phase difference for each sub- ject was calculated for the selected upper channel relative to the middle channel. Each spindle epoch was recentered in time to the highest am- plitude spindle peak in the selected middle channel for that epoch. In- stantaneous phase was derived from Hilbert transforms of bandpass filtered (10 –16 Hz) waveforms. Phase differences were calculated at each
time point by subtracting the instantaneous phase value of the middle channel from the instantaneous phase value of the upper channel. Phase differences between⫺200 ms and 200 ms were averaged using the circu- lar mean (circ_mean) function of the CircStat MATLAB Toolbox (Be- rens, 2009). These average phase differences were then averaged across epochs, again using a circular mean. Because the polarity of LFPg mea- surements in individual channels depend on that channel’s position rel- ative to sources and sinks, two channels with opposite polarity will exhibit a phase difference approaching half a cycle that has no signifi- cance for the evaluation of phase delays between layers. Consequently, we interpreted phase differences approaching a half cycle as reflecting an uninformative polarity inversion, superimposed on the true phase lag in one channel relative to another. For this reason, for phase differences that were⬍⫺0.25 cycles or⬎0.25 cycles, an additional 0.5 cycles were added or subtracted, respectively, from the calculated phase difference (for Sub- jects 2, 3, and 5).
Experimental design and statistical analysis.Epochs containing laminar recordings of spontaneously occurring spindles were detected in slow wave sleep in 5 subjects. In addition to describing these unique record- ings, with standard descriptive statistics, we performed the following statistical analysis to determine whether gamma amplitude is modulated by spindle phase. The Modulation Index (MI) was calculated as de- scribed by Tort et al., 2010, from the phase amplitude-coupling (gamma amplitude for each phase bin). Bootstrap resampling across epochs with 2000 iterations was used to estimate 95% CIs for MI (Efron, 1981).
Although these measures are ideally zero under the null hypothesis, spu- rious, non-zero, phase amplitude relationships can occur. To estimate the rate at which this occurs, we generated a highly conservative, upper- bound null hypothesis value using the upper 95th percentile value of MI calculated with phase information scrambled across epochs. On each of 100 iterations, gamma amplitudes of each epoch were assigned to the spindle phases of a randomly chosen epoch, based on random permuta- tions of the epoch order. MI was calculated for each of these permuta- tions, forming a distribution to represent the null hypothesis. The 95th percentile value of this distribution was estimated from the mean plus twice the SE. The bootstrap CIs were then compared with this upper- bound null value in the calculation ofpvalues. Separate analyses were performed for spindles, which were limited to either upper or middle channels.
When spindles occurred in both middle and upper channels, then a one-samplettest was performed with one value from each subject to compare the latency of spindle onset (as described above). These laten- cies were determined in each co-occurring spindle individually, the signed differences obtained, and averaged across all such spindles for that subject, and the resulting mean was used for thettest. The same proce- dure was used to compare the latency to peak in upper versus middle channels. Pairedttests with two values from each subject were used to compare the proportion of spindles detected in upper channels that also occurred in middle channels, to the proportion of spindles detected in middle channels that occurred in upper.
Principal component analysis (PCA) was performed on the data for each subject using singular value decomposition (SVD), as implemented in the runpca function included in the EEGlab toolbox (Swartz Center for Computational Neuroscience, La Jolla, CA). Input data were spindle- band (10 –16 Hz) filtered laminar time series data, concatenated across spindle epochs, with time points before and after the estimated spindle onsets and offsets excluded. Spatiotemporal patterns of spindle compo- nents were visualized by calculating average spindle time courses for each of the first two principal components. For these calculations, the Eigen- vectors and Eigenvalues returned by the PCA analysis for each of the two components were individually applied to the spindle-band filtered data to obtain sensor-space time courses for each component. Spindles were averaged across epochs, time-locked to the largest spindle peak in each epoch, and then averaged across subjects. The Eigenvector returned by PCA for a given component is a set of weights for each laminar channel.
The sign of the Eigenvector being arbitrary and variable across subjects, we flipped the sign, if necessary, to make the mean of the channel weights for a given Eigenvector to be positive, allowing for a meaningful group average.
Limitations.This study is limited by the relatively small sample size, due to stringent clinical and technical requirements. Also, because these recordings are only performed in subjects with intractable epilepsy, close to the seizure focus, the generalizability of these results is a concern.
However, we eliminated from consideration recordings with abnormal background activity, as well as epochs with epileptiform transients, or sessions following electrographic seizures. Another limitation is un- avoidable ambiguities in spindle detection. We avoided false-positives by excluding events that had relatively high amplitude in lower- or higher- frequency bands. Conversely, avoiding false-negatives is important to accurately detect co-occurrence across channels. We used a relatively low initial threshold to detect spindles in as many channels as possible, but then excluded the spindle epochs in which the maximum amplitude in any one channel was below the median. We found that the weaker “spin- dles” had very low co-occurrence across channels. Given the laminar arrangement of channels, a true spindle occurring in one channel should also very likely be observed in neighboring channels, indicating that many of those weaker spindles were likely chance occurrences in single channels.
Results
Laminar electrode recordings collected from 5 human epilepsy subjects were included in the current study (see Data collection).
Laminar recording sites were located in either frontal or temporal lobes. Epochs containing a spindle in at least one of the 23 lami- nar channels were identified based on the amplitude envelope of bandpass filtered activity between 10 and 16 Hz (see Spindle de- tection; Fig. 2). The maximum spindle amplitude across chan- nels was calculated for each putative spindle epoch we detected. To reduce the possibility of including nonspindle events in our analyses, epochs with maximum amplitudes less
than the median maximum amplitude were excluded from our primary analyses. Spindles were visible in the raw traces, often following K-complexes (Cash et al., 2009) or downstates (Csercsa et al., 2010). Typically, distinct LFPg profiles were noted for downstates versus spindles, but this was not quanti- tatively examined (Fig. 2A).
The laminar profile of spindle amplitudes varied considerably across spindle epochs. Some spindles were restricted to a few adjacent channels in either the upper range (e.g., channels 1– 4) or the middle range (e.g., 10 –14), although many spindles were detected simultaneously in both upper and middle channels (Fig.
3A). Averaged across epochs, spindle amplitude was greatest in middle channels (average normalized spindle amplitude: 3.5
⫾0.2 SEM,
n⫽5), slightly weaker in upper channels (2.3
⫾0.1 SEM), and weaker still in deep channels (1.2
⫾0.4 SEM) (Fig.
3B). Laminar variation in the likelihood of detecting a spindle was closely related to spindle amplitude, with most frequent de- tection in middle channels (average fraction of spindles detected:
0.72
⫾0.04 SEM), somewhat reduced frequency of detection in upper channels (0.52
⫾0.03 SEM), and further reduced fraction of spindles detected in deep channels (0.25
⫾0.10 SEM).
Most spindles were detected simultaneously in multiple chan- nels, often with substantial spatial separation between the chan- nels (Fig. 3C). For the higher amplitude, “strong” spindles, laminar recordings exhibited distinctive patterns of spindle co- occurrence (i.e., the rate at which a spindle was detected in a pair of channels in the same epoch). For epochs excluded based on lower than median amplitudes, co-occurrence was much lower, such that “weak” spindles were often detected in only one chan-
upper
middle
upper+middle
channel
channel
normalized amplitude
upper only middle only upper + middle
5 10 15 20
upper middle
upper + middle other
channel
channel
5
20
channel
weak (< median) .8 .4 0 upper
middle
lower
0 1 2 3 4
100%
50 50%
0 0
A
Example bandpassed spindles (10-16Hz; LFPg)B
Spindle amplitudeD
Relativeco-occurrence
E
Proportion of total spindlesC
Spindle co-occurrence 14 10 14
1 23
1
23 1
23
co-occurrence with upper spindles
co-occurrence with middle spindles S1
S2
S3
S4
S5
1
23
uppermiddle
-200 0 200ms
channel
-200 0 200 -200 0 200
strong (>median)
sink
source
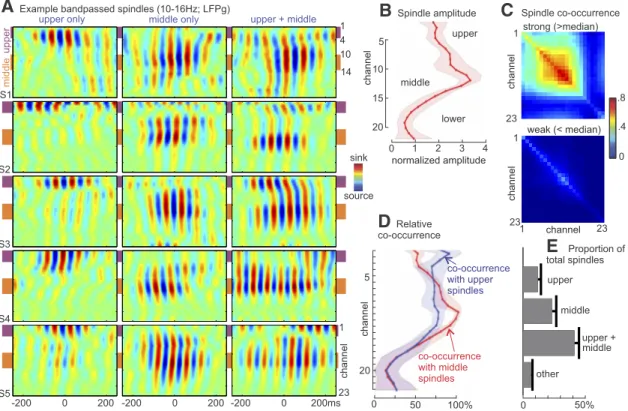
Figure 3. Spindle amplitudes and occurrence across channels.A, Examples of spindle activity (bandpass filtered, 10 –16 Hz) detected in upper channels only, middle channels only, or both upper and middle channels. Each plot is normalized to its maximum absolute value.B, Group average (n⫽5) of peak normalized spindle-band amplitude averaged across all epochs for each channel.
Shaded region represents 95% CI (1.96⫻SEM).C, Top, Spindle co-occurrence matrix for “strong” spindles, with maximum amplitude greater than the median. Bottom, Co-occurrence matrix for
“weak” spindles. Displayed values represent the number of “strong” or “weak” spindles detected in a given channel or pair of channels divided by the total number of “strong” or “weak” spindles detected in any channel for a given subject. Thus, the diagonal indicates the proportion of total spindles that included that particular channel. The plot suggests that strong spindles usually involved multiple middle channels, whereas weak spindles tended to occur in a single channel.D, Relative co-occurrence rates for epochs containing a spindle in either upper or middle channels.E, Group average of the fraction of spindles detected in upper channels only, middle channels only, upper and middle channels, or other channels.
nel at a time. For spindles detected in upper channels (selected for each laminar recording based on highest fraction of spindles de- tected among channels 1– 4), spindles were found to co-occur in middle channels more than half the time (0.76
⫾0.04 SEM; Fig.
3D). For spindles detected in middle channels (channels 10 –14), spindles co-occurred in upper channels slightly less often (0.55
⫾0.03 SEM; difference from upper-detected channels
p⫽0.015, paired
ttest; Fig. 3D). Spindles occurred in both upper and mid- dle channels approximately half of the time but sometimes oc- curred in only upper or only middle channels, demonstrating a degree of independence of occurrence (Fig. 3E).
We characterized the current sources and sinks associated with spindles detected in either upper or middle channels. The transmembrane currents generating the spontaneous spindle os- cillations were estimated from the LFPg using CSD analysis (see CSD). We used phase amplitude coupling between spindle oscil- lations and gamma band amplitude to identify the spindle phase related to active current sinks, reflecting the increase in firing related to excitatory synaptic input (see Phase amplitude cou- pling). The laminar distribution of sources and sinks associated with spindles detected in either upper or middle channels, aver- aged across subjects, is shown in Figure 4. To visualize phase amplitude relationships, spindles were averaged across epochs, time-locked to the largest spindle peak in a reference channel chosen from the upper or middle channels based on having the highest fraction of spindles detected in that range.
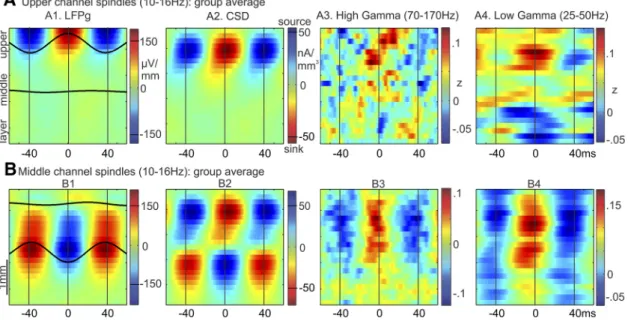
For spindles detected in upper channels only, a positive peak in the LFPg corresponded to a current sink (negative CSD) in upper layers (e.g., 1 or 2/3; Fig. 4A2). For spindles detected in middle channels only, a negative peak in the LFPg corresponded to a current sink in upper layers and a current source in deep layers (Fig. 4B2). For each, around the time of those spindle peaks, there was an increase in both high gamma power (70 –170 Hz; Fig. 4A3,B3) and low gamma power (25–50 Hz; Fig. 4A4,B4 ).
For the upper channel spindles, there is the suggestion of a de- crease in high gamma in lower channels at the time of the upper
channel increase (Fig. 4A3), as has been found in rat medial pre- frontal cortex (Peyrache et al., 2011). The coupling between spin- dle phase and high gamma amplitude, summarized by MI, was significantly different from the null (
p⬍0.05, bootstrap resam- pling) in 4 of the 5 subjects for upper channel spindles and for 3 of 5 for middle channel spindles (Table 1). LFPg and CSD patterns for upper and middle channel spindles varied across subjects but showed overall consistency in the source/sink patterns (Fig. 5). For 2 subjects, there was an additional current source in the uppermost channels (Fig. 5A, S1 and S3), suggestive of a return current in layer I. Its apparent absence in the other 3 subjects may reflect variation in the thickness of this layer. Overall, these results suggest that excit- atory input to upper layers can results in at least two different pat- terns of current sinks and sources, manifesting as positive LFPg peaks in upper channels or negative LFPg peaks in middle channels.
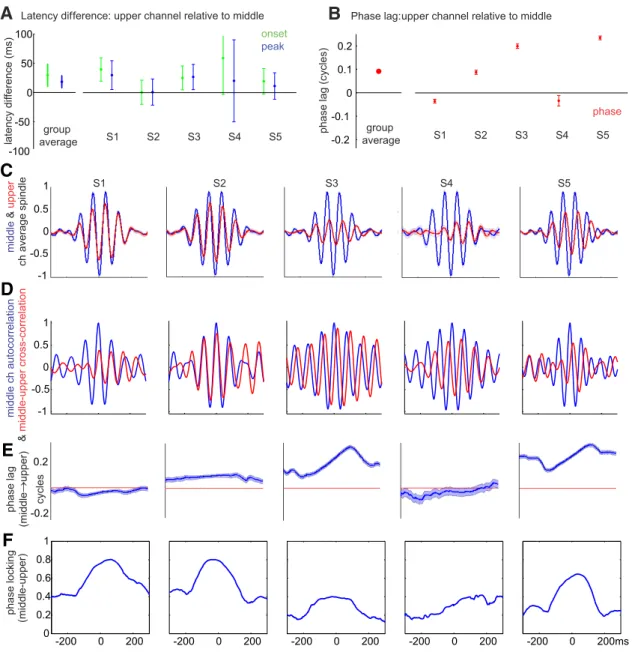
We analyzed the relative timing and phase relationship be- tween upper and middle channels for spindles detected simulta- neously in both. One upper and one middle channel were selected for each subject based on maximum fraction of spindles detected in each range of channels (i.e., 1– 4 and 10 –14). Latencies of the
Figure 4. Laminar sources of spindle oscillations.A1, Group average of waveforms that had been averaged across epochs and individual peaks (bandpass filtered, 10 –16 Hz), time-locked to spindle peaks in the upper channel (channels 1– 4) with the highest spindle rate for each subject. Only above-median upper channel spindle epochs were included. Waveforms are superimposed on a time-amplitude plot of LFPg in the same epochs. Time-amplitude plots from these epochs are also shown for the following:A2, CSD.A3, High gamma (70 –170 Hz) amplitude.A4, Low gamma (25–50 Hz) amplitude.B, The same plots are shown, except in this case averages were made for middle channel spindle epochs time-locked to the middle channel (channels 10 –14) with the highest spindle rate for each subject.Table 1. Modulation of high gamma by spindle phase: statistical results of comparison with the null distribution using bootstrap resamplinga
Upper channel spindles Middle channel spindles
Subject No. of epochs
Normalized modulation
index pvalue
No. of epochs
Normalized modulation
index pvalue
1 81 2.03 0.0075 175 0.93 0.22
2 134 5.34 0.0005 93 3.26 0.001
3 85 3.85 0.001 246 4.46 0.0005
4 19 0.37 0.78 80 1.94 0.051
5 46 1.67 0.041 139 3.32 0.0015
aThe normalized MI is a ratio that compares the calculated MI with the reference distribution calculated under the null hypothesis of no phase relationship.pvalues were derived from bootstrap sampling of MI compared with the null for each of five recordings obtained from 5 different patients. The number of epochs varied across recordings, limited by factors, such as the duration of good quality recording and the respective incidence of spindles in either the upper or middle channels but not both.
onset of spindle epochs and peak of spindle-band activity were estimated from the smoothed, spindle-band amplitude envelope (see Spindle detection). Between-channel onset and peak latency differences were averaged over epochs (mean: 243 epochs, SD:
113, minimum: 69, maximum: 361). Because onset detection based on fixed thresholds could be biased by differences in the amplitudes of the signals, the threshold chosen for each channel and epoch was half of peak spindle amplitude. Based on the Hil- bert transform analytic amplitude (i.e., amplitude envelope), spindle onset and peak latency tended to be delayed in upper channels (onset latency difference: 29.4
⫾10.1 ms SEM,
p⫽0.028, one sample
ttest; peak latency difference: 18.2
⫾5.4 ms SEM,
p⬎0.05, one sample
ttest) (Fig. 6A).
Phase differences of individual waves between upper and mid- dle channels were derived from Hillbert transforms of spindle band (10 –16 Hz) filtered epochs, averaged across time points between
⫺200 and 200 ms relative to spindle peak, and averagedacross epochs (see Phase differences between channels). The group average phase lag was not significantly different from zero (
p⬎0.05, one-sample test for the mean angle, using circ_mtest from CircStat Toolbox). The individual subject phase lags were significant for four of the 5 subjects (p
⬍0.05, one-sample test for the mean angle, using circ_mtest from CircStat Toolbox) (Fig.
6B). To examine this relationship, the average of upper layer spindles relative to middle layer (Fig. 6C), their cross-correlation (Fig. 6D), and the time course of their phase lag (Fig. 6E) and phase locking (Fig. 6F ), were calculated and plotted for each subject across all spindles. Although the patterns varied for un- known reasons, in some subjects, a consistent delay is observed that varies over the course of the spindle. Varying phase lags could be indicative of differences in oscillation frequency. To correct for apparent polarity inversion, we added or subtracted a half cycle of phase if the phase delay was more than one-fourth
cycle from zero in Figure 6B–E. However, due to intersubject variability, it is difficult to draw strong conclusions about the directionality of the phase difference between upper and middle channels.
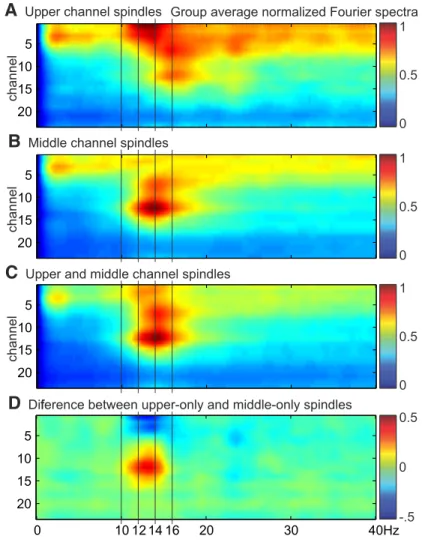
From the group average Fourier spectra, there appears to be a slight decrease in oscillation frequency for upper channel spin- dles (Fig. 7). However, differences between upper and middle channels in the peak spindle frequency during upper only or middle only spindles, respectively, were not significant (upper mean: 13.9 Hz, SD: 1.0, middle mean: 13.0 Hz, SD: 1.5,
p⬎0.05, paired
ttest).
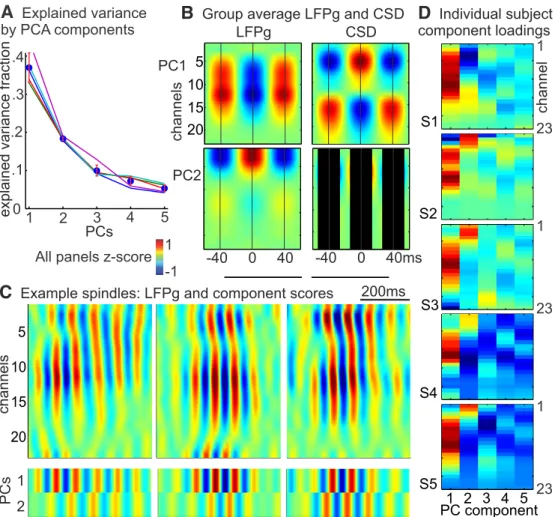
To analyze the spatiotemporal variation both across and within spindle epochs with a data-driven approach, we used PCA to transform spindle-band activity from the 23 laminar channels into temporally uncorrelated components (Fig. 8). Spindle-band filtered data from all spindle epochs (excluding “weak” spindles), delimited by estimated spindle onsets and offsets, were concate- nated into one large matrix of channels by time points. The shape of the scree plot, showing the explained variance for each com- ponent, suggests that a two factor solution is appropriate (Bryant and Yarnold, 1995). The first two principal components (PCs) accounted for approximately half of the explained variance (Fig.
8A). The patterns of LFPg and CSD for the first PC (Fig. 8B) was
very similar to that of spindles time-locked to middle channels
(Fig. 4B), and the second PC was very similar to the upper chan-
nel spindles (Fig. 4A). These patterns are based on the component
loadings, which were strong and highly similar across subjects for
principal components 1 and 2, but weak and variable for later
components (Fig. 8D). However, it is possible that, with a larger
dataset, additional consistent patterns could be identified across
multiple subjects. The degree of involvement of the first two PCs
varied independently across epochs, and within epochs in which
both PCs had strong involvement, the different PCs combined in
Figure 5. Laminar sources of spindle oscillations in individual subjects.A, Individual subject (arranged left to right) waveforms averaged across epochs and individual peaks (bandpass filtered, 10 –16 Hz), time-locked to spindle peaks in the upper channel (channels 1– 4) with the highest spindle rate for each subject, with LFPg on top and CSD on bottom (both normalized to respective maximum values within each subject).B, Individual subject average waveforms time-locked to the middle channel (channels 10 –14) with the highest spindle rate for each subject.various ways that accounted for the large variation in the dy- namic laminar distribution of individual spindle epochs.
Discussion
Intracortical laminar recordings during sleep allowed us to inves- tigate the distribution of spindle occurrence across cortical layers.
We found that spindle amplitudes and the rate of occurrence was greatest in middle channels, slightly weaker in upper channels, and greatly reduced in deep channels. Individual laminar record- ings exhibited distinctive patterns of spindle co-occurrence, with spindles sometimes being detectable only in upper or only middle channels, but often occurring in both, and with spindle onset and peak latency delayed in upper channels by
⬃20 –50 ms on aver- age. There were slight differences in peak spindle band frequency for upper and middle channel spindles, but each was associated
with strong low-frequency (⬍4 Hz) power in upper channels.
Factor analysis (PCA) confirmed the impression of two main consistent patterns of CSD. In all subjects, the first and second principal components corresponded to the middle and upper channel spindles, respectively. These components accounted for approximately half of the explained variance, with subsequent components inconsistent and accounting for little variance.
These results establish the existence of two main spindle gen- erators. Because spindles are thought to be generated by the rhythmic activation of thalamic synapses onto cortical neurons, this implies that two thalamocortical systems are engaged by spindles, with differing laminar distributions of thalamocortical projections. It has previously been proposed that spindles can be generated by either or both of the two major thalamocortical
-200 0 200
-1 -0.5 0 0.5 1
-200 0 200
0 0.2 0.4 0.6 0.8 1
-200 0 200 -200 0 200 -200 0 200
-200 0 200 -200 0 200 -200 0 200 -200 0 200ms
& ch average spindlemiddleupper
S1 S2 S3 S4 S5
phase lag (middleupper) phase locking (middle-upper) -1 -0.5 0 0.5 1
-0.2 0.2
&middle ch autocorrelation middle-upper cross-correlation
-100 -50 0 50
-0.2 -0.1 0 0.1 0.2
-100 -50 0 50 100
-0.2 -0.1 0 0.1 0.2
A
Latency difference: upper channel relative to middle onset peakgroup
average S1 S2 S3 S4 S5
B
Phase lag:upper channel relative to middlephase lag (cycles)
phase group
average S1 S2 S3 S4 S5
latency difference (ms) cycles
C
D
E
F
Figure 6. Spindle timing differences between channels.A, Latency differences between upper and middle channels for spindle epoch onset and peak of spindle-band amplitude envelope, averaged across spindle epochs. Left, Group average. Right, Individual subjects. Error bars indicate 95% CI (1.96⫻SEM).B, Phase lag of upper channels relative to middle channels (selected for each subject based on spindle rate).C, Normalized spindle waveforms averaged across epochs, time-locked to the middle channel (channels 10 –14) with the highest spindle rate for each subject (arranged left to right). Blue represents middle channel. Red represents upper channel.D, Cross-correlation of selected upper and middle channels for each subject, averaged across epochs. Blue represents autocorrelation for middle channel. Red represents cross-correlation between upper and middle channel.E, Phase lag averaged across epochs.F, Phase locking.B–E, The upper layer spindles in Subjects 2, 3, and 5 were inverted before plotting because their responses were⬎0.25 cycle displaced from the middle layer spindles, suggesting phase wrapping (see Materials and Methods).
systems, termed “core” and “matrix” (Pi- antoni et al., 2016). The core system is fo- cal and acts as a relay, the matrix system is distributed and synchronizes widespread areas (Jones, 1998; Zikopoulos and Bar- bas, 2007). Because the core system proj- ects mainly to middle layers and the matrix to upper, it is tempting to identify the middle channel spindles as core and the upper channel as matrix. CSD analy- sis provides only limited direct support for this interpretation because the main transmembrane current sink inferred to underlie both middle and upper channel spindle generation is indistinguishable in the group average. However, the profiles do differ strongly in the presence of a deep return current source, which was found only for the middle channel spindles. Be- cause CSD profiles are predominantly controlled by the geometry of the receiv- ing neuron (Einevoll et al., 2007), this sug- gests that middle channel spindles are generated by pyramidal cells which span the layers containing the sink and source.
Most cells satisfying that criterion are layer Vb pyramidal cells, whose apical dendrites extend to near the cortical sur- face. Furthermore, these cells have very extensive apical and basilar dendritic ar- borizations in the regions of the current sink and source of middle channel spin- dles (Ramaswamy and Markram, 2015).
This configuration of large dendritic do- mains separated by a long narrow tube is ideal for generating source-sink pairs sim- ilar to that observed for the middle chan- nel spindles.
Upper channel spindles lack a return source in the group av- erage, but some individual subjects had weak sources above or below the sink. Examination of the LFPg in individual subjects and trials indicated that the upper channel spindles were often predominantly in only one or two channels, suggesting that a more accurate reconstruction of the source/sink distribution might have been obtained with higher density sampling of the thin layer I, and by extending sampling into the adjacent pia and CSF. Assumptions regarding unmeasured locations differ be- tween CSD calculation methods, and we noted that a superficial source was more common when the direct calculation procedure was used (Ulbert et al., 2001), rather than the inverse estimation procedure (Pettersen et al., 2006) followed here. In classical CSD theory, a lack of balance between sources and sinks reflects either measurement error (e.g., undersampling) or violation of assump- tions (e.g., assymmetrical CSD perpendicular to the electrode axis).
However, monopoles are often observed in experimental data (Ri- era, 2012) and may reflect actual physiological phenomena (Riera et al., 2012; Halnes et al., 2017).
For both middle and superficial spindles, the superficial sink is correlated with both high (70 –170 Hz) and low (25–50 Hz) gamma. Because high gamma is correlated with increased cell firing (Lachaux et al., 2012), this implies that the superficial sink
may be generated by EPSCs. Gamma modulation by spindle phase was greater in superficial layers, implying that phase lock- ing of neuronal firing is greater in those layers as has been found in rats (Peyrache et al., 2011). For middle channel spindles, gamma modulation extended to middle and upper infragranular layers, consistent with the hypothesized association of middle channel spindles with layer Vb (as well as layer II/II) pyramids.
However, this extension of spindle phase-modulated gamma did not extend below upper layers for upper channel spindles, sug- gesting that they may reflect mainly the activity of layer II/III pyramidal cells.
Identification of the middle and upper channel spindles with core and matrix thalamocortical afferents, respectively, is broadly consistent with the earlier studies in unanesthetized cats (Spencer and Brookhart, 1961) and rats (Kandel and Buzsa´ki, 1997) dis- cussed in the Introduction. However, further studies are needed to confirm the identification of particular spindle patterns with thalamocortical projection systems. The laminar pattern of spin- dles induced by core or matrix thalamocortical input is unlikely to reflect only the layers where their respective axons terminate. A large proportion of these inputs are to interneurons, which are often not directly visible in CSD because of their dendritic con- figurations. This has been shown experimentally for core inputs to excitatory interneurons in layer IV (Einevoll et al., 2007) but
0 10 20 30 40
5 10 15 20
0 10 20 30 40
5 10 15 20
0 10 20 30 40Hz
5 10 15 20
0 0.5
0 0.5
0 0.5
A
Upper channel spindleschannelchannel
B
Middle channel spindlesC
Upper and middle channel spindleschannel
Group average normalized Fourier spectra
12 14 16 5
10 15 20
D
Difference between upper-only and middle-only spindles0
-.5 0.5
Figure 7. Fourier spectra for different types of spindles. The FFT was used to calculate spectral power during spindle epochs for each channel, averaged across epochs, normalized to the maximum power, and then averaged across subjects (n⫽5).A, Spindles detected in upper channels but not middle channels.B, Spindles detected in middle channels but not upper channels.C, Spindles detected in both upper and middle channels.D, Difference spectra between spindles detected in middle or upper channels only.
would apply equally to matrix inputs to inhibitory interneurons in superficial layers, which include interneurons that strongly inhibit other interneurons (Cruikshank et al., 2012; Lee et al., 2015). In addition, the same voltage-gated H and T currents that underlie spindle generation in the thalamus are present in high levels in layer Vb and other cortical pyramidal cells (Ramaswamy and Markram, 2015). These and other currents result in intrinsic oscillations which can resonate with external inputs and local circuits to produce spindle-range frequencies (Silva et al., 1991).
Thus, pending further clarification from experimental and mod- eling studies, the identification of middle and upper channel spindles with core and matrix systems must remain tentative.
Spindles have also been dichotomized into to slow versus fast, in both humans and rodents. The dichotomy in rodents is clear, with slow spindles much lower frequency (centered at
⬃8 vs⬃14Hz), higher amplitude, and often epileptiform in nature (Polack and Charpier, 2006; Johnson et al., 2010). The dichotomy in humans may be less clear. Spindles are on average
⬃1 Hz slower over frontal cortex, in EEG, MEG (Dehghani et al., 2011b), and intracranial recordings (Andrillon et al., 2011; Piantoni et al., 2017). The individual waves in spindles also vary in frequency, with later waves also
⬃1 Hz slower on average (Dehghani et al., 2011b). However, using the usual 12 Hz boundary between fast
and slow spindle waves, most cortical locations, and most spindle bursts, include both. The strongest dichotomy between slow and fast EEG spindles in humans is that slow spindles are reported to precede downstates, whereas fast follow (Mo¨lle et al., 2011).
However, this has not been confirmed in SEEG where both fast and slow spindles clearly follow downstates (Mak-McCully et al., 2017). In our laminar recordings, upper channel spindles were slightly slower than middle, but their average frequency did not differ significantly, with both upper and middle spindles, includ- ing both slow and fast spindle waves, in a continuum rather than a dichotomy. It would appear that both correspond to fast spin- dles in rodents, which are those associated with memory replay and consolidation (Eschenko et al., 2006; Johnson et al., 2010).
In addition to their overlap in the frequency domain, middle and upper channel spindles were closely intertwined in both lo- cation and time. Individual spindles could be mostly middle or mostly upper, but half or more had at least some involvement of both. Although on average middle spindles slightly led upper, this varied greatly across spindle epochs. Relative phase between mid- dle and upper spindles was non-zero for most subjects but with the direction varying across subjects. Assuming that the middle channel spindles are core and the upper channel spindles are matrix, then the strong, punctate connections of the core system
510 15 20 5
10 15 20
PCschannels
PCs
B
Group average LFPg and CSDC
Example spindles: LFPg and component scores PC1PC2
-40 0 40 -40 0 40ms
explained variance fraction
200ms
1 2
LFPg CSD
.4 .3 .2 .1
01 2 3 4 5
5 10 15 20
1 -1
channels
A
Explained variance by PCA componentsAll panels z-score
1 2 3 4 5 PC component S1
S2
S3
S4
S5
D
Individual subject component loadingschannel
1
23
1
23
1
23
Figure 8. PCA.A, Fractional explained variance. Circles represent the group average. Error bars indicate 95% CI. Lines indicate the explained variance curves for each subject.B, Group average, normalized LFPg and CSD for first two principal components. Component time courses were multiplied by the channel weights and then averaged across spindle epochs and then across subjects. LFPg and CSD profiles of components 1 and 2 are similar to those found for middle and upper spindles, respectively (seeFig. 4).C, Example spindle waveforms (bandpass filtered, 10 –16 Hz) from one subject (S3) with the corresponding time courses for PC1 and PC2 on bottom. Red represents sinks (CSD), surface positive (LFPg), or positive PC scores.D, Individual subject component loadings show very similar channel profiles across subjects for components 1 and 2 but are weak and irregular for later components. Polarity (red or blue) is arbitrary, so component 2 in Subject 1 is actually similar to other subjects.