1
TITLE: Numerical simulation of a freely vibrating circular cylinder with different natural frequencies
ABBREVIATED TITLE: Freely vibrating cylinder: simulation
Dániel Dorogi*
Department of Fluid and Heat Engineering
Institute of Energy Engineering and Chemical Machinery University of Miskolc
3515 Miskolc-Egyetemváros Hungary
László Baranyi
Department of Fluid and Heat Engineering
Institute of Energy Engineering and Chemical Machinery University of Miskolc
3515 Miskolc-Egyetemváros Hungary
*Corresponding author:
Tel.:+36 20 256 8015 Fax: +36 46 565 471
Postal address: 3515 Miskolc-Egyetemváros, Hungary E-mail: aramdd@uni-miskolc.hu
2
Abstract
This paper deals with the numerical simulation of low-Reynolds-number-flow around a freely vibrating circular cylinder in two-degrees-of-freedom. The governing equations are written in a non-inertial system fixed to the moving cylinder and solved using finite difference method. The natural frequency of the cylinder is chosen to be constant, agreeing with the vortex-shedding frequency for a stationary cylinder at Reynolds number Re0. Systematic computations are carried out for Re0=80, 100, 140 and 180 keeping the mass ratio and structural damping coefficient at m*=10 and ζ=0. The effect of Re0 on the root-mean-square (rms) values of cylinder displacements and drag
coefficients is analyzed. Plotting the data set belonging to different Re0 values against U*St0 makes comparison easier. Local extreme values are found in the rms of
streamwise displacement and drag coefficient in the range U*St0=0.4–0.65. In the vicinity of U*St0=0.5 the rms of drag approaches zero and the phase angle between the x component of the motion and drag changes abruptly from 0° to 180°. The pressure drag coefficient seems to be responsible for the sudden change. The cylinder follows a distorted figure-eight path in most cases investigated and its orientation changes from clockwise to counterclockwise orbit at around U*St0=0.5.
3
Highlights:
A cylinder is investigated in low Re flow at four different natural frequencies.
Oscillation amplitudes and drag coefficient shift upwards with higher Re0.
At U*St0≅0.5 rms of drag approaches zero and cylinder orbit direction switches.
At U*St0≅0.5 phase angle between streamwise motion and drag changes by 180º.
Pressure drag appears to be related to phase angle and orientation switches.
Keywords:
circular cylinder; drag coefficient; free vibration; low Reynolds number;natural frequency; phase angle
4
1. Introduction
Flow around a circular cylinder is extensively studied due to its practical importance, using both experimental and numerical approaches. The flows are usually classified using Reynolds number based on free stream velocity U∞, cylinder diameter d and fluid viscosity ν. For stationary cylinders the flow is steady below Re≅47 and twin vortices are attached to the body. At around Re=47 Hopf bifurcation occurs, resulting in an unsteady flow of periodic vortex shedding (Thompson and Le Gal, 2004). Risers, pipes, and underwater structures are good examples of this phenomenon. Periodic vortex shedding from the body can induce high amplitude oscillations, which can cause serious damage to the structure; this phenomenon played an important role in the collapse of Tacoma Narrows Bridge in 1940. Damage to thermometer cases at the Monju fast- breeder nuclear power plant in 1995 leading to a major shutdown of the entire facility was also due to periodic vortex shedding (Nishihara et al., 2005). On the other hand, mechanical energy transferred between the fluid and the moving body can also be beneficial. Possibilities of energy harvesting have been studied e.g. by Bernitsas et al.
(2008, 2009) and Mehmood et al. (2013).
Barkley and Henderson (1996), applying linear stability analysis, showed that the flow around a stationary cylinder is two-dimensional (2D) up to Re≅189. Three- dimensional (3D) instability occurs at Re≅189 (Mode-A) and at Re≅259 (Mode B).
Thus, the application of a 2D computational code above Re=189 is not justified for a stationary cylinder. For vibrating cylinders, however, experiments by Bearman and Obasaju (1982) and Koide et al. (2002) and numerical simulations by Poncet (2002) showed that synchronization (or lock-in) between vortex shedding and cylinder motion increases the two-dimensionality of the flow compared to the case of a stationary
5
cylinder. The upper limit of the two-dimensionality has not been determined due to the large number of influencing parameters.
For the prediction of aerodynamic forces acting on a freely vibrating cylinder researchers often use a forced or controlled oscillation model. This approach is a simplifying model and is often chosen because no equations need to be solved for the cylinder motion. A large number of papers deal with forced oscillation in one-degree-of freedom (1DoF) cylinder motion, where the cylinder is typically restricted to move only in transverse direction (e.g. Williamson and Roshko, 1988; Lu and Dalton, 1996;
Meneghini and Bearman, 1997; Kaiktsis et al., 2007; Baranyi and Daróczy, 2013; Tang et al., 2016) or in streamwise direction (e.g. Okajima et al., 2004; Al-Mdallal et al., 2007; Mureithi et al., 2010). There are relatively few papers dealing with two-degree- of-freedom (2DoF) forced motion (e.g. Jeon and Gharib, 2001; Stansby and Rainey, 2001; Baranyi, 2008; Peppa et al., 2016).
Another approach to the investigation of vortex-induced vibrations (VIV) involves an elastically supported cylinder model, where cylinder displacement is caused by lift and drag forces acting on the body. A large number of studies have dealt with this model, including Bishop and Hassan (1964), Bearman (1984, 2011), Sarpkaya (1995, 2004), Jauvtis and Williamson (2004), Williamson and Govardhan (2004), Blevins (1990), Moe and Wu (1990), and Nakamura et al. (2013). Cylinder response is highly influenced by free stream velocity U∞, natural frequency of the body fN, structural damping b, and the mass of the body m.
Vibrations due to vortex shedding are often modeled with 1DoF transverse-only motion. Khalak and Williamson (1999) investigated the VIV of a transversely oscillating cylinder and showed that the mass-damping parameter m*ζ strongly
6
influences the peak amplitude, where m* is the mass ratio (the ratio of the mass of the vibrating body and that of the displaced fluid) and ζ is the structural damping
coefficient. It was shown that at low m*ζ three branches of cylinder response occur, namely initial, upper and lower branches, where the upper branch is associated with the highest oscillation amplitude. Feng (1968) studied high mass-damping cases where only two branches (an initial branch with low cylinder displacements and lower branch with high vibration amplitudes) are observed. Brika and Laneville (1993) and Govardhan and Williamson (2000) distinguished between the different branches based on their vortex- shedding modes. The initial branch is associated with 2S mode (two single vortices are shed in each motion cycle) while 2P mode (two vortex pairs shed in each motion cycle) belongs to the lower and upper branches. Brika and Laneville (1993) found that the transition between upper and lower branches is hysteretic and the flow is quite sensitive to incremental changes in the reduced velocity.
Klamo et al. (2006) investigated how the system transitions between two-branch and three-branch responses. In their study Reynolds number and the structural damping were varied. It was concluded that m*ζ alone is insufficient to predict the type of response; Reynolds number is also an important influencing parameter. For small damping and high Re cases a three-branch response was observed, while a two-branch response was found for high damping and low Re cases.
Naturally, structures are not restricted to move only in one direction; in most cases two-degree of freedom (2DoF) oscillations are found. Jauvtis and Williamson (2004), using an elastically supported cylinder, kept the natural frequencies identical in two directions (𝑓𝑁𝑥 = 𝑓𝑁𝑦 = 𝑓𝑁) and investigated a wide mass ratio range (m* < 25) using an experimental approach. It was found that at high m* cases (m*=6–25) in-line
7
oscillation has only a tiny effect on transverse vibration, which was also found by Zhou et al. (1999) at low Reynolds numbers using numerical techniques. Jauvtis and
Williamson (2004) found that a three-branch response occurs, as in 1DoF cylinder oscillation. Upon decreasing the mass ratio below m*=6 dramatic changes were observed. The existence of a super-upper branch was reported where the vortex- shedding mode was 2T type – two triple vortices shed in each vibration period.
However, in general, the natural frequencies in streamwise and transverse directions are not identical, 𝑓𝑁𝑥 ≠ 𝑓𝑁𝑦. Sarpkaya (1995) experimentally investigated 2DoF vortex- induced vibrations varying the natural frequency ratio fNx/fNy between 1 and 2. These results were compared with 1DoF cylinder oscillation results for fNx=fNy and a 19%
increase was observed in the transverse oscillation amplitude. In addition, two obvious peaks were identified at fNx=2fNy. Dahl et al. (2006) showed that by increasing the ratio of streamwise and transverse frequencies in the range of fNx/fNy=1–1.9, the phase angle between x and y component of the motion decreases and the peak amplitude shifts to higher reduced velocities U*=U∞/(fNd), where fN=fNy is the transverse natural frequency.
Sanchis (2009) extended the frequency ratio range, where the natural frequency in transverse direction was greater than in streamwise direction (fNx/fNy=0.42, 0.87). The amplitude and frequency responses were very similar to those for fNx/fNy =1. The only difference was that the transition between upper and lower branch shifted from intermittency to lag. Kang et al. (2016) investigated three different circular cylinders with distinct aspect ratios (L/D=6, 10.91 and 24). It was shown that with high aspect ratios (L/D=24) different moving trajectories occur – D-shaped, egg-shaped, raindrop- shaped and figure-eight – but with sufficiently low aspect ratios (such as L/D=6) only figure-eight (or rather, distorted figure-eight) motion is found.
8
Most of the experimental studies are carried out at the medium range of Reynolds numbers (Re=103–104). Numerical studies at this regime are very limited because of the high computational cost; therefore, most computations are carried out for low Re.
Govardhan and Williamson (2006) and Klamo et al. (2006) showed that besides the mass ratio and structural damping, Reynolds number also strongly influences the oscillation amplitude and fluid forces. Although Reynolds number and reduced velocity are not completely independent variables, it is convenient to investigate their effect separately. Leontini et al. (2006) investigated numerically the branching behavior of VIV at Re=200 with m*=10 and ζ=0.01 for transverse-only cylinder motion. A two- branch response was shown where the vortex-shedding mode was 2S in all cases investigated. At the reduced velocity range of U*=4.7–6.4 large amplitude oscillation occurs where positive and negative vortices coalesce. Using the notations introduced by Williamson and Roshko (1988), this vortex configuration is referred to as C(2S) mode.
Singh and Mittal (2005) carried out two sets of computations for 2DoF cylinder motion (1) at Re=100 with varying U* and (2) at U*=4.92 and varying Re. A two- branch cylinder response was identified with the maximum dimensionless transverse oscillation amplitude of y0max≅0.6. In the first set of computations 2S vortex
configuration was observed. For high amplitude transverse oscillations, C(2S) mode was presented, similar to the results obtained by Leontini et al. (2006). The transition at the lower and higher end of the flow is hysteretic. (This was also found by Brika and Laneville (1993) at medium Reynolds numbers for transverse-only motion.) In the second case investigated by Singh and Mittal (2005), when the reduced velocity was fixed at U*=4.92 and Reynolds number was varied, 2S mode was observed below Re=300 and P+S mode above Re=300.
9
There are a few numerical studies dealing with constant natural frequencies. In this case a linear function exists between Reynolds number and reduced velocity (Re=KU*, where K=fNd2/ν). Willden and Graham (2006) carried out a numerical study for
Re=20U* in which the body was restricted to move only in transverse direction. The flow characteristics are investigated for five different mass ratios of m*=1, 2, 5, 10, 50.
Primary, secondary and tertiary responses were identified. The primary response
occurred around lock-in, which is always associated with vortex-induced vibration. The secondary response is found to occur only for high mass ratios (m* > 5) and in the tertiary response regime an approximately constant oscillation amplitude can be
maintained. Bahmani and Akbari (2010) investigated numerically the separate effects of mass ratio and structural damping for Re=17.9U* considering 1DoF cylinder motion. It was found that increasing m* or ζ has almost the same effect: both the oscillation amplitude and the lock-in domain decrease.
In the following numerical studies carried out for 2DoF cylinder motion, the natural frequencies in both streamwise and transverse direction are identical
(fNx=fNy=fN=const.). Prasanth et al. (2006) carried out two sets of computations: (1) at fixed U*=4.92 with varying Re and (2) with constant natural frequencies where both Reynolds number and reduced velocity was varied using Re=16.6U*. Hysteretic loops were also found at the lower and higher end of lock-in. It was shown that by reducing the blockage ratio B (the ratio of cylinder diameter and the height of the computational domain) to B=1%, hysteresis loops disappear. Prasanth and Mittal (2008) investigated additional blockage ratios (using Re=16.6U*) and concluded that as the blockage is reduced, the size of hysteresis loops decreases and hysteresis completely disappears at B=2.5%. The phase shift between lift coefficient and transverse cylinder displacement
10
jumps abruptly from 0° to 180° at Re=110. Decomposing the total lift into two components of pressure lift and viscous lift, the authors concluded that the jump is caused by the pressure lift, since the viscous lift remains in phase with the cylinder motion in all of the investigated Re cases.
Mittal and Singh (2005) investigated mainly subcritical Reynolds numbers (Re <
47), where Re was varied with the reduced velocity (Re=3.1875U*). They found that self-excited motion occurs as low as Re≅20, which is a steady-state regime for a stationary cylinder. At low mass ratio (m*=4.73) the dimensionless vortex shedding frequency St does not agree with reduced natural frequency, which was observed also by Williamson and Govardhan (2004). However, when increasing the mass ratio to m*=50, St and FN curves almost overlap. At Re=33, FN is approximately identical to St and the oscillation amplitude was low compared to the Re=25 case, where FN > St and the vibration amplitude was high. The reason is that at Re=33 the lift force and
transverse displacement are in antiphase, therefore the energy transferred between the moving cylinder and the fluid is low compared to that of the Re=25 case, where lift and transverse displacement are in phase, meaning that the mechanical energy transfer is higher.
The present numerical study deals with low-Reynolds-number flow around a circular cylinder free to vibrate in both streamwise and transverse directions. The mass ratio is fixed at m*=10 and the structural damping coefficient is set to zero. As can be seen from the literature review, only low natural frequency values have been
investigated for 1DoF and 2DoF free vibrations (the coefficient between Reynolds number and reduced velocity K is in the range of 3–20 only). Systematic computations are carried out for constant natural frequencies agreeing with the vortex shedding
11
frequency for a stationary cylinder at the Reynolds number of Re0. To the best
knowledge of the authors, most of the articles investigating the 2DoF cylinder motion are dealing with Re0=100 and systematic computations analyzing the effect of Re0 have not yet been carried out. The aim of this paper is to expand the Re0 (and with this the natural frequency) domain by investigating the flow characteristics at Re0=80, 100, 140 and 180. Cylinder response, aerodynamic force coefficients, cylinder path and phase angle between the x component of the motion and the total drag, pressure drag and viscous drag coefficients are investigated in this study.
The outline of the current paper is as follows. In Section 2 the governing equations, the boundary and initial conditions are introduced and the computational methodology are presented. In Section 3, first, the independence studies are detailed and then the results obtained here are compared with those in the literature. Finally, Section 4 shows the new computational results and in Section 5 conclusions are drawn.
Nomenclature
b damping [kg/s]
CCW counterclockwise orbit on the upper loop of figure-eight CD total drag coefficient, 2𝐹𝐷/(𝜌𝑈∞2𝑑) [-]
CDp pressure drag coefficient [-]
CDv viscous drag coefficient [-]
CL total lift coefficient, 2𝐹𝐿/(𝜌𝑈∞2𝑑) [-]
CLp pressure lift coefficient [-]
CLv viscous lift coefficient [-]
CW clockwise orbit on the upper loop of figure-eight
12 d cylinder diameter, length scale [m]
D dilation, non-dimensionalized by U∞/d DoF degrees of freedom
FD drag per unit length of the cylinder [N/m]
FL lift per unit length of the cylinder [N/m]
FN reduced natural frequency, fNd/U∞ [-]
𝑓𝑥,𝑦∗ oscillation frequency in x or y directions, respectively, non- dimensionalized by d/U∞
fN natural frequency of the cylinder [1/s]
fv natural frequency of the cylinder [1/s] k spring constant [kg/s2] K coefficient between Reynolds number and reduced velocity for constant
natural frequencies, fNd2/ν [-]
m cylinder mass per unit length [kg/m]
m* mass ratio, 4m/(d2πρ) [-]
p pressure, non-dimensionalized by 𝜌𝑈∞2 R radius, non-dimensionalized by d rms root-mean-square value
Re Reynolds number, U∞d/ν [-]
St dimensionless vortex shedding frequency, Strouhal number, fd/U∞
St0 dimensionless vortex shedding frequency for a stationary cylinder at Reynolds number Re0
t time, non-dimensionalized by d/U∞
u, v velocities in x and y directions, non-dimensionalized by U∞
U∞ free stream velocity, velocity scale [m/s]
13 U* reduced velocity, U∞/(fNd) [-]
x, y Cartesian coordinates, non-dimensionalized by d
x0, y0 cylinder displacement in x and y directions, non-dimensionalized by d ζ structural damping coefficient, 𝑏/(2√𝑚𝑘) [-]
Θ phase angle between streamwise and transverse components of the cylinder motion [-]
ν kinematic viscosity of the fluid [m2/s]
ξmax, ηmax number of grid points in peripheral and radial direction, respectively ρ fluid density [kg/m3]
Φ phase angle between x0 and CD [-]
Φp phase angle between x0 and CDp [-]
Φv phase angle between x0 and CDv [-]
Subscripts:
L lift
D drag
max maximum value
rms root-mean-square value
n component in the direction normal to the cylinder surface pot potential flow
1, 2 on the cylinder surface, at the outer boundary of the domain
0 refers to cylinder response (x0, y0) or to a stationary cylinder (Re0, St0)
2. Governing equations and computational method
14
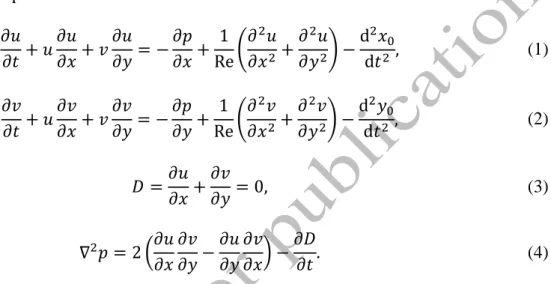
In this study two-dimensional constant property incompressible Newtonian fluid flow around a circular cylinder undergoing two-degree-of-freedom (2DoF) free vibration is investigated. The non-dimensional governing equations for this problem are the two components of the Navier-Stokes equations written in a non-inertial system fixed to the moving cylinder, the continuity equation and the pressure Poisson equation. These equations in primitive variables are written as follows:
𝜕𝑢
𝜕𝑡 + 𝑢𝜕𝑢
𝜕𝑥+ 𝑣𝜕𝑢
𝜕𝑦= −𝜕𝑝
𝜕𝑥+ 1 Re(𝜕2𝑢
𝜕𝑥2+𝜕2𝑢
𝜕𝑦2) −d2𝑥0
d𝑡2 , (1)
𝜕𝑣
𝜕𝑡 + 𝑢𝜕𝑣
𝜕𝑥+ 𝑣𝜕𝑣
𝜕𝑦= −𝜕𝑝
𝜕𝑦+ 1 Re(𝜕2𝑣
𝜕𝑥2+𝜕2𝑣
𝜕𝑦2) −d2𝑦0
d𝑡2 , (2)
𝐷 =𝜕𝑢
𝜕𝑥+𝜕𝑣
𝜕𝑦 = 0, (3)
∇2𝑝 = 2 (𝜕𝑢
𝜕𝑥
𝜕𝑣
𝜕𝑦−𝜕𝑢
𝜕𝑦
𝜕𝑣
𝜕𝑥) −𝜕𝐷
𝜕𝑡. (4)
In these equations u, v are the non-dimensional velocity components in x and y directions, t is the non-dimensional time, p is the dimensionless pressure, d2x0/dt2 and d2y0/dt2 are the non-dimensional streamwise and transverse acceleration components of the cylinder, and D is the dilation. In Eqs. (1) and (2) Re=U∞d/ν is the Reynolds
number, where U∞ is the free stream velocity, d is the cylinder diameter, and ν is the kinematic viscosity of the fluid. Although dilation is zero for incompressible fluids, in Eq. (4) ∂D/∂t is kept to avoid numerical inaccuracies (Harlow and Welch, 1965).
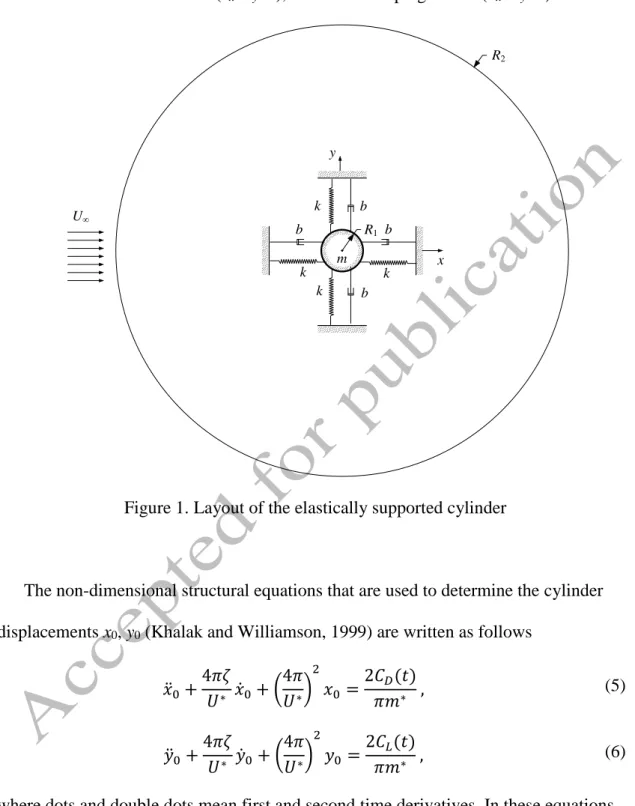
Figure 1 shows the layout of the computations. The figure shows a circular cylinder with a dimensionless radius R1 and with mass per unit length m placed into a uniform free stream with velocity U∞. The outer boundary of the physical domain, where the flow is assumed to be undisturbed, is represented by dimensionless radius R2. The rigid cylinder is elastically supported in both streamwise and transverse directions. In this
15
study springs are supposed to be linear and the spring constants are chosen to be identical in the two directions (kx=ky=k), as are the damping values (bx=by=b).
R2
R1
U∞ k b
k
b b
k k x
y
m b
Figure 1. Layout of the elastically supported cylinder
The non-dimensional structural equations that are used to determine the cylinder displacements x0, y0 (Khalak and Williamson, 1999) are written as follows
𝑥̈0+4𝜋𝜁
𝑈∗ 𝑥̇0+ (4𝜋 𝑈∗)
2
𝑥0 =2𝐶𝐷(𝑡)
𝜋𝑚∗ , (5)
𝑦̈0+4𝜋𝜁
𝑈∗ 𝑦̇0+ (4𝜋 𝑈∗)
2
𝑦0 = 2𝐶𝐿(𝑡)
𝜋𝑚∗ , (6)
where dots and double dots mean first and second time derivatives. In these equations 𝑥0, 𝑥̇0, 𝑥̈0 are the dimensionless streamwise displacement, velocity and acceleration of the cylinder, respectively, and 𝑦0, 𝑦̇0, 𝑦̈0 are the same quantities for the transverse direction. In Eqs. (5) and (6) 𝑚∗ = 4𝑚/(𝑑2𝜋𝜌) is the mass ratio, where ρ is the fluid
16
density; 𝑈∗ = 𝑈∞/(𝑓𝑁𝑑) is the reduced velocity, where 𝑓𝑁 is the natural frequency of the cylinder and 𝜁 = 𝑏/(2√𝑘𝑚) is the structural damping coefficient. The lift and drag coefficients are defined as
𝐶𝐿 = 2𝐹𝐿
𝜌𝑈∞2𝑑 , 𝐶𝐷= 2𝐹𝐷
𝜌𝑈∞2𝑑 , (8) where 𝐹𝐿 and 𝐹𝐷 are the dimensional lift and drag forces per unit length, which are computed from the pressure and shear stress distributions on the cylinder surface.
Therefore CL and CD can be divided into two parts:
𝐶𝐿 = 𝐶𝐿𝑝+ 𝐶𝐿𝑣 , 𝐶𝐷 = 𝐶𝐷𝑝+ 𝐶𝐷𝑣 , (9) where subscripts p and v refer to pressure and viscous parts, respectively. The boundary conditions are written as follows:
Cylinder surface (R1): 𝑢 = 𝑣 = 0, (10)
𝜕𝑝
𝜕𝑛 = 1
Re∇2𝑣𝑛 − 𝑥̈0𝑛− 𝑦̈0𝑛, (11) Outer surface (R2): 𝑢 = 𝑢𝑝𝑜𝑡− 𝑥̇0, 𝑣 = 𝑣𝑝𝑜𝑡 − 𝑦̇0, (12)
𝜕𝑝
𝜕𝑛 = (𝜕𝑝
𝜕𝑛)
𝑝𝑜𝑡
≅ 0, (13)
where subscript n refers to the outer normal of the circular cylinder. On the cylinder surface (R=R1) no-slip boundary conditions are applied to the two velocity components u, v and Neumann-type boundary condition is used for pressure p. Potential flow (referred to as subscript ‘pot’ in Eq. (13)) is assumed in the far field (R2=160R1); it has been shown that this simplification causes only a small distortion in the velocity fields (Baranyi, 2008; Posdziech and Grundman, 2007. Initial conditions for the cylinder displacement and velocity are chosen to be:
𝑥0(𝑡 = 0) = 𝑦0(𝑡 = 0) = 0, 𝑥̇0(𝑡 = 0) = 𝑦̇0(𝑡 = 0) = 0. (14)
17
Potential flow is assumed around the cylinder at t=0, hence force coefficients are CD (t=0) = CL (t=0) = 0, which combined with Eqs. (5), (6) and (14) yields zero initial cylinder acceleration 𝑥̈0(𝑡 = 0) = 𝑦̈0(𝑡 = 0) = 0.
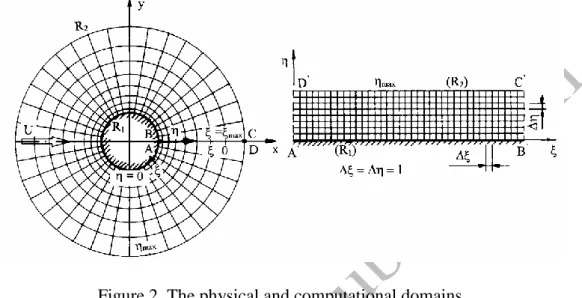
Figure 2. The physical and computational domains
In this study boundary-fitted coordinates are used in order to impose boundary conditions accurately. The physical domain is mapped into a rectangular computational domain (see Fig. 2) applying linear mapping functions (Baranyi, 2008). Due to the properties of the mapping functions, the computational grid on the physical domain is very fine in the vicinity of the cylinder and coarse in the far field, but the grid is
equidistant in the computational domain. The transformed governing equations with the transformed boundary and initial conditions are solved using an in-house code based on the finite difference method (Baranyi, 2008). Space derivatives are approximated using fourth-order difference schemes, except for the convective terms where third-order modified upwind difference scheme was applied (Kawamura et al., 1986). The
equations of motion and structural equations are integrated explicitly, pressure Poisson
18
equation is solved using successive over-relaxation (SOR) method, and the continuity equation is satisfied in each time step.
3. Validation procedure
In this section, results of independence studies used to determine the optimal
combination of computational parameters are shown. Using this set of parameters, the obtained stationary and elastically supported cylinder results are compared with those available in the literature.
3.1 Independence studies
Radius ratio R2/R1, grid resolution ξmax×ηmax (grid points in the peripheral and radial direction, respectively), and dimensionless time step Δt characterize the computational setup. Independence studies have to be carried out in order to find the optimal
combination of the parameters, which is the best compromise between high accuracy and computational cost. During these investigations Reynolds number and reduced velocity are set to be constant values: Re=150 and U*=5.8837. Root-mean-square (rms) values of the dimensionless streamwise, transverse displacements, and lift and drag coefficients are presented.
For investigating the effect of the radius ratio, the number of grid points around the cylinder surface is fixed at ξmax=360 and the dimensionless time step is kept at
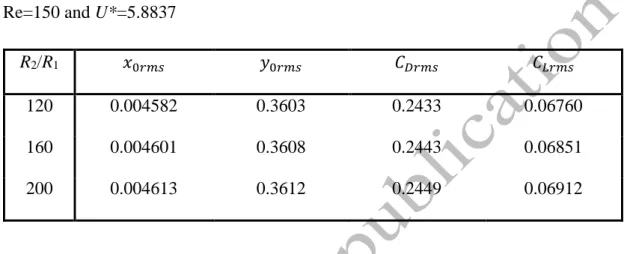
Δt=0.0005. Three radius ratio values are considered: R2/R1=120, 160 and 200. In order to make the grid equidistant in the computational domain the number of grid points in the radial direction belonging to the three radius ratio values are chosen to be ηmax=274, 291 and 304. The results are given in Table 1. The relative difference between x0rms, y0rms, CDrms obtained from the results for R2/R1=120 and those for R2/R1=200 is less than 0.7%. However, the relative difference between the values at the radius ratio R2/R1=160
19
and 200 decreases to 0.15% or below. CLrms shows higher differences but the
corresponding value is less than 1% for R2/R1=160 and 200. Hence, the radius ratio of 160 seems to be appropriate for the computations.
Table 1. Effect of radius ratio R2/R1 on the cylinder response and force coefficients for Re=150 and U*=5.8837
R2/R1 𝑥0𝑟𝑚𝑠 𝑦0𝑟𝑚𝑠 𝐶𝐷𝑟𝑚𝑠 𝐶𝐿𝑟𝑚𝑠
120 0.004582 0.3603 0.2433 0.06760
160 0.004601 0.3608 0.2443 0.06851
200 0.004613 0.3612 0.2449 0.06912
For the investigation of grid independence, the number of peripheral points is chosen to be ξmax=300, 360 and 420 while the radius ratio and dimensionless time step are fixed at R2/R1=160 and Δt=0.0005, respectively. In order to generate an equidistant grid on the computational domain, ηmax is chosen to be ηmax=242, 291 and 339. Results are shown in Table 2. The highest relative differences are observed in CLrms: 0.65% and 0.18% between the results for ξmax=300 and 420 and for 360 and 420, respectively. In the values of x0rms and CDrms the relative difference for ξmax=300 and 420 is
approximately 0.32%, which decreases to 0.09% for ξmax=360 and 420. y0rms shows the least relative differences, which are 0.15% and 0.04% for the coarsest and the medium grid resolution, respectively.
Table 2. Grid dependence study for Re=150 and U*=5.8837
20
ξmax 𝑥0𝑟𝑚𝑠 𝑦0𝑟𝑚𝑠 𝐶𝐷𝑟𝑚𝑠 𝐶𝐿𝑟𝑚𝑠
300 0.004612 0.3612 0.2449 0.06874
360 0.004601 0.3608 0.2443 0.06841
420 0.004597 0.3607 0.2441 0.06829
Finally, the effect of dimensionless time step is studied. The grid and radius ratio are fixed at 360×291 and R2/R1=160, respectively. For this investigation computations are carried out for the dimensionless time step values of 0.001 (∆t1), 0.0005 (∆t2) and 0.00025 (∆t3). Here also, CLrms shows the highest relative differences: 1.4% for ∆t1 and
∆t3 and 0.5% for ∆t2 and ∆t3. In the values of x0rms and CDrms the corresponding difference is around 0.3% for ∆t1 and 0.09% for ∆t2. As was observed in the grid dependence study, the relative difference is the least for y0rms: 0.1% for ∆t1 and 0.03%
for ∆t2. Thus, the time-step value of ∆t=0.0005 seems to be adequate for further computations.
Table 3. Effect of dimensionless time step Δt on the cylinder response and force coefficients for Re=150 and U*=5.8837
Δt 𝑥0𝑟𝑚𝑠 𝑦0𝑟𝑚𝑠 𝐶𝐷𝑟𝑚𝑠 𝐶𝐿𝑟𝑚𝑠
0.001 0.004592 0.3606 0.2438 0.06781
0.0005 0.004601 0.3608 0.2443 0.06841
0.00025 0.004606 0.3610 0.2445 0.06875
3.2 Code validation for stationary and elastically supported cylinders
21
The in-house code applied for the computations has been extensively tested in order to prove its accuracy (see e.g. Baranyi, 2008). For further testing, first, the flow around a stationary cylinder is investigated. Reynolds number was varied in the range of Re=80–
180, where the flow is two-dimensional (Barkley and Henderson, 1999) and periodic vortex shedding occurs. In Fig. 3a rms values of lift coefficient CLrms are shown against Re. Good agreement is found between our results and those of Baranyi and Lewis (2006) and Golani and Dhiman (2014). The variation of Strouhal number St0 – which is the dimensionless vortex shedding frequency for a stationary cylinder – is shown in Fig.
3b. As can be seen, the current results compare well with the numerical studies of Silva et al. (2003), Baranyi and Lewis (2006), and Posdziech and Grundman (2007) and with the experimental studies of Norberg (2003).
(a) CLrms (b) St0
Figure 3. Results for stationary cylinders: root-mean square value of lift coefficient (a) and dimensionless vortex shedding frequency (b) compared to published results
Computational results for a freely vibrating cylinder in 2DoF are shown in Fig. 4.
Prasanth and Mittal (2008) and He and Zhang (2016) carried out computations where
0 0.05 0.1 0.15 0.2 0.25 0.3 0.35 0.4 0.45 0.5
80 100 120 140 160 180
CLrms
Re
Present computations Baranyi and Lewis (2006) Golani and Dhiman (2014)
0.1 0.12 0.14 0.16 0.18 0.2
80 100 120 140 160 180
St0
Re
Present computations Norberg (2003) Silva et al. (2003) Baranyi and Lewis (2006) Posdziech and Grundman (2007)
22
the natural frequency was kept at a constant value, which agreed with the vortex- shedding frequency for a stationary cylinder at Reynolds number Re0=100. In this case the relationship between Re and U* is Re=16.6U*. The mass ratio was fixed at m*=10 and the structural damping coefficient was set to zero (ζ=0). In Fig. 4 rms values of transverse and streamwise displacements are shown against Re. The agreement between the current results and those obtained by Prasanth and Mittal (2008) and He and Zhang (2016) is excellent except for the lower and higher threshold of flow synchronization.
At the vicinity of Re=90 and 130 the flow is very sensitive to changes in the Reynolds number (and also in the reduced velocity), which explains the higher discrepancies between the results.
(a) y0rms (b) x0rms
Figure 4. Elastically supported cylinder results: root-mean-square value of transverse (a) and streamwise displacement (b) of the cylinder compared to Prasanth and Mittal
(2008) and He and Zhang (2016)
Reassuringly, 2S vortex shedding mode occurs for low transverse oscillation amplitude cases (e.g. at the initial branch) and C(2S) mode of vortex shedding is
0 0.1 0.2 0.3 0.4 0.5 0.6 0.7 0.8
60 80 100 120 140 160
y0rms
Re
Present computations Prasanth and Mittal (2008) He and Zhang (2016)
0 0.005 0.01 0.015
60 80 100 120 140 160
x0rms
Re
Present computations Prasanth and Mittal (2008) He and Zhang (2016)
23
observed for high transverse cylinder displacements, similar to results obtained by Prasanth and Mittal (2008) and He and Zhang (2016).
4. Results and discussion
In this study flow around a circular cylinder undergoing two-degrees-of-freedom free vibration is investigated. The mass ratio is fixed at m*=10 and the structural damping is chosen to be zero (ζ=0) to ensure high amplitude cylinder displacement. As mentioned in Section 1, Reynolds number and reduced velocity are not independent parameters. If the natural frequency of the oscillating cylinder fN is constant, the relationship between Re and U* is linear, Re=KU* where K=fND2/ν=const (Mittal and Singh, 2005).
Assuming that the reduced natural frequency FN=1/U* is identical to the Strouhal number for a stationary cylinder St0 at Reynolds number Re0, K can be determined as K=Re0 St0.
It was found in the literature review that earlier investigations had been limited to low natural frequency values. For 2DoF motion only Re0=100 was investigated (Prasanth and Mittal, 2008). In order to fill this gap, systematic computations are carried out for four different Re0 values. St0, Re0, and the computed K values are given in Table 4.
Table 4. Dimensionless vortex shedding frequencies for stationary cylinder St0 and the computed constant values K for different Reynolds numbers Re0
Re0
St0
(Baranyi and Lewis, 2006)
K=Re0 St0
80 0.1543 12.344
100 0.166 16.60
140 0.1821 25.494
24
180 0.193 34.74
4.1. Cylinder response and aerodynamic force coefficients
The root-mean-square (rms) values of the transverse cylinder displacement y0rms for the investigated Re0 are shown in Fig. 5. As can be seen, the cylinder response for a given Re0 value consists of three different regimes. At the initial branch the cylinder
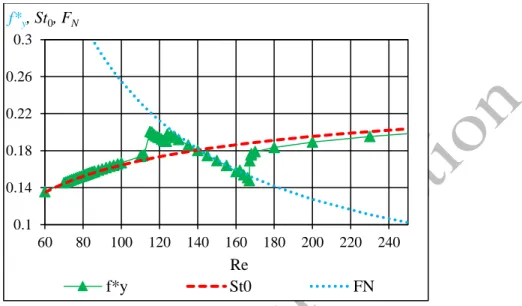
oscillation amplitude is low – in both streamwise and transverse directions – and the transverse vibration frequency 𝑓𝑦∗ is approximately equal to the dimensionless vortex- shedding frequency for a stationary cylinder St0. In Fig. 6 the variation of St0, FN and 𝑓𝑦∗ is shown for Re0=140, where 𝑓𝑦∗ ≅ St0 at the initial branch can be clearly seen. With increasing Re and U*, cylinder response switches to the lower branch, where the oscillation frequency synchronizes with the natural frequency of the cylinder, resulting in high amplitude oscillations. Beyond the lock-in domain, the oscillation amplitude becomes small again and 𝑓𝑦∗ locks in to St0, as was observed in the initial branch.
0 0.05 0.1 0.15 0.2 0.25 0.3 0.35 0.4 0.45
60 80 100 120 140 160 180 200 220 240
y0rms
Re
Re0=80 Re0=100 Re0=140 Re0=180
25
Figure 5. Root-mean-square values of transverse cylinder displacement y0rms against Re for Re0=80, 100, 140, 180
Figure 6. Dimensionless transverse vibration frequency for Re0=140, dimensionless vortex-shedding frequency for stationary cylinder St0 (Posdziech and Grundmann,
2007) and reduced natural frequency FN against Re
The Reynolds number range in which the oscillation frequency synchronizes with the natural frequency, i.e. lock-in, strongly depends on Re0 (see Fig. 5), therefore comparison of data is difficult. Khalak and Williamson (1999) showed that the cylinder responses for different mass-damping parameters m*ζ can collapse into a single curve by using ‘true’ reduced velocity (U*/f*, where f* is the ratio of the transverse oscillation frequency and the natural frequency of the cylinder) as an independent variable instead of reduced velocity. Due to ζ=0, mass damping parameter is zero in all the cases investigated in this study. Singh and Mittal (2005) used U*St0 as an independent variable for the cases where either Re or U* was kept constant. Using the definitions of reduced velocity and Strouhal number, it can be seen that U*St0 is the ratio of the
0.1 0.14 0.18 0.22 0.26 0.3
60 80 100 120 140 160 180 200 220 240 f*y, St0, FN
Re
f*y St0 FN
26
vortex-shedding frequency for a stationary cylinder fv and the natural frequency of the oscillating body fN (𝑈∗St0 = 𝑈∞
𝑓𝑁𝑑 𝑓𝑣𝑑 𝑈∞= 𝑓𝑣
𝑓𝑁). To the best knowledge of the authors, U*St0
has not previously been applied as an independent variable for constant natural frequency cases. However, it can be seen in Fig. 7 that by plotting y0rms against U*St0
the curves belonging to different Re0 values can be represented in the same range.
Strouhal number values in the range of Re=50–250 are obtained from Posdziech and Grundmann (2007). As can be seen in Fig. 7, the curves shift to higher y0rms with
increasing Re0. A larger difference in y0rms values is found between Re0=80 and 100 than between Re0=140–180. It can also be seen that the lower branch is significantly wider for lower Re0 values. Previous researchers (e.g. Prasanth and Mittal, 2008) showed that in the transition between the initial and the lower branch – where the oscillation amplitude varies strongly – the flow is chaotic. The width of this transition range also depends on Re0. In the case of Re0=80 and 100 y0rms jumps abruptly between the two branches, in contrast to Re0=140 and 180, where the rms value of the transverse vibration component changes gradually.
0 0.05 0.1 0.15 0.2 0.25 0.3 0.35 0.4 0.45
0.4 0.6 0.8 1 1.2 1.4 1.6
y0rms
U*St0
Re0=80 Re0=100 Re0=140 Re0=180
27
Figure 7. Root-mean-square value of transverse cylinder displacement against U*St0
for Re0=80, 100, 140, 180
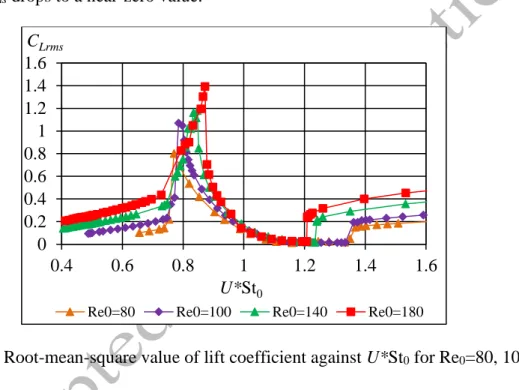
In Fig. 8 the rms of lift coefficient CLrms is plotted against U*St0. It can be seen that in the initial branch and beyond the lower branch CLrms shifts to higher values with increasing Re0. Besides, at the transition regime between initial and lower branches CLrms increases significantly up to a peak value which increases with Re0. In the lower branch CLrms drops to a near-zero value.
Figure 8. Root-mean-square value of lift coefficient against U*St0 for Re0=80, 100, 140, 180
In Figs. 9 and 10 the rms value of the streamwise displacement x0rms and drag coefficient CDrms are shown against U*St0. As expected, the amplitude of oscillation in streamwise direction is significantly smaller than that in transverse direction. Similar characteristics are observed, as were seen for y0rms in Fig. 7: the curves belonging to increasing Re0 shift to higher values for both x0rms and CDrms. On the other hand, the rms values of streamwise cylinder displacement show an increase in the range of
U*St0=0.4–0.65, which becomes more significant for higher Re0 (see Fig. 9). CDrms
0 0.2 0.4 0.6 0.8 1 1.2 1.4 1.6
0.4 0.6 0.8 1 1.2 1.4 1.6
CLrms
U*St0
Re0=80 Re0=100 Re0=140 Re0=180
28
shows similar behavior (Fig. 10) but the difference is less than that observed in x0rms. Note that this phenomenon is not observed for Re0=80 because the flow is steady below U*St0 ≅ 0.5.
Figure 9. Root-mean-square value of streamwise cylinder displacement against U*St0
for Re0=80, 100, 140, 180
Figure 10. Root-mean-square value of drag coefficient against U*St0 for Re0=80, 100, 140, 180
0.000 0.001 0.002 0.003 0.004 0.005 0.006 0.007 0.008
0.4 0.6 0.8 1 1.2 1.4 1.6
x0rms
U*St0
Re0=80 Re0=100 Re0=140 Re0=180
0.0 0.1 0.2 0.3 0.4 0.5 0.6
0.4 0.6 0.8 1 1.2 1.4 1.6
CDrms
U*St0
Re0=80 Re0=100 Re0=140 Re0=180
29
In Fig. 11 the domain U*St0=0.4–0.65 is shown at higher resolution. It can be seen that x0rms increases continuously until it reaches its local maximum value at around U*St0~0.47 (see Fig. 11a). As expected, with decreasing Re0 the peak value diminishes, and almost disappears at Re0=100. In addition to the peak, a local minimum point is identified for CDrms at U*St0≅0.5 where it approaches zero (see Fig. 11b). After the local minimum point CDrms starts to increase, with the slope of the curve increasing with Re0. To check the significance of the local maximum values of x0rms and CDrms and local minimum values of CDrms, the domain U*St0=0.4–0.65 is further investigated.
(a) x0rms (b) CDrms
Figure 11. Root-mean-square value of streamwise cylinder displacement (a) and drag coefficient (b) against U*St0 (zoom-in) for Re0=100, 140, 180
4.2. Investigating the vicinity of U*St0=0.5
In order to investigate the significance of local maximum points identified in x0rms and CDrms and local minimum point found in CDrms, the phase angle Φ between x0 and CD is computed. Figure 12 shows CDrms against U*St0 for Re0=180 (Fig. 12c) and time
0.0000 0.0002 0.0004 0.0006 0.0008 0.0010 0.0012 0.0014 0.0016
0.4 0.45 0.5 0.55 0.6 0.65 x0rms
U*St0
Re0=100 Re0=140 Re0=180
0 0.002 0.004 0.006 0.008 0.01 0.012 0.014
0.4 0.45 0.5 0.55 0.6 0.65 CDrms
U*St0
Re0=100 Re0=140 Re0=180
30
histories of drag coefficient and streamwise cylinder displacement (Fig. 12a, b, d, e) for different U*St0 values. It can be seen in the figure that there is an irregular change in the phase difference between x0 and CD at around U*St0=0.5. At U*St0 < 0.5 x0 and CD are in phase, so the phase angle between the signals is Φ≅0° and in the vicinity of
U*St0=0.5 (when CDrms approaches zero) the phase angle jumps to Φ=180°.
31 1.36
1.3 1.33
0.02
0.014 0.017
570 580
t [–]
CD [–] a) U*St0=0.4671 x0 [–]
1.33
1.315 1.325
1.32
0.023
0.020 0.022
570 580
t [–]
CD [–] x0 [–]
0.021 a) U*St0=0.5359
(c) CDrms
1.328
1.32 1.324
0.021
0.017
570 580
t [–]
CD [–] x0 [–]
0.019
a) U*St0=0.4921
0.021
0.018
570 580
t [–]
CD [–] x0 [–]
a) U*St0=0.4983 1.335
1.322 1.323
1.3225 0.019
0.020
Figure 12. Time histories of drag coefficient (blue triangular marker) and streamwise cylinder displacement (green circular marker) belonging to different U*St0 values
0 0.002 0.004 0.006 0.008 0.01 0.012 0.014
0.4 0.45 0.5 0.55 0.6 0.65
CDrms
U*St0
32
The phase angle Φ computed using Hilbert transformation is shown in Fig. 13 against U*St0 for the investigated Re0 values. The jump in the phase between 0° and 180° can be clearly seen.
Figure 13. Phase angle between x0 and CD against U*St0 for Re0=100, 140, 180
The total drag coefficient is composed of two parts: one is due to pressure CDp and another part originating from friction on the cylinder wall CDv, as stated by Eq. (9). The rms values of CDp and CDv in the range U*St0=0.4–0.65 show different behaviors, as can be seen in Fig. 14. Although both quantities have maximum and minimum values in this range, the variation of CDprms is similar to CDrms (Fig. 11b), while the change in CDvrms is similar to the characteristics of x0rms (Fig. 11a).
0 20 40 60 80 100 120 140 160 180
0.4 0.45 0.5 0.55 0.6 0.65
Φ
U*St0
Re0=100 Re0=140 Re0=180
33
(a) CDprms (b) CDvrms
Figure 14. Root-mean-square values of drag due to pressure (a) and drag due to viscosity (b) against U*St0 for Re0=100, 140, 180
For this reason Φv (phase angle between CDv and x0) and Φp (phase angle between CDp and x0) are computed and shown for the investigated Re0 values in Fig. 15. As expected, the changes in Φv and Φp are different. In the range of U*St0≅0.4–0.5 there is a Φv≅35° phase shift between CDv and x0. After this period Φv changes gradually until it reaches approximately 180° (see Fig. 15b). In contrast, CDp and x0 are approximately in phase between U*St0=0.4 and 0.5, while in the vicinity of U*St0=0.5 the phase angle changes abruptly to Φp=180° (see Fig. 15a).
The tendencies of Φp and Φ are very similar (see Figs. 15a and 13), therefore pressure distribution around the cylinder surface influences the flow structure more strongly than friction does. This behavior is similar to that observed by Prasanth and Mittal (2008) for Re0=100, who found an abrupt jump in the phase between the lift coefficient and transverse displacement from Φ=0° to 180° (between Re=110 and 115).
Decomposing lift into pressure lift CLp and viscous lift CLv they showed that the pressure
0 0.002 0.004 0.006 0.008 0.01 0.012
0.4 0.45 0.5 0.55 0.6 0.65 CDprms
U*St0
Re0=100 Re0=140 Re0=180
0.0000 0.0005 0.0010 0.0015 0.0020 0.0025 0.0030
0.4 0.45 0.5 0.55 0.6 0.65 CDvrms
U*St0
Re0=100 Re0=140 Re0=180
34
component is responsible for the jump, since the viscous component remains in phase with the displacement.
(a) ϕp (b) ϕv
Figure 15. Phase angle values Φv (a) and Φp (b) against U*St0 for Re0=100, 140, 180
In Fig. 16 limit cycle curves (time histories of viscous drag versus those of pressure drag) are shown for the vicinity of U*St0=0.5 for Re0=140. It can be seen that below U*St0≅0.4904 the orientation of the curves is clockwise, indicated by filled arrows (see Fig. 16). At U*St0 > 0.4904 the orientation switches abruptly to counterclockwise direction (shown by empty arrows in Fig. 16), which means that pressure and viscous drag become nearly antiphase. This substantial change is mainly caused by pressure drag, since Φv increases gradually in this regime (Fig. 15b) in contrast to Φp, which jumps abruptly between Φp=0° and 180° at around U*St0=0.5 (Fig. 15a). The
amplitudes of signals CDp and CDv (not shown here) are almost identical in the vicinity of U*St0=0.5. These two features (antiphase and equal signal amplitudes) nearly cancel each other out, resulting in an approximately zero value of CDrms (shown in Fig. 11b).
0 20 40 60 80 100 120 140 160 180
0.4 0.45 0.5 0.55 0.6 0.65
Φp
U*St0
Re0=100 Re0=140 Re0=180
0 20 40 60 80 100 120 140 160 180
0.4 0.45 0.5 0.55 0.6 0.65
Φv
U*St0
Re0=100 Re0=140 Re0=180
35
0.9755
0.9705
0.369 0.375
C
Dv[–]
C
Dp[– ]
0.973
0.372
U*St0=0.4822
U*St0=0.4863 U*St0=0.4904
U*St0=0.4945 U*St0=0.4987
U*St0=0.5028
Figure 16. Limit cycle curves (CDv, CDp) in the vicinity of U*St0=0.5 for Re0=140
The abrupt change in the limit cycle curves shown in Fig. 16 suggests that the path of the cylinder also changes strongly in this domain. Figure 17 shows the power spectra (FFT) of the x and y components of the cylinder displacement for U*St0=0.9246 and Re0=180. The intensity value I on the vertical axis is normalized by its maximum value Imax. It can be seen in the figure that the vibration frequency in the streamwise direction is double that in the transverse direction (𝑓𝑥∗=2𝑓𝑦∗), which is true for all of the
investigated cases except in the chaotic flow regime.
36
1
0.8
0.6
0.4
0.2
0
0 0.2 0.4 0.6 0.8 1
I/Imax
f f*x=0.4016
(a) 𝑓𝑥∗
1
0.8
0.6
0.4
0.2
0
0 0.2 0.4 0.6 0.8 1
I/Imax
f f*y=0.2008
(b) 𝑓𝑦∗
Figure 17. Power spectra of streamwise (a) and transverse (b) components of cylinder response for U*St0=0.9246 and Re0=180
These peak values result in a distorted figure-eight (or Lissajou curve) cylinder path that can be written mathematically as follows:
𝑥0(𝑡) = 𝑥0𝑚𝑎𝑥cos(4𝜋𝑓𝑥∗𝑡 + 𝛩), (15) 𝑦0(𝑡) = 𝑦0𝑚𝑎𝑥sin (2𝜋𝑓𝑦∗𝑡), (16) where Θ is the phase angle between x and y vibration components. Phase angle Θ determines both the shape and the orientation of the moving trajectory. In case of Θ > 0 the orbit is clockwise (CW) in the upper loop of the cylinder path, while with Θ < 0 values counterclockwise (CCW) cylinder paths are obtained. Eqs. (15) and (16) do not satisfy in the transition regime between initial and lower branches, where the cylinder motion is not quasi-periodic. In Fig. 18 the direction of cylinder orbit is shown for CW (filled arrows) and CCW (empty arrows) for the intersection of a distorted figure-eight path.
37
x y
CW Θ>0
CCW Θ<0
Figure 18. Direction of cylinder orbit (CW – clockwise, CCW – counterclockwise) for a distorted figure-eight path
Phase angles between the two oscillation components are computed and plotted against U*St0 for the investigated Re0 values in Fig. 19. It can be seen that CW cylinder motion occurs in the approximate range of U*St0=0.4–0.5 and CCW orbits are found above U*St0≅0.5. It is obvious from the figure that Θ varies strongly at the vicinity of U*St0=0.5. In Fig. 20 cylinder trajectories are shown for various U*St0 values for Re0=180. It can be seen that by increasing U*St0 the phase angle sharply decreases, approaching zero at U*St0≅0.487 at the same value at which the local minimum value was identified in CDrms (see also Fig. 11b).