Dániel Dorogi
∗, László Baranyi
Department of Fluid and Heat Engineering, University of Miskolc, 3515 Miskolc-Egyetemváros, Hungary
a r t i c l e i n f o
Article history:
Received 11 February 2020 Received in revised form 4 June 2020 Accepted 24 August 2020
Available online xxxx
Keywords:
CFD
Low Reynolds number Phase differences
second harmonic component Upper branch
Vortex-induced vibration
a b s t r a c t
In this study flow around a circular cylinder undergoing transverse-only vortex-induced vibrations is investigated using a two-dimensional in-house CFD code. The Navier–Stokes equations, the continuity and pressure Poisson equations written for an incompressible constant property Newtonian fluid coupled with the structural equation are solved using the finite difference method. Systematic computations are carried out for different damping ratio values between ζ = 0% and 5%. Reduced velocity is varied in U∗ = 2.5−7.5, while Reynolds number and mass ratio are fixed atRe=300 andm∗=10, respectively. Up until now, researchers have reported an upper branch only at high Reynolds numbers and lowm∗ζ values. However, in this study we have observed a three-branch behavior (initial, upper and lower branches) atRe = 300 for ζ ≤ 1%.
The upper branch is bounded by two gradual phase changes: at the boundary adjacent to the initial branch, the time-averaged phase difference of vortex force, and at the boundary to the lower branch, the time-averaged phase difference of transverse fluid force relative to the cylinder displacement changes between 0◦and 180◦. Unbounded variations and phase slips are observed in the time-dependent phase differences, which explains the gradual changes in their time-mean values. In some ranges of the upper branch the second harmonic frequency component plays an important role in the spectra of transverse fluid force, which is closely related to the observed asymmetrical vortex structure. Increasing the structural damping above ζ = 1%, only initial and lower branches are found. The comparison of peak oscillation amplitude against an empirical relationship provided in the literature shows very good agreement forζ≥1%. A Griffin plot is also used for the comparison of peak response data where the currently obtained results and those in the literature collapse onto almost a single curve.
©2020 The Author(s). Published by Elsevier Ltd. This is an open access article under the CC BY-NC-ND license (http://creativecommons.org/licenses/by-nc-nd/4.0/).
1. Introduction
Fluid flow around bluff bodies has been thoroughly investigated in the past few decades due to its large number of engineering applications. It plays an important role for instance in offshore structures, high slender buildings or heat exchangers. Vortices shedding from bluff bodies can induce the vibration of the structure, which is referred to asvortex- induced vibrations(VIV). Various effects of VIV were shown for example byBearman(1984,2011),Blevins(1990),Sarpkaya (2004), andWilliamson and Govardhan(2004).
∗ Corresponding author.
E-mail addresses: aramdd@uni-miskolc.hu(D. Dorogi),arambl@uni-miskolc.hu(L. Baranyi).
https://doi.org/10.1016/j.jfluidstructs.2020.103135
0889-9746/©2020 The Author(s). Published by Elsevier Ltd. This is an open access article under the CC BY-NC-ND license (http://creativecommons.
org/licenses/by-nc-nd/4.0/).
Nomenclature Latin symbols
b Structural damping [kg s−1]
Cv Vortex force coefficient, 2Fv/(ρU∞2d) [–]
CA Added mass coefficient [–]
Cy Transverse fluid force coefficient, 2Fy/(ρU∞2d) [–]
D Dilation, non-dimensionalized byU∞/d d Cylinder diameter, length scale [m]
f∗ Vibration frequency, non-dimensionalized byU∞/d fC∗v Frequency of vortex force, non-dimensionalized byU∞/d fC∗
y Frequency of transverse fluid force, non-dimensionalized byU∞/d fN Natural frequency of the cylinder in vacuum, 1/(2π)√
k/m[s−1] Fp Potential added mass force per unit length of the cylinder [N m−1] Fv Vortex force per unit length of the cylinder [N m−1]
Fy Transverse fluid force per unit length of the cylinder [N m−1] fv0 Vortex shedding frequency for a stationary cylinder [s−1] k Spring constant [kg s−2]
m Cylinder mass per unit length [kg m−1] m∗ Mass ratio,m∗=4m/(ρd2π) [–]
mA Added mass of fluid per unit length of the cylinder,CAρd2π/4 [kg m−1] p Pressure, non-dimensionalized byρU∞2 [–]
R Radius, non-dimensionalized byd[–]
Re Reynolds number,ρU∞d/µ[–]
St Dimensionless vortex-shedding frequency for a stationary cylinder, Strouhal number,fv0d/U∞[–]
t Time, non-dimensionalized byd/U∞[–]
u,v Velocity components inxandydirections, non-dimensionalized byU∞[–]
U∗ Reduced velocity based on the cylinder’s natural frequency in vacuum,U∞/(fNd) [–]
U∞ Free steam velocity, velocity scale [m s−1]
x,y Cartesian coordinates, non-dimensionalized byd[–]
y0 Cylinder displacement, non-dimensionalized byd[–]
Greek symbols
ηmax Number of grid points in radial direction [–]
Φ Phase difference betweenCyandy0, transverse phase [–]
Φv Phase difference betweenCvandy0, vortex phase [–]
µ Dynamic viscosity of the fluid [Pa s]
ρ Fluid density [kg m−3]
ξmax Number of grid points in peripheral direction [–]
ζ Structural damping ratio,b/(2√ km) [–]
Subscripts and superscripts
x Streamwise
y Transverse
0 Cylinder response
1, 2 On the cylinder surface, at the outer boundary of the computational domain
In this study vortex-induced vibration of a circular cylinder is analyzed using a numerical approach. Although in reality the cylinder moves in two degrees of freedom (both streamwise with and transverse to the main stream), transverse- only vibration is often used to model VIV.Feng(1968),Brika and Laneville(1993), andKhalak and Williamson(1999) showed that the cylinder response (amplitude and frequency values) depends highly on the mass-damping parameter m∗ζ, wherem∗is the mass ratio (cylinder mass divided by the mass of the displaced fluid), andζis the structural damping ratio.Feng(1968) andBrika and Laneville(1993) investigated high-m∗ζcases. Plotting the amplitude of cylinder oscillation against reduced velocity they found two response branches — initial and lower branches, where the initial branch was
v
branch transition range, where the vortex structure switches from 2Sto 2Pmode. In this range the cylinder displacement remained in-phase with the transverse fluid force. However, in the transition domain between upper and lower branches (where no significant changes were identified in the wake mode)Φwas found to jump from 0◦to 180◦, and the vortex force remained out-of-phase with the cylinder displacement.
Klamo et al.(2006) investigated the effects of structural damping ratio and Reynolds number on the cylinder response.
They showed that by increasingζthe high-amplitude three-branch response switches to two-branch response, where the oscillation amplitude is significantly lower.Soti et al. (2018) carried out a systematic experimental study for different ζ values. In addition to the cylinder response, they analyzed the power transfer between the oscillating cylinder and the surrounding fluid. They identified three-branch response for a wide damping ratio range; they showed the occurrence of upper branch even at low oscillation amplitudes (down toyˆ0=0.2, whereyˆ0is the oscillation amplitude non-dimensionalized by the cylinder diameter). Bernitsas et al. (2008) andLee and Bernitsas (2011) investigated the possibilities of energy harvesting from vortex-induced vibrations.Bernitsas et al.(2008) derived an analytical formula for the calculation of power transfer based on harmonic approximations. They found that power transfer is zero whenΦ (orΦv) equals to 0◦and 180◦, i.e. for undamped vibrations. Their formula reveals also that increasing structural damping ratio, power transfer can be increased, which agrees well with the experimental results ofSoti et al.(2018). Konstantinidis et al.(2019) analyzed energy transfer (analogous with the power transfer) from another perspective using laboratory measurements at very low mass-damping values. They decomposed the total hydrodynamic force acting on the cylinder into components parallel with and normal to the time-dependent vector of the cylinder’s relative velocity, i.e. the drag and lift forces, respectively. They showed that drag does only negative work on the vibrating cylinder, while the work done by the lift is positive in most of the investigated cases.
Klamo et al.(2006) andGovardhan and Williamson(2006) showed that cylinder response is significantly influenced by Reynolds numberRe=ρU∞d/µ, whereρis the fluid density,U∞is the free stream velocity,dis the cylinder diameter, and µis the dynamic viscosity of the fluid. Most of the experiments are carried out in the Reynolds number range of Re=O(103−104). However, due to the high computational time demand numerical simulations are usually carried out in the low-Reynolds-number range [Re=O(102)]. Another issue is the three-dimensionality of the flow structure.Barkley and Henderson (1996), using linear stability analysis, found that the flow around a stationary cylinder is fully two- dimensional up toRe∼=189. They reported three-dimensional (3D) instabilities atRe∼=189 (Mode A) and atRe∼=259 (Mode B).Koide et al.(2002) carried out laboratory measurements for a mechanically oscillated cylinder at the Reynolds number of Re ∼=3500. They demonstrated that the cross-correlation coefficient of the velocities measured at different locations along the cylinder’s span significantly increases when the cylinder is oscillated at relatively large amplitudes.
This effect indicates that the synchronization between cylinder vibration and vortex shedding (i.e. lock-in) increases the two-dimensionality of the flow.Bearman and Obasaju(1982) showed a similar phenomenon using fluctuating pressure measurements for a square cylinder: by oscillating the body at relatively high amplitudes, the spanwise coherency of the flow structure increases.Poncet(2002) carried out 3D computations atRe = 500 for a stationary cylinder, where Mode B instability developed. He showed that soon after beginning to apply high-amplitude rotary oscillations the three-dimensional instability vanished and the flow became fully two dimensional. Since there are several independent parameters for the case of a vibrating cylinder (e.g. Reynolds number, oscillation amplitude, and frequency values), the upper limit of the two-dimensionality has not yet been determined. There are several important studies in the literature performing 2D computations at higher Reynolds numbers (Re > 189). For exampleBlackburn and Henderson(1999) investigated the flow around a transversely oscillated cylinder at the Reynolds number of 500, whileSingh and Mittal (2005) analyzed two-degree-of-freedom vortex-induced vibrations of a circular cylinder atRe ranging between 50 and 500.
Computational results available in the literature show that oscillation amplitudes for low Reynolds numbers are signif- icantly lower (yˆ0∼=0.55, seeNavrose and Mittal,2017) compared to high-Reexperiments (yˆ0∼=0.8, seeGovardhan and Williamson,2000).Anagnostopoulos and Bearman(1992) obtained similar characteristics using measurement techniques in the range of Re = 90−150. Using CFD simulationsLeontini et al.(2006b) found two-branch cylinder response at the parameter combination ofRe = 200,m∗ = 10, andζ = 1%. The vortex structures are markedly different from
those observed at high Reynolds numbers: 2S and C(2S) wake modes were found in the initial and lower branches, respectively. HereC refers to the coalescence of the positive and negative vortices in the cylinder wake. Navrose and Mittal(2017) carried out numerical simulations atRe=100 andζ =0% using different mass ratio values in the range ofm∗=30−150. They found a narrow reduced velocityU∗=U∞/(fNd) range in the middle of the lower branch where the oscillation amplitude was low and the vibration frequency did not synchronize with the cylinder’s natural frequency.
They also showed that the width of this low-amplitude domain extends withm∗.
As was pointed out earlier, the vortex structures at low and high-Reynolds-number flows are quite different.Williamson and Roshko(1988) carried out forced vibration experiments in the range ofRe=300−1000, and created a wake mode map (the well-known Williamson-Roshko map). It can be seen from their results that the 2P vortex structure plays an important role in the fundamental lock-in domain, which was confirmed by the free vibration results ofBrika and Laneville (1993),Khalak and Williamson(1997,1999), andGovardhan and Williamson(2000). In addition,Williamson and Roshko (1988) identified theP+Sasymmetrical mode (a vortex pair and a single vortex are shed) at high vibration amplitudes (yˆ0 = 1−2), which is not so typical in VIV cases. They found that decreasing the Reynolds number belowRe = 300 the 2P mode in the fundamental synchronization range may be replaced by the P +S vortex structure. The forced vibration CFD results ofMeneghini and Bearman (1995) and Blackburn and Henderson(1999) confirmed this finding:
they did not observe the 2Pmode of vortex shedding but they found theP+Svortex structure.Leontini et al.(2006a) carried out systematic forced vibration computations atRe≤300. Similar to the experiments ofWilliamson and Roshko (1988), Leontini et al.(2006a) investigated the effects of forcing frequency and amplitude and created wake mode maps atRe=100 and 300. AtRe=100 theP+Smode occurred only overyˆ0=0.9. However, atRe=300 they did identify theP+Svortex structure aroundyˆ0 =0.55 (and near the fundamental lock-in domain) that can be reached in low-Re VIV.
The numerical studies investigating vortex-induced vibrations at low Reynolds numbers have not reported an upper branch even for undamped systems (see e.g.Leontini et al.,2006bandNavrose and Mittal,2017). However,Evangelinos and Karniadakis(1999) reported that theP +S vortex pattern may also be associated with the upper branch, which is rarely identified in VIV cases.Singh and Mittal (2005) investigated two-degree-of-freedom vortex-induced vibrations numerically, and found the P +S vortex structures above Re = 300. Dorogi and Baranyi(2019) also observed the asymmetricalP+S wake mode close toRe=300, which caused an asymmetrical orbital (‘‘raindrop-shaped’’) cylinder motion.
The main objective of this study is to explore whether an upper branch, i.e. three-branch cylinder response, can exist at the Reynolds number ofRe=300. To accomplish this aim, two-dimensional numerical simulations are carried out at this Reynolds number using mass ratio value ofm∗=10. Damping ratio values in the range ofζ =0% and 5% are considered, and reduced velocity is varied betweenU∗ = 2.5 and 7.5. Oscillation amplitude and frequency, time-dependent and time-averaged phase angles, frequency spectra, and vortex structures are analyzed.
2. Governing equations and solution methodology
In this study vortex-induced vibration (VIV) of a circular cylinder placed into a uniform stream is investigated by means of CFD (Computational Fluid Dynamics) computations at low Reynolds numbersRe=ρU∞d/µ. Hereρis the fluid density,U∞is the free stream velocity,dis the cylinder diameter and,µis the dynamic viscosity of the fluid. The cylinder is elastically supported only in transverse direction. Its displacement, velocity, and acceleration values are obtained by solving Newton’s second law of motion. This equation in non-dimensional form can be written as follows:
¨y0+4πζ U∗ y˙0+
(2π U∗
)2
y0= 2Cy
πm∗, (1)
wherey0,y˙0, andy¨0are the dimensionless cylinder displacement, velocity, and acceleration, respectively,U∗=U∞/(fNd) is the reduced velocity based on the cylinder’s natural frequency in vacuumfN,ζ is the damping ratio (structural over critical damping), andm∗ is the ratio of the cylinder’s mass to that of the displaced fluid, i.e. the mass ratio. On the right-hand side of Eq.(1)Cy=2Fy/(ρU∞2d) is the transverse fluid force coefficient whereFyis the transverse fluid force per unit length of the cylinder.
The fluid is assumed to be two-dimensional incompressible constant property and Newtonian. Its motion is governed by the two components of the Navier–Stokes equations and the continuity equation. The equations of motion are written in a non-inertial frame of reference attached to the oscillating cylinder. These equations in non-dimensional forms are written as follows:
∂u
∂t +u∂u
∂x+v∂u
∂y = −∂p
∂x + 1 Re
(∂2u
∂x2 +∂2u
∂y2 )
, (2)
∂v
∂t +u∂v
∂x+v∂v
∂y = −∂p
∂y+ 1 Re
(∂2v
∂x2 +∂2v
∂y2 )
− ¨y0, (3)
D= ∂u
∂x+∂v
∂y =0. (4)
domain. FollowingBaranyi(2008), linear mapping functions are used in this study.
An in-house CFD code based on finite difference method is used to solve the transformed governing equations with the transformed boundary conditions. Space derivatives are approximated using fourth-order accurate difference schemes except for the convective terms for which a third-order modified upwind difference scheme (developed byKawamura et al., 1986) is employed. The linear algebraic equation system obtained from the discretization of pressure Poisson equation is solved using the successive over-relaxation (SOR) method, and continuity equation is satisfied in each time step. Fourth-order Runge–Kutta scheme is applied to determine the displacement, velocity, and acceleration of the cylinder, while the two components of the Navier–Stokes equations are integrated explicitly using the first-order Euler method. Additional details of the computational approach are given inBaranyi(2008).
3. Verification and validation
In this section, first, independence studies are carried out to determine the optimal combination of computational parameters. Afterwards, the results obtained using the in-house code are validated against those presented inBourguet and Lo Jacono(2014) andBlackburn and Henderson(1996).
3.1. Independence studies
The currently applied in-house CFD approach is used with the following parameters: radius ratioR2/R1, grid resolution ξmax×ηmax(number of grid points in peripheral and radial directions, see details inBaranyi(2008)), and dimensionless time step∆t. In order to find the optimal combination of these computational parameters, which is the best compromise between accuracy and computational time, independence studies are required. During these investigations, Reynolds number, mass ratio, structural damping ratio, and reduced velocity are fixed atRe=300,m∗=10,ζ =0%, andU∗=4.65, respectively, and the cylinder is allowed to oscillate only in transverse direction. The root-mean-square (rms) values of cylinder displacementy0′, dimensionless vibration frequencyf∗, the rms values of transverse fluid force coefficientCy′, and the time-mean and rms values of streamwise fluid force coefficientCxandCx′ are investigated.
First, the effect of radius ratio R2/R1 is analyzed. The number of grid points around the cylinder surface is fixed at ξmax = 360, and the dimensionless time step is chosen to be ∆t = 10−4U∗ ∼= 0.0004. Radius ratio values of R2/R1 = 200,240, and 280 are considered. In order to create an equidistant grid on the computational domain, the number of grid points in radial direction is varied with R2/R1;ηmax = 304,314, and 323 are applied. The results are shown inTable 1. It can be seen thatCy′ shows the highest relative difference; forR2/R1 = 200 and 240 its value is 1.47%. The time-mean of streamwise fluid force coefficient displays a smaller error: 0.21% for the sameR2/R1 values, while betweeny0′,f∗, andCx′ the relative difference (forR2/R1 =200 and 240) is under 0.04%. Comparing the results obtained forR2/R1=240 and 280, the relative difference for all of the investigate quantities is under 0.4%. For this reason, R2/R1=240 seems to be appropriate for the further systematic computations.
Second, a grid dependence study is carried out to analyze the influence ofξmax (number of grid points in peripheral direction) on the results.ξmax =300,360, and 420 are investigated, while the radius ratio and dimensionless time step values are fixed atR2/R1 = 240 and∆t =0.0004, respectively. To generate an equidistant grid on the computational domain,ηmaxis varied withξmax;ηmax =262,314, and 366 are used. The results of the grid dependence test are shown
Table 1
Effect of radius ratio on the computational results for (Re,U∗,m∗, ζ)=(300,4.65,10,0%).
R2/R1 y0′ f∗ Cy′ Cx Cx′
200 0.3961 0.2135 0.2080 2.0158 0.6497
240 0.3962 0.2134 0.2111 2.0112 0.6498
280 0.3962 0.2134 0.2120 2.0094 0.6498
Table 2
Results of grid dependence study for (Re,U∗,m∗, ζ)=(300,4.65,10,0%).
ξmax y0′ f∗ Cy′ Cx Cx′
300 0.3963 0.2135 0.2065 2.0156 0.6486
360 0.3962 0.2134 0.2111 2.0112 0.6498
420 0.3962 0.2134 0.2125 2.0103 0.6504
Table 3
Effect of dimensionless time step for (Re,U∗,m∗, ζ)=(300,4.65,10,0%).
∆t y0′ f∗ Cy′ Cx Cx′
0.0008 0.3964 0.2134 0.2146 2.0102 0.6518
0.0004 0.3962 0.2134 0.2111 2.0112 0.6498
0.0002 0.3962 0.2134 0.2097 2.0112 0.6489
inTable 2. Similarly to the data included inTable 1,Cy′ shows the highest relative difference: 2.18% forξmax=300 and 360. As seen, the relative differences inCxandCx′ are smaller; 0.22% and 0.18%, respectively, when comparing the results atξmax=300 and 360. Betweeny0′andf∗(also forξmax=300 and 360), the relative difference does not exceed 0.05%. It is also shown inTable 2that forξmax=360 and 420 the relative difference betweeny0′,f∗,Cy′,Cx, andCx′ is under 0.7%.
Therefore,ξmax=360 seems to be adequate for further systematic simulations.
Finally, computations are carried out to test the dependence of computational results on the dimensionless time step.
∆t1 =2·10−4U∗,∆t2=10−4U∗, and∆t3=5·10−5U∗time step values are considered. At the reduced velocity value applied in this particular independence study (U∗=4.65),∆t1,∆t2, and∆t3are 0.0008, 0.0004, and 0.0002, respectively.
The radius ratio and grid resolution values are fixed atR2/R1=240 andξmax×ηmax=360×314. The results are shown inTable 3. Again, the highest relative difference is observed inCy′: 1.66% for∆t1and∆t2, and 0.66% for∆t2and∆t3. The errors inCx′ are smaller: 0.31% when comparing the results for∆t1and∆t2, and 0.1% for∆t2and∆t3. It is also shown that the relative difference betweeny0′,f∗, andCxare negligible; these are under 0.05% for∆t1and∆t2, and also for∆t2
and∆t3. Thus, the dimensionless time step value of∆t =10−4U∗seems to be appropriate for further computations.
3.2. Validation
Validation is carried out using the previously determined computational parameters.Bourguet and Lo Jacono(2014) investigated undamped (ζ =0%) transverse-only vortex-induced vibrations of a rotating cylinder at the Reynolds number and mass ratio values of Re = 100 and m∗ = 40/π, respectively, using a numerical approach. Fig. 1 shows the dimensionless oscillation amplitudeˆy0against reduced velocity for a non-rotating cylinder. It can be seen that our results and those obtained byBourguet and Lo Jacono(2014) compare well.
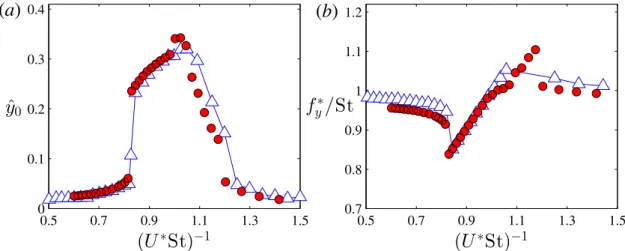
Blackburn and Henderson (1996) analyzed two-degree-of-freedom VIV of a circular cylinder by means of two- dimensional CFD computations. Reynolds number, mass ratio, and structural damping ratio values are fixed atRe=250, m∗ = 40/π, andζ = 1%, respectively.Fig. 2a shows the dimensionless oscillation amplitude, and in Fig. 2b the non- dimensional vibration frequency normalized by the dimensionless vortex shedding frequency for a stationary cylinder (Strouhal number)f∗/Stis shown against (U∗St)−1. The calculation methodology off∗is the same as that applied inDorogi and Baranyi(2019); the dimensionless vibration frequency of the cylinder appears to be the highest intensity frequency peak in the FFT (Fast Fourier Transform) spectra of the non-dimensional cylinder displacement. It can be seen inFig. 2 that the currently obtained results agree well with those presented inBlackburn and Henderson(1996). Note that higher discrepancies can be observed between (U∗St)−1∼=1 and 1.2 at the boundary of the lock-in domain where the solution depends highly on the reduced velocity.
Baranyi(2008) and Dorogi and Baranyi (2018, 2019) show further validation against numerical and experimental results available in the literature for both stationary and oscillating cylinder cases. All of these studies reported good agreement.
4. Results and discussion
As mentioned in Section 1, the vortex-induced vibration shows very different features at high and low Reynolds numbers. For high-Recases, depending on the combined mass-damping parameterm∗ζand also on the Reynolds number, two and three-branch responses can be found. In contrast, in the low-Reynolds-number domain, independently ofm∗ζ, only two-branch cylinder response has been identified; an upper branch has not yet been observed.
The main objective of this study is twofold; first, to investigate whether an upper branch (i.e. a three-branch cylinder response) can exist in the low-Redomain, and second, to analyze the effect of structural damping ratio on the cylinder response. For these aims, systematic CFD computations are carried out at fixed Reynolds number and mass ratio values ofRe=300 andm∗=10, respectively. Damping ratio betweenζ=0% and 5% is considered, that is, the combined mass- damping parameter is chosen to be in the range ofm∗ζ =0 and 0.5. Reduced velocity based on the natural frequency of the cylinder in vacuum is varied fromU∗=2.5 to 7.5.
Fig. 1. Transverse-only vibration results: dimensionless oscillation amplitude ˆy0 against U∗ for (Re,m∗, ζ) =(100,40/π,0%). Present study;
Bourguet and Lo Jacono(2014).
Fig. 2. Two-degree-of-freedom vibration results: dimensionless oscillation amplitudeyˆ0(a) and non-dimensional vibration frequency normalized by the Strouhal numberf∗/St(b) against (U∗St)−1for (Re,m∗, ζ)=(250,40/π,1%). Present study; Blackburn and Henderson(1996).
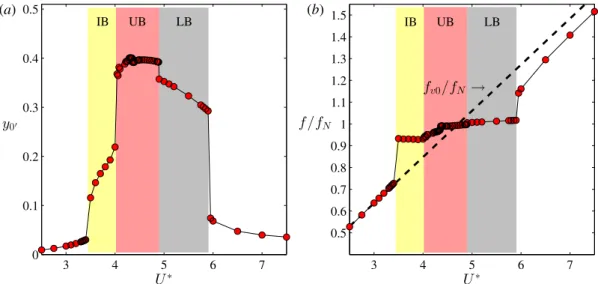
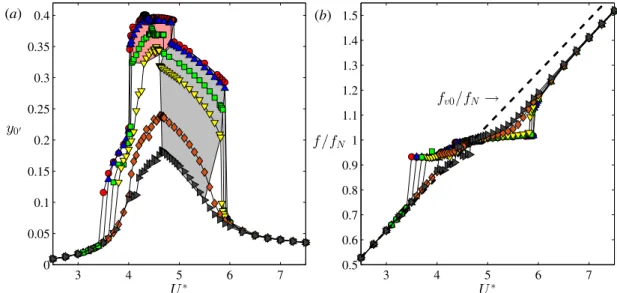
Fig. 3a shows the root-mean square (rms) values of non-dimensional cylinder displacementy0′, and in Fig. 3b the vibration frequency normalized by the cylinder’s natural frequency in vacuum f/fN is plotted against U∗ forζ = 0%.
Similarly to that presented in Section3.2, the oscillation frequency is calculated using the Fast Fourier Transform (see alsoDorogi and Baranyi,2019). The dashed line inFig. 3b representsfv0/fN, wherefv0is the vortex shedding frequency for a stationary cylinder. The different response branches, namely the initial branch (IB), the upper branch (UB), and the lower branch (LB) identified in this study are shaded in different colors. It can be seen inFig. 3 that in the range of 2.5≤U∗≤3.5 the oscillation amplitude is low and the vibration frequency is close to the vortex shedding frequency for a stationary cylinder (f ∼=fv0). FromU∗=3.5 to 4 an initial branch is identified, wheref/fNrepresents an approximately constant value off/fN∼=0.95 andy0′ increases intensively.
BetweenU∗=4 and 5.9lock-inorsynchronizationis observed, where the vibration frequency locks to approximately the natural frequency of the cylinder (see Fig. 3b). The entire lock-in domain can be divided into two subdomains.
Relatively high oscillation amplitudes are observed in the range of 4 < U∗ ≤ 4.89 (see Fig. 3a), where the vibration frequency is slightly lower than the cylinder’s natural frequency (f/fN < 1, Fig. 3b). This reduced velocity domain appears to correspond to the upper branch. In order to confirm this, additional analyses are needed, which are presented in Section 4.1. At the higher boundary of the suggested upper branch y0′ drops abruptly by 7%, and f passes through fN.Govardhan and Williamson(2000) identified similar phenomena at the boundary separating upper and lower branches forRe ∼= 103−104. BetweenU∗ = 4.89 and 5.9 the lower branch is observed, wheref is slightly higher thanfN (see Fig. 3b), andy0′ reaches intermediate values (Fig. 3a). The reduced velocity range aboveU∗ =5.9 is out of the lock-in domain; the oscillation amplitude is low (y0′ ∼= 0.1), and the vibration frequency is close again to the vortex shedding frequency for a stationary cylinder.
Fig. 3. Root-mean-square values of transverse cylinder displacementsy0′ (a) and vibration frequency normalized by the natural frequency of the cylinder in vacuumf/fN (b) against reduced velocity for zero structural damping ratioζ=0%. Each response branch is shaded in a different color.
Govardhan and Williamson(2000), based on the methodology introduced byLighthill(1986), applied the following decomposition on the instantaneous transverse fluid forceFy:
Fy=Fv+Fp. (6)
In this formulaFv andFp are the instantaneous vortex force and potential added mass force, respectively, per unit length of the cylinder. The potential added mass force is defined as follows (Govardhan and Williamson,2000):
Fp= −CAmd¨
˜y0, (7)
whereCAis the potential added mass coefficient, which is equal to unity for a circular cylinder (Blevins,1990),md=ρd24π is the displaced mass per unit length of the cylinder, and¨
˜y0 is the dimensional cylinder acceleration. Rearranging and normalizing Eq.(6)by 12ρU∞2d, the following expression can be obtained for the instantaneous vortex force coefficient:
Cv=Cy+π
2¨y0, (8)
wherey¨0= d
U∞2
¨
˜y0is the non-dimensional cylinder acceleration.
Fig. 4a and b show the rms values of transverse fluid force and vortex force coefficients Cy′ and Cv′, respectively, againstU∗ for ζ = 0%. It can be seen that for low cylinder displacements, i.e. in the domains of 2.5 ≤ U∗ ≤ 3.45 and 5.9 < U∗ ≤ 7.5,Cy′ and Cv′ are approximately identical and near the value obtained for a stationary cylinder (Cy′ ∼=Cv′ ∼0.5, seeNorberg,2003).Govardhan and Williamson(2000) foundCy′ ∼=Cv′ ∼=0.1 in the very low oscillation amplitude range (inU∗ < 4 and U∗ > 10.5 in their study), which is close toCy′ ∼= 0.05, the value identified for a non-oscillating cylinder atRe ∼ 103 (Norberg, 2003). In this sense, the currently obtained CFD results for Re = 300 and the experimental findings ofGovardhan and Williamson(2000) for high Reynolds numbers show good qualitative agreement.
Increasing the reduced velocity in the initial branch,Cy′increases gradually, and reaches its peak value at the beginning of the suggested upper branch (atU∗ = 4, seeFig. 4a). BetweenU∗ = 4 and 4.89Cy′ drops dramatically, moreover at U∗ =4.36 (in the middle of the proposed upper branch) it suffers a sudden change fromCy′ ∼= 0.71 to approximately 0.25. It is also seen inFig. 4a that atU∗=4.89Cy′ shows another but much smaller jump, above which it increases. The experimental results ofGovardhan and Williamson(2000) and the above-mentioned tendencies in the current results are very similar. However, an abrupt change in Cy′ in the middle of the upper branch has not been identified in the high-Reynolds-number domain; this jump may indicate other important flow phenomena.
The rms values of vortex force coefficient (see Fig. 4b) found to decrease in the initial branch until it reaches its minimum value. The locations of the extreme values inCy′ andCv′ are near to each other. In the proposed upper branch Cv′strongly increases, and atU∗=4.36 (the corresponding reduced velocity value whereCy′showed to jump)Cv′changes suddenly betweenCv′ ∼=0.53 and 1.02. Similarly again to the tendencies observed inCy′, atU∗=4.89Cv′ shows another but much smaller jump. The peak value inCv′is observed at the beginning of the lower branch, which qualitatively agrees well with the finding ofGovardhan and Williamson(2000).
Fig. 4. Root-mean-square values of transverse fluid force coefficientCy′(a) and vortex force coefficientCv′(b) against reduced velocity forζ=0%.
Each response branch is shaded in a different color.
4.1. Phase dynamics for undamped vibrations
The results presented earlier show that the upper branch most likely exists at the Reynolds number of 300. In order to confirm this proposal, additional analyses are required. Vortex-induced vibration of a circular cylinder is commonly investigated analytically using the harmonic oscillator model (Govardhan and Williamson,2000). Let us assume that the motion of the cylinder and the aerodynamics force coefficients are sinusoidal functions of time:
y0(t)= ˆy0sin 2πf∗t, (9)
Cy(t)= ˆCysin(2πf∗t+Φ), (10)
Cv(t)= ˆCvsin(2πf∗t+Φv), (11)
where the hat symbol (. . .ˆ) refers to amplitude. In these formulæCˆ
yandCˆvare the amplitude of the transverse fluid force and vortex force coefficients, andyˆ0andf∗are the non-dimensional oscillation amplitude and frequency values. In these expressionsΦandΦvare the phase differences (or phase angles) for transverse fluid force and vortex force, respectively, relative to the cylinder displacement. For the sake of simplicity,ΦandΦvwill be referred to as thetransverseandvortex phases, respectively. Substituting Eqs.(9) and(10)into the cylinder equation of motion (see Eq.(1)), and equating the coefficients of sine and cosine terms, the following expressions can be obtained:
cosΦ =2π3m
∗yˆ0 CˆyU∗2
(1−f∗2U∗2), (12)
sinΦ =4π3m
∗ζyˆ0
CˆyU∗ f∗. (13)
It can be seen in Eq. (13)that for zero structural damping, sinΦ = 0; therefore, the cylinder motion can only be in-phase (Φ=0◦) or out-of-phase (Φ=180◦) with the transverse fluid force. Eq.(12)shows that the transverse phase changes abruptly betweenΦ=0◦and 180◦at the boundary where the vibration frequency passes through the natural frequency of the cylinder in vacuum, i.e. atf∗U∗=1.
Introducing Eqs.(8),(9), and(11)into Eq.(1), and equating the coefficients of sine and cosine functions, the following formulæ are obtained:
cosΦv =2π3(m
∗+CA)yˆ0 CˆvUA∗2
(1−f∗2UA∗2), (14)
sinΦv =4π3
√m∗(m∗+CA)ζyˆ0 CˆvUA∗
f∗, (15)
whereUA∗=U∞/(fN,ad) is the reduced velocity based on the cylinder’s natural frequency in still fluidfN,a. Eq.(15)indicates that for undamped vibrations the cylinder displacement can only be in-phase or out-of-phase with the vortex force, similar
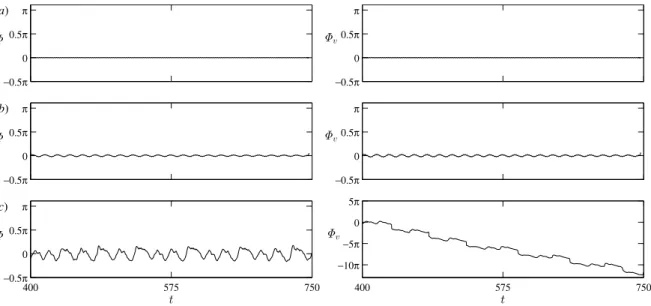
Fig. 5. Time histories of transverse phaseΦ (left) and vortex phaseΦv(right) at reduced velocity values ofU∗=3 (a) and 3.36 (b) corresponding to the very low amplitude range, and atU∗=4 (c) in the initial branch forζ=0%.
toΦ, as shown earlier. As can be seen in Eq.(14),Φvchanges suddenly between 0◦and 180◦atf∗UA∗=1, i.e. at the point wheref crossesfN,a.
Govardhan and Williamson(2000) carried out an experimental study at high Reynolds numbers [Re=O(103−104)]
and low mass and damping values. They found thatΦvandΦjump at different reduced velocity values. TheU∗domain which is enclosed between the two phase jumps (inΦvat its beginning, and inΦ at its higher boundary) corresponds to the frequently mentioned upper branch. In other words, to confirm that the range of 4<U∗≤4.89, where relatively high oscillation amplitudes are found, represents the upper branch,ΦandΦvshould be investigated.
Pikovsky et al.(2001) defined phase angle as the phase difference between the displacement and the force. For the sake of comparison, we defined phase angles such thatΦ = ΦCy −Φy0 and Φv = ΦCv −Φy0. In these expressions ΦCy,ΦCv, andΦy0 are the time-dependent phases ofCy,Cv, andy0, respectively, which are computed using the Hilbert transform of the corresponding signals (Khalak and Williamson,1999;Pikovsky et al.,2001;Konstantinidis et al.,2020).
In the figures mostly time-dependent phase differences (ΦandΦv) are plotted in radian as unwrapped signals. However, their time-average values (Φ and Φv) are shown in degrees, and are calculated via averagingΦ and Φv wrapped in [−π/2,3π/2].
Fig. 5showsΦ(on the left-hand side) andΦv(right) for different reduced velocity values in the very low amplitude range (seeFig. 5a and b) and in the initial branch (Fig. 5c). It can be seen that in the domain of 2.5 ≤ U∗ ≤ 3.45 transverse and vortex phases are approximately constant; only small oscillations are observed nearU∗=3.45 (Fig. 5b).
In the initial branch (3.45<U∗≤4)Φshows intermediate oscillations, but its time-mean value is roughly zero (Fig. 5c).
However, in the same rangeΦvshows an unbounded decrease, which corresponds to the loss of synchronization between cylinder motion and the vortex force coefficient (Pikovsky et al.,2001). Konstantinidis et al.(2020) found an unbounded change (increase) in the time-dependent transverse phaseΦ in the second half of the upper branch at high Reynolds numbers. InPikovsky et al.(2001) this phenomenon is interpreted by analyzing the relationship between motion and forcing frequencies.
In Fig. 6 differences of vibration frequency relative to the frequency of transverse fluid force and vortex force coefficients, i.e.f∗−fC∗
yandf∗−fC∗v, respectively, are shown againstU∗in the initial, proposed upper, and lower branches.
These quantities are called detuning. It can be seen that in the initial branchf∗ > fC∗v, which explains why the time- dependent vortex phase decreases in this domain (Pikovsky et al.,2001). In addition, the difference between the two frequency values is relatively large in this range (3.45<U∗≤4), which causes the roughly uniform drop in the vortex phase (seeFig. 5c). It is also shown inFig. 6thatf∗−fC∗
y
∼=0 in the initial branch, which implies the roughly constant value of transverse phase.
Based on Fig. 3, the upper branch is expected to appear in the domain of 4 < U∗ ≤ 4.89. This reduced velocity range comprises five subregions with (slightly) different characteristics, which are denoted byUB(I),UB(II),UB(III),UB(IV), andUB(V). These regimes will be detailed in the following part of this study.Fig. 7a and b show the times histories of transverse and vortex phases inUB(I), which covers the domain of 4<U∗≤4.28. In contrast to the trends observed in the initial branch, inUB(I)f∗is lower thanfC∗v (seeFig. 6), which leads to increasingΦv(Fig. 7). It can also be seen in Fig. 6that|f∗−fC∗v|is significantly lower inUB(I) compared to that in the initial branch.Pikovsky et al.(2001) found that when the value of detuning decreases, the time history of the phase difference changes remarkably. As shown inFig. 7,
Fig. 6. Detuning valuesf∗−fC∗
y andf∗−fC∗v against reduced velocity in the initial, upper, and lower branches forζ=0%. Heref∗,fC∗
y, andfC∗
y are the frequency values of cylinder displacement, transverse fluid force, and vortex force coefficients, respectively. Each response branch is shaded in a different color.
Fig. 7. Time histories of transverse phaseΦ (left) and vortex phaseΦv(right) atU∗=4.2 (a) and 4.28 (b) inUB(I) forζ=0%.
instead of unbounded growth, Φv consists of time intervals, so calledepochs(Pikovsky et al.,2001), where the vortex phase is approximately constant. It can be observed that the time length of an epoch extends with the reduced velocity.
Two neighboring epochs are separated by so-calledphase slips, where the vortex phase shows rapid change (Pikovsky et al.,2001). Konstantinidis et al.(2020) identified similar tendencies (i.e. epochs separated by phase slips) in the time- dependent transverse phase close to the boundary between the upper and lower branches. In addition,Fig. 7a and b show
‘‘approximately constant’’Φvalues, which is expected because|f∗−fC∗
y| ∼=0 inUB(I) (Fig. 6). Note that in this context, the phrase ‘‘approximately constant’’ refers to that the phase difference varies around a constant value (in this case around zero).
Fig. 8shows the time histories of vortex phase wrapped between−π/2 and 3π/2 at different reduced velocity values corresponding to the initial branch (Fig. 8a) and the onset of proposed upper branch (UB(I), seeFig. 8b and c).Pikovsky et al.(2001) showed that the change ofΦvvia a phase slip (seeFig. 7) cannot be arbitrary, it is always the whole number multiples ofπ. This finding is confirmed inFig. 8b and c. It is also important to see that at an epochΦvvaries periodically around π (seeFig. 8a and b), andΦ represents an almost constant zero value (Fig. 7). For this reason, conditions for the existence of the upper branch (Φv =π andΦ=0) seem to be satisfied inUB(I). However, in-between two epochs (in phase slips) vortex phase deviates marginally fromπ, which causes discrepancies in its time-mean value. As shown before, time lengths of epochs increase withU∗, that is, deviation inΦvfrom its theoretically expected value (Φv=180◦) decreases with reduced velocity. Similar issues appear in the initial branch (seeFig. 8a), where the wrapped phase angle shows high spikes that influencesΦvsignificantly. In further time-averaged phase difference plots, non-synchronous cases – where unbounded changes or phase slips are identified – will be indicated by empty symbols.
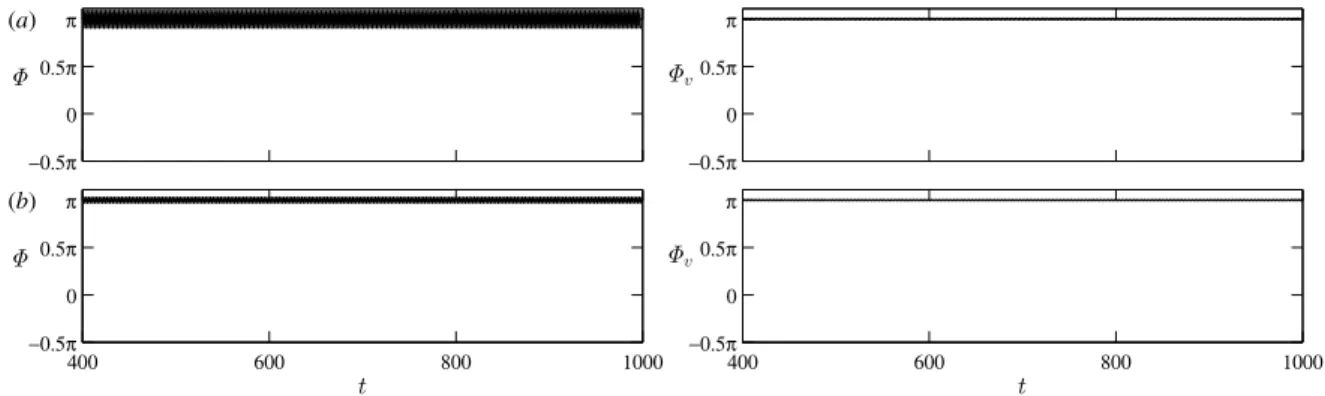
Fig. 9 shows the time histories of transverse and vortex phases in the remaining part of the upper branch. As can be seen inFig. 6, the frequencies of vortex force and transverse fluid force are equal to the vibration frequency of the cylinder between U∗ = 4.28 and 4.7. Consequently, ‘‘approximately constant’’ Φ and Φv values are expected in this
Fig. 8. Time-dependent vortex phase atU∗=4 (a): initial branch, 4.2 (b):UB(I), and 4.28 (c):UB(I) forζ=0%. Here, phase difference is wrapped in[−π/2;3π/2].
domain.Fig. 9a–c corroborate these expectations: neither unbounded change nor phase slips are identified inΦandΦv. It is also seen in these figures that the time-mean values ofΦv andΦ equal approximately to π and 0, respectively, which are consistent with the experimental results for the upper branch. This finding strengthens our previous evidence concerning the existence of the upper branch atRe=300.
It can also be observed inFig. 9a–c that the fluctuations in transverse and vortex phases are amplified whenU∗ is increased. As can be seen, inUB(II) (4.28 < U∗ ≤4.35), bothΦandΦv show small periodic oscillations (seeFig. 9a).
Varying the reduced velocity inUB(III) (fromU∗=4.36 to 4.48),Φoscillates randomly with very high rms values (Fig. 9b).
Random oscillations are also observed in the time history ofΦv, but its fluctuation is significantly lower. Shifting toUB(IV) (takes place in 4.48<U∗≤4.7), transverse and vortex phases return back to periodic, but the high fluctuations inΦare still observed (seeFig. 9c).
Finally, increasing the reduced velocity throughUB(V) (in the range ofU∗ = 4.7−4.89), we found that detuning f∗−fC∗
ydrops to approximately−0.2 (seeFig. 6), which causes an unbounded increase in the transverse phase (Fig. 9d). It is interesting to note that the absolute value of this detuning is close to the Strouhal number atRe=300, i.e.f∗−fC∗
y
∼= −St.
Besides, the vibration frequency is also close toSt inUB(V) (f∗ ∼= St, seeFig. 3b). Consequently, the detuning value of
−0.2 can only be achieved when the frequency of transverse fluid force, more precisely, the most dominant frequency component in the spectra ofCyis double the frequency of cylinder oscillation,fC∗
y
∼=f∗∼=2St. Moreover, the unreasonably high fluctuations inΦ in the UB(III) and UB(IV) subdomains appear to be caused by the occurrence of higher order harmonics in the spectra ofCy. These effects are further investigated in Section4.4.
Fig. 10shows ΦandΦvin the range of 4.89 < U∗ ≤5.9, the domain corresponding to the lower branch, because Φ∼=Φv∼=180◦(Govardhan and Williamson,2000;Soti et al.,2018). It can be seen that the rms values of transverse and vortex phases decrease with reduced velocity.
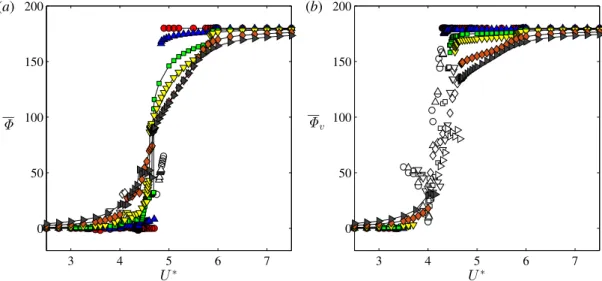
Fig. 11displays the time-mean values of transverse and vortex phasesΦandΦv, respectively, in degrees, where filled and empty symbols indicate synchronous and non-synchronous cases. Although phase differences show gradual variations between 0◦ and 180◦, the transitions inΦv andΦare observed in differentU∗ranges, which is the distinctive feature of three-branch response. However, experimental studies at high Reynolds numbers and low mass and damping values reported abrupt phase changes in the initial↔upper and upper↔lower branch transition domains. As discussed earlier, the reason behind the gradual and not abrupt variations inΦvandΦis the unbounded changes and phase slips found in the time-dependent transverse and vortex phases.
To conclude, the initial branch is observed in the range of 3.45<U∗≤4, the upper branch betweenU∗=4 and 4.89, and the lower branch in the domain of 4.89<U∗≤5.9. The most important observations related to the dynamics ofΦ andΦvat the different response branches are summarized inTable 4.
4.2. Analysis for non-zero damping ratios
In this study the effect of structural damping ratio is also investigated. We would like to learn more about the effect ofζ on the cylinder response, particularly on the occurrence of upper branch.Fig. 12a and b showy0′ andf/fN against reduced velocity for damping ratio values betweenζ =0% and 5%. It can be seen that the results obtained harmonize well with the expectations: the oscillation amplitude decreases with damping ratio (seeFig. 12a). It can also be clearly
Fig. 9. Time-varying phase differences Φ (left) andΦv (right) atU∗=4.35 (a):UB(II), 4.4 (b):UB(III), 4.65 (c):UB(IV), and 4.89 (d):UB(V) for ζ=0%.
Fig. 10. Time-dependent phase differencesΦ (left) andΦv(right) atU∗=4.9 (a) and 5.5 (b) in the lower branch forζ=0%.
Table 4
Summary of phase dynamics in the three response branches.
Branch Abbrev. U∗domain Φ Φv
– – [2.50,3.45] Low periodic osc. Low periodic osc.
Initial IB ]3.45,4.00] Intermediate osc. Unbounded decrease
Upper
UB(I) ]4.00,4.28] Low random osc. Phase slips UB(II) ]4.28,4.35] Low periodic osc. Low periodic osc.
UB(III) ]4.35,4.48] High random osc. Low random osc.
UB(IV) ]4.48,4.70] High periodic osc. Low periodic osc.
UB(V) ]4.70,4.89] Unbounded increase Low periodic osc.
Lower LB ]4.89,5.90] Low periodic osc. Low periodic osc.
observed that structural damping causes significant changes in the cylinder response. When the damping ratio is varied in the range ofζ=0−1%,y0′ andf/fN curves are very similar to each other; they form a three-branch response. As seen in the figure, the beginning of the initial branch (wherey0′ starts to increase intensively) and the beginning of the lower