Learning to import from your peers
Márta Bisztray
b,⁎ , Miklós Koren
a,b,c, Adam Szeidl
a,caCentral European University, Nádor u. 9. 1051, Budapest, Hungary
bCentre for Economic and Regional Studies of the Hungarian Academy of Sciences (MTA KRTK), Hungary
cCentre for Economic Policy Research, United Kingdom
a b s t r a c t a r t i c l e i n f o
Article history:
Received 21 June 2017
Received in revised form 28 September 2018 Accepted 28 September 2018
Available online 12 October 2018
Repository: zenodo https://zenodo.org/record/
1434685#.W6n0f3szapp
We usefirm-level data from Hungary to estimate knowledge spillovers in importing throughfine spatial and man- agerial networks. By identifying from variation in peers' import experience across source countries, by comparing the spillover from neighboring buildings with a cross-street placebo, and by exploiting plausibly exogenousfirm moves, we obtain credible estimates and establish three results. (1) There are significant knowledge spillovers in both spatial and managerial networks. Having a peer which has imported from a particular country more than doubles the probability of starting to import from that country, but the effect quickly decays with distance. (2) Spillovers are heterogeneous: they are stronger whenfirms or peers are larger or more productive, and exhibit complementarities infirm and peer productivity. (3) The model-implied social multiplier is highly skewed, imply- ing that targeting an import-encouragement policy tofirms with many and productive neighbors can make it 26%
more effective. These results highlight the benefit offirm clusters in facilitating the diffusion of business practices.
© 2018 The Author(s). Published by Elsevier B.V. This is an open access article under the CC BY license (http://
creativecommons.org/licenses/by/4.0/).
Keywords:
Imports Peer effects Spatial spillovers Manager networks Social multiplier JEL codes:
F14 R32 D22
1. Introduction
Imports have large positive effects onfirm productivity (Amiti and Konings, 2007;Halpern et al., 2015), yet there is much heterogeneity in similarfirms' importing behavior. One explanation for this heteroge- neity is the presence of informal trade barriers, when specific knowledge or a trusted partner is needed for a productive import relationship. When informal barriers are active, importing may diffuse fromfirm tofirm through personal and business connections. Mion and Opromolla (2014),Mion et al. (2016),Fernandes and Tang (2014)andKamal and Sundaram (2016)document such diffusion for exports, but at present we have limited evidence on the—equally important—import side of the market.1,2Are there knowledge spillovers in importing? If there are, what factors facilitate or limit diffusion? The answers can shed
light on the puzzling cross-firm heterogeneity in importing and its pro- ductivity benefits; and can guide trade policy to exploit indirect effects.
In this paper we usefirm-level data from Hungary to document and analyze knowledge diffusion in importing. In doing so, we make three main contributions. First, we develop a portfolio of empirical designs which rule out many alternative explanations and help advance the identification of trade spillovers in spatial and managerial networks.
We addressfirm heterogeneity by identifying from source country variation, exclude spatial omitted variables by exploiting the precise neighborhood structure, and also use plausibly exogenousfirm moves.
We consistentlyfind significant spillover effects. Second, we investigate the factors associated with stronger diffusion. Wefind that knowledge flows are stronger whenfirms or peers are larger or more productive.
Knowledgeflows also exhibit complementarities infirm and peer pro- ductivity, showing that positive sorting can increase the overall adop- tion of importing. Third, we demonstrate in a counterfactual analysis how network density and positive sorting combine to shape adoption patterns. We document that the model-implied social multiplier of importing is highly skewed in the number and type of peers, implying that import subsidies targeted atfirms in buildings with many produc- tive neighbors are much more effective.
InSection 2we present our data. We use afirm-level panel that con- tains rich information about Hungarianfirms during 1993–2003. We
⁎ Corresponding author.
E-mail addresses:bisztray.marta@krtk.mta.hu(M. Bisztray),korenm@ceu.edu (M. Koren),szeidla@ceu.edu(A. Szeidl).
1 We review the literature on knowledge spillovers in trade in detail below.
2 From the results on exports one cannot generalize to imports:finding a foreign sup- plier is probably easier thanfinding a foreign client, increasing the supply of, but decreas- ing the demand for, knowledge diffusion.
https://doi.org/10.1016/j.jinteco.2018.09.010
0022-1996/© 2018 The Author(s). Published by Elsevier B.V. This is an open access article under the CC BY license (http://creativecommons.org/licenses/by/4.0/).
Contents lists available atScienceDirect
Journal of International Economics
j o u r n a l h o m e p a g e :w w w . e l s e v i e r . c o m / l o c a t e / j i e
combine three data sources: the Hungarianfirm register, balance sheet data from the National Tax and Customs Administration, and trade data from the Hungarian Customs Statistics.3Thefirm register contains, for the full universe of Hungarianfirms, the precise address of thefirm, all owners with their country of origin, and allfirm officials with signing rights, as well as changes over time. As a result, we can trace changes in spatial and ownership links and the moves of people. The balance sheet data include additional information on the foreign ownership share and the industry offirms. And the customs data contain annual export and importflows at the HS6 product level for eachfirm, sepa- rately for each destination and source country.
Section 3presents ourfirst main contribution: the empirical strategy and results on import spillovers. The key identification concern with es- timating spillovers is one common to studies of peer effects (Manski, 1993): that afirm and its peer's import choices may be correlated for reasons unrelated to learning. For example,firms in a particular industry may make correlated location and import decisions. We address this endogeneity problem using two main research designs exploiting pro- gressively narrower sources of variation, in combination with placebo tests and sample definition choices that rule out several omitted variables.
Ourfirst research design is a linear probability model measuring the effect of peerfirms'country-specific experience on afirm's decision about starting to import from thesame country. We implement this de- sign by includingfirm-year and country-yearfixed effects, effectively exploiting variation within afirm in a given year: we ask if having a peer which has past experience with a given country increases the prob- ability of starting to import from that country, rather than from another country. To increase comparability we only look at four source countries similar in terms of imports: the Czech Republic, Slovakia, Romania, and Russia. And to ensure that allfirms are the same distance from the bor- der we only considerfirms located in Budapest.
We use this research design to estimate knowledge diffusion in two networks: close spatial neighborhoods and managerial networks. Within spatial neighborhoods we consider three types of peers:firms in the same building,firms in the two neighboring buildings, and, as a placebo,firms in the two closest cross-street buildings. In managerial networks, we de- fine peers asfirms from which an official with signing rights has moved to thefirm of interest. To limit confounding effects we always exclude own- ership-connectedfirms—defined as those which share an ultimate owner with thefirm of interest—from the spatial and managerial peer groups.
Ourfirst design yields significant positive import diffusion estimates in both networks. For neighborhood networks we document highly spa- tially localized spillovers. Having a same-building peer with import ex- perience from a specific country increases the probability of starting to import from the same country by 0.2 percentage points, which roughly doubles the baseline probability of starting to import from one of the four countries. The effect of a neighbor-building peer's import experi- ence is only one-fifth as large, indicating fast decay by distance.4The placebo effect of a cross-street peer's import experience is insignificant and small. Finally, in managerial networks the same design yields spill- over estimates which are twice as large as the same-building effect.
This design addresses several omitted variable problems which often plague estimates of knowledge diffusion. Most directly, by exploiting variation across source countries it addresses the basic con- cern that importers tend to be connected to other importers. Specifi- cally, in the absence of source country variation thefirm-yearfixed effects would soak up all the variation in peers' import experience.5In
addition, our controls and placebo also address more subtle country- specific omitted variables. In particular, by controlling for ownership links we remove omitted variables based on joint ownership. Results below show evidence on diffusion across industries, addressing con- cerns with same-industry clustering. And, most important, the neigh- boring building versus cross-street building comparison rules out any remaining omitted variable as long as knowledge spillovers decay faster than the spatial correlation in that variable.
One remaining concern with ourfirst design is that it does not make explicit the source of variation in peerfirms' experience, and therefore it may be subject to some unspecified—highly spatially concentrated— omitted variable. In our second design we address this problem by exploiting a concrete plausibly exogenous source of variation:firm moves. We conduct an event study of the impact offirms with coun- try-specific import experience moving into an address where no such experience was present earlier. The move is a positive shock to local country-specific knowledge. We show thatfirms located in such an ad- dress start to import from the country known by the mover with a higher probability than from other countries, relative tofirms in ad- dresses where the mover had no such experience. Consistent with the logic of diffusion, the response of imports to the move is gradual. The magnitude of the estimate is comparable to that of ourfirst research de- sign. The consistency of the results identified in different networks and from increasingly narrow sources of variation further supports the knowledge spillovers interpretation.
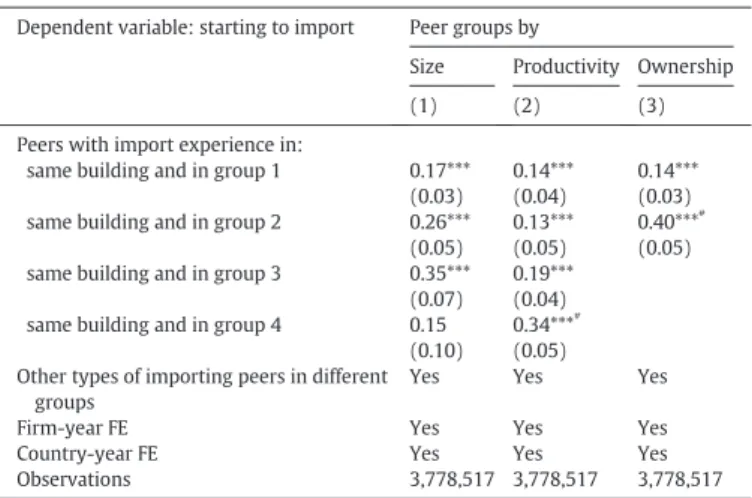
InSection 4we present our second main contribution: the heteroge- neity of the spillover effect. We explore heterogeneity both to internally validate our estimates and to obtain lessons about mechanisms. We measure heterogeneous effects both by the characteristics of thefirm and those of the peer, as well as their interactions. Focusing on same- building peers, wefind that larger, more productive and foreign- ownedfirms benefit more from peers' import experience. Firms also learn more from peers which are larger, more productive or foreign- owned. And spillovers are also stronger when more peers have import knowledge. These results are all consistent with the knowledge diffu- sion interpretation: betterfirms are likely to be both more receptive to information and more effective in passing it on, and multiple sources should further increase the rate of diffusion.6
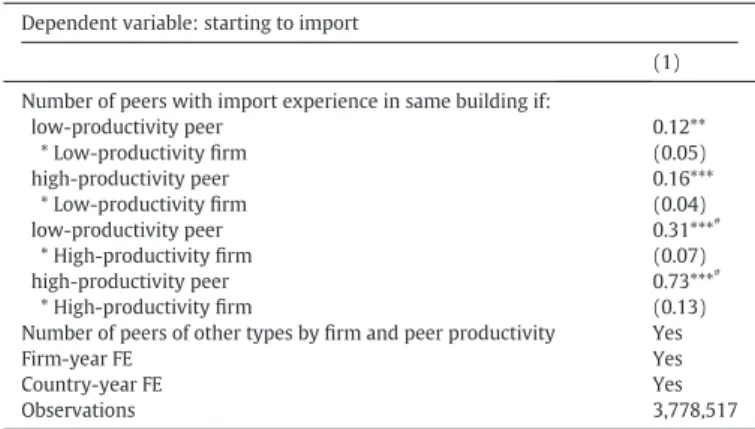
We then document that the strength of the spillover also exhibits complementaritiesbetween thefirm's and the peer's characteristics.
We show that high-productivityfirms tend to learn even more from higher-productivity peers than low-productivityfirms do. Similarly, we show that the effect of peers operating in the same industry or importing the same product category is significantly larger than that of other peers. At the same time, spillovers from peers operating in dif- ferent industries or importing different product types are still signifi- cant. The results on complementarities are potentially relevant because they suggest that positive sorting—even holdingfixed the net- work structure—can generate aggregate gains in importing.
InSection 5we present our third main contribution: a counterfactual analysis to assess the policy implications of the estimated import spill- over effect. Our results so far imply that spillovers should be stronger when (i) the number, and (ii) the productivity of experienced peers is higher. To quantitatively evaluate the combined impact of these forces, we compute the model-implied social multiplier effect on imports of a firm entering into an import market, which incorporates spillovers over the nextfive years. We calculate the multiplier using the same- building estimate which accounts for heterogeneity by the productivity of thefirm and its peers, and also allows for an increase in spillovers with the number of experienced peers. Because the number and produc- tivity of peers varies across the sample, we obtain a separate multiplier for eachfirm which has not imported yet from one of the four countries.
3Whilefirm register and balance sheet data cover a longer period, we do not have ac- cess to detailed trade data after 2003.
4We also estimate a decay coefficient andfind it to be similar to but somewhat higher than existing within-city spillover decay estimates. This confirms the pattern in the liter- ature that knowledge spillovers are spatially concentrated and suggests that building boundaries may be particularly important barriers in our context.
5Mion et al. (2016)also usefirm-yearfixed effects in their study of theexportexperi- ence of managers moving acrossfirms.
6The effects are broadly similar but weaker for neighbor-building and managerial connections.
The results show substantial skewness in the social multiplier. In par- ticular, wefind that thefive-year social multiplier is 1.03 for the median firm and 1.13 for thefirm in the 90th percentile. Thus, while accounting for spillovers is not important for the typicalfirm, it is potentially quite important for a substantial share offirms. An implication is that there may be significant gains from targeting trade policies. We confirm this by showing that a targeted import subsidy policy treatingfirms for which spillover effects are the largest can be 26% more effective than a non-targeted one. Becausefinding thefirms with the highest expected in- direct treatment effect only requires public information onfirms' balance sheet and address, this targeting is in principle directly implementable.
Our result quantifies the benefit of clusters—especially offirms with high productivity—in facilitating the diffusion of good business practices.
1.1. Literature
We build on a literature on knowledge spillovers in trade, most of which studies the diffusion of exporting. An important part of the liter- ature explores spatial spillovers. Early work focused on the diffusion of the decision to export, and obtained mixed results.7More recent work studies the diffusion of specific knowledge, such as export experience with a particular country or product, and generallyfinds evidence for spillovers (Koenig, 2009;Koenig et al., 2010;Poncet and Mayneris, 2013;Castillo and Silvente, 2011;Ramos and Moral-Benito, 2013;
Mayneris and Poncet, 2015). Using uniquely rich data on trade partners Kamal and Sundaram (2016)document the diffusion of concrete export partners. AndFernandes and Tang (2014)document export spillovers using for guidance a formal model that allows them to test specific pre- dictions of the learning hypothesis.
All these papers define spatial neighborhoods to be cities or similarly large agglomerations. Our spatial spillover results improve identifica- tion by using substantially more precise measures of neighborhoods.
When networking benefits decay rapidly in space (Arzaghi and Henderson, 2008), spatial networks should be measured at afine reso- lution to avoid confounding variation from omitted spatially correlated variables. Our results show that spillovers do decay fast, highlighting the relevance of our precise measures. More broadly, we also contribute to this literature by our focus on imports, our analysis of heterogeneous ef- fects and the implications for targeted trade policies.
Another part of the export spillovers literature studies spillovers through managerial moves. These papers show that having a manager with prior export experience join thefirm increases the likelihood that thefirm starts to export (Choquette and Meinen, 2015;Mion and Opromolla, 2014;Mion et al., 2016;Sala and Yalcin, 2015;Masso et al., 2015). We contribute to this work by focusing on import spillovers;
by having a comprehensive study in which we compare spillovers in managerial networks to spillovers in spatial networks; and by our anal- ysis of heterogeneous effects and the implications for targeted policies.
Given this existing work on export spillovers, our main focus in this paper is the more novel and equally important topic of import spill- overs. There is almost no work on this topic, the sole exceptions—to our knowledge—being Harasztosi (2011) and Harasztosi (2013), which estimate import spillovers in Hungarian NUTS4 agglomeration units. Our contribution to this work is the use of more precise neighbor- hood definitions, a variety of empirical designs that limit confounding factors, a more comprehensive analysis of multiple networks, the results on heterogeneous effects, and the policy counterfactual analysis.
Finally, we build on a literature onfirm networks and diffusion in networks.Chaney (2014)develops a model in whichfirms can acquire trading partners through existing contacts;Fafchamps and Quinn (2015)andCai and Szeidl (2018)show that managerial meetings can facilitate the diffusion of business relevant information; andBanerjee
et al. (2013)explore network-based targeting of microfinance in the presence of knowledge diffusion. Our study documents and analyzes these sort of network effects in the novel and important context of im- port spillovers.
2. Data
2.1. Data sources
We create our panel of Hungarian importers by combining data from three sources.
2.1.1. Firm registry 1993–2003
Data from the Hungarian Company Register contain basic informa- tion for the full universe of Hungarianfirms, including thefirm's name, tax identifier, and precise address: zip code, city, street, number,floor and door number. These variables have associated start and end dates, allowing us to trackfirm moves over time. The registry data also contain information about thefirm's owners, and officials with signing rights which include directors, board members, the CEO, and some employees.
As the employees with signing rights are usually at or near the top of the firm hierarchy, we sometimes—slightly imprecisely—refer to these peo- ple as managers. Forfirm owners the data contain the name and registry number; and for person owners and officials the name, mother's name and home address. These records also have start and end dates. We use the name, mother's name and address to create an anonymous unique identifier for each individual in the data. We use this identifier to track individuals acrossfirms and over time. Our method allows for typos and slight variations in names, such as omitting the middle name.
2.1.2. Balance sheets 1993–2003
We have balance sheet data for all double-bookkeeping Hungarian firms from the National Tax and Customs Administration of Hungary.
These data also include thefirm's industry at the 2-digitNACE level (Re- vision 1.1), and the shares of its capital owned by foreign entities, do- mestic private entities, and the Hungarian state.
2.1.3. International trade 1993–2003
Detailedfirm-level trade data come from the Hungarian Customs Statistics. These data contain yearly exports and imports by eachfirm to and from each foreign country at the Harmonized System (HS) 6-digit product category. The reason that our sample period ends in 2003 is that thefirm-level trade data are not available for later years.
We use uniquefirm identifiers to link these three datasets.
2.2. Main sample and variable definitions 2.2.1. Firm sample
We focus on imports from four countries that are comparable in terms of their exports to Hungarianfirms: the Czech Republic, Slovakia, Romania and Russia. To avoid variation in distance from the border, we use onlyfirms with headquarters in Budapest, which account for over 20% of all thefirms in Hungary. Accordingly, when afirm moves its headquarters out of Budapest, we let it exit from our sample. These ex- clusions result in ourmainfirm samplewhich contains 211,598firms and 1,189,402firm-year observations.
We conduct most of the analysis using ouranalysis sample, a (firm, source country, year) panel derived from our mainfirm sample. In this three-way panel we only include observations in which afirm in the main sample has not yet imported from the given source country up until the previous year. This sample construction allows us to estimate the probability that afirmstartsto import from a particular country for thefirst time. We also make three additional exclusions. (1) We ex- cludefirms for which the headquarters' address is missing, because for them we cannot define spatial networks. (2) We excludefirms which haveN50 same-building peers to ensure that our results are not driven
7 For example,Aitken et al. (1997),Barrios et al. (2003),Bernard and Jensen (2004), Lawless (2009)andPupato (2010)found negative results, whileClerides et al. (1998), Lovely et al. (2005),Greenaway and Kneller (2008)andDumont et al. (2010)found pos- itive effects.
by large hubs. (3) We start the data in 1994 because separate trade data for the Czech Republic and Slovakia are only available starting 1993 and the analysis sample requires importer status of peers in the previous year.8,9After these exclusions, the analysis sample contains 88% of the firms in the mainfirm sample and has 3,778,517firm-year-country observations. About 5% of thefirms in the main sample import from at least one of the four countries at least in one year during 1993–2003.
2.2.2. Variable definitions
We define thefirm to have import experience with a country in a year if it has imported from that country in that year or in a previous year. This definition captures the idea that thefirm has acquired import experience specific to that country by that year. We define experience with exports or with foreign owners in an analogous way. We classify afirm as foreign-owned in a year if it had majority foreign ownership that year.
We classify imported products by their purpose using the Broad Eco- nomic Categories (BEC) classification. We create four product catego- ries: Consumer goods (BEC 1, 6), Industrial supplies (BEC 2, 3), Capital goods (BEC 41, 51, 52) and Parts and accessories (BEC 42, 53).
Using theLevinsohn and Petrin (2003)methodology we estimate from the balance sheet data total factor productivity (TFP) for each firm in each year, assuming a Cobb-Douglas revenue production function with capital and labor as factors and materials as an input, allowing coef- ficients to vary by two-digit industries. We normalize log productivity within each 2-digit industry to have mean zero in our mainfirm sample.
We then assignfirms to productivity quartiles in each yeart, based on the average of their yearly 2-digit-industry-specific productivity percentile over the yearst−2,t−1andt. Taking the average over three years re- duces noise, and results in a smooth but time-varying productivity index.
2.3. Firm networks
A key ingredient in our analysis is data on peers infirm networks.
We work with three classes of peers, defined based on spatial, personal and ownership connections.
2.3.1. Spatial peers
We use a highly localized definition of spatial connections. We create three different spatial peer groups. (i) Same-building peers, defined as firms with the same street address up to building number. (ii) Neigh- bor-building peers, defined for afirm with building numbernasfirms in buildings in the same street with numbersn−2 andn+ 2.10(iii) Cross-street peers, defined asfirms in buildings in the same street num- beredn−1 andn+ 1. From all three peer groups we excludefirms which have an ownership link—as defined below—to thefirm of interest in the given year. Because the address data has dates, all these peer groups are year specific.
2.3.2. Person-connected peers
We define afirmBto be a person-connected peer offirmAin yeartif some personXis an official with signing rights offirmAin yeartand was an official with signing rights offirmBat some earlier date. We will often focus on person connections that can transmit import experi- ence with some countryc, which happens whenfirmBhad import experience withcbefore personXleft thatfirm.
In all person-connected definitions we exclude people with signing rights who are liquidators—officials assigned to handle liquidation of the company—as well as people who are officials or owners ofN15 firms in the given year. We also exclude from the set of person-con- nected peersfirms which are likely to have shared decision makers with thefirm of interest: those ever connected to thefirm through own- ership links (as defined below), and those that have the exact same ad- dress includingfloor and door number. But we do include peerfirms which are located outside Budapest.
With slight imprecision, we sometimes refer to the person-con- nected network defined this way as the managerial network.
2.3.3. Ownership-connected peers
We classifyfirmsAandBto be linked by ownership in yeartif they have a common ultimate owner. This includes two types of connections:
(1) whenAandBhave a direct or indirect common owner; (2) when one of thefirms is a direct or indirect owner of the other. We also in- clude peers located outside Budapest in the ownership-connected peer group of afirm.
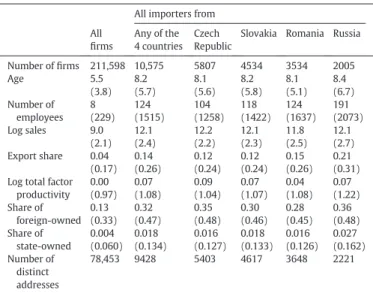
2.4. Summary statistics
Table 1presents descriptive statistics on thefirms in our main sam- ple. Thefirst column refers to allfirms in all years, the second column to firms in years in which they have already had import experience from one of our four source countries, and the remaining columns tofirms with import experience from specific countries.
Comparing between columns 1 and 2 shows that importers are on average older, larger, more likely to be foreign owned, more likely to ex- port, and have higher productivity than the industry average. These pat- terns are familiar (Bernard et al., 2009). The remaining columns show that importers from the four countries of interest are fairly similar in terms of all the variables in the table, consistent with our intuition that these source countries are roughly similar in terms of their associ- ated import barriers.
Table 2shows the number offirms and importers over time during our sample period. The rapid increase in the number offirms is likely due to the development of the capitalist economy in the 1990s. And the increase in the number of importers is probably a consequence of several factors: morefirms, lower formal trade barriers, and a country more deeply embedded in the international economy. The considerable Table 1
Descriptive statistics.
All importers from All
firms
Any of the 4 countries
Czech Republic
Slovakia Romania Russia
Number offirms 211,598 10,575 5807 4534 3534 2005
Age 5.5 8.2 8.1 8.2 8.1 8.4
(3.8) (5.7) (5.6) (5.8) (5.1) (6.7)
Number of employees
8 124 104 118 124 191
(229) (1515) (1258) (1422) (1637) (2073)
Log sales 9.0 12.1 12.2 12.1 11.8 12.1
(2.1) (2.4) (2.2) (2.3) (2.5) (2.7)
Export share 0.04 0.14 0.12 0.12 0.15 0.21
(0.17) (0.26) (0.24) (0.24) (0.26) (0.31) Log total factor
productivity
0.00 0.07 0.09 0.07 0.04 0.07
(0.97) (1.08) (1.04) (1.07) (1.08) (1.22) Share of
foreign-owned
0.13 0.32 0.35 0.30 0.28 0.36
(0.33) (0.47) (0.48) (0.46) (0.45) (0.48) Share of
state-owned
0.004 0.018 0.016 0.018 0.016 0.027
(0.060) (0.134) (0.127) (0.133) (0.126) (0.162) Number of
distinct addresses
78,453 9428 5403 4617 3648 2221
Notes: Sample includesfirms with headquarters in Budapest, 1993–2003. We report log total factor productivity as the difference from the 2-digit industry average in Budapest.
Standard deviations are in parentheses below the sample averages.
8For the same reason we cannot includefirms in thefirst year they appear in the data.
We also exclude those observations—1550firm-year pairs—in which thefirm has no ad- dress data from the previous year and no spatial peers coming from the previous year can be defined.
9As we have no data onfirms' import history before 1992/1993, we cannot rule out that firms classified as not yet importers already imported from the country before 1992. In a robustness check we use the more recent part of our analysis sample, 1998–2003, in which we can rule out that not-yet-importerfirms have a recent unobserved import experience with the country.
10Streets in Budapest have an even and an odd side.
increase in importing shown in the table is a key source of variation for our analysis below.
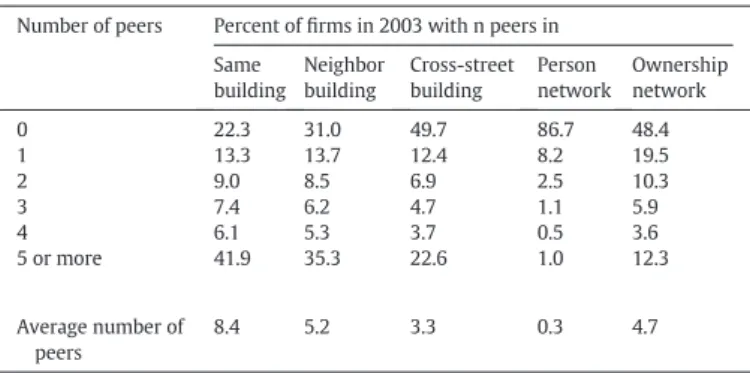
Table 3reports the distribution of degree (number of peers) in the differentfirm networks. The average degree—shown in the bottom row—is the highest for the same-building network (8.4) and the lowest for the the person-connected network (0.3). The neighbor-building and cross-street networks are between these two extremes (average degrees of 5.2 and 3.3) and although the latter is more sparse, have a roughly similar degree distribution. In all networks a substantial share offirms are isolated, i.e. have zero neighbors. This heterogeneity in degree acrossfirms is one key reason for our finding below that targeting import subsidy policies can substantially increase their effectiveness.11
3. Estimating import spillovers
This section presents our empirical strategy and results on the effect of peers' experience on afirm's import decision. Our main hypothesis is that importing requires source-country specific knowledge, which in turn diffuses in variousfirm networks. As a result, we predict that firms which—other things equal—have peers with experience importing from a particular country are more likely to start importing from that country.
We divide this section into four parts. We begin by presenting moti- vating evidence which highlights a key component of the logic for iden- tification: variation in peers' import experience across different source countries. We then present two empirical designs. Thefirst design di- rectly exploits this source country variation, and yields spillover esti- mates in both spatial and managerial networks as well as placebo estimates that confirm the logic of identification. The second design fur- ther improves identification for spillovers in spatial networks by exploiting plausibly exogenousfirm moves. In thefinal part we assess the magnitude of our spillover estimates.
3.1. Motivating evidence
Table 4shows how we exploit source country variation in peers' im- port experience. The table reports the probability of afirm starting to import from a particular country in a year, conditional on it starting to import from one of the four countries that year, and conditional on
different importing patterns of its peers. The four panels correspond to peers defined by the same-building, neighbor-building, person-con- nected and ownership-connected networks. Within each panel, the top row shows the share offirms which start to import from a country c, while the bottom row shows the share which start to import from a different country.12The left column computes this share forfirms with peers that have import experience withcbut not the other countries;
and the right column forfirms with peers that have import experience with a different country but notc. We report the average share when cruns across the four countries, weighted by the number of observa- tions per country.
The table shows that in each network, the share offirms starting to import from countrycis always higher when peers havecexperience than when peers have non-cexperience. This fact suggests that peers' experience influencesfirms' import decisions and forms the basis for our identification strategy. We now turn to more fully develop this em- pirical approach and derive statistical inference, explicitly address con- founds, conduct placebo analysis and incorporate additional plausibly exogenous variation.
Table 2
Number offirms and importers by year.
Year Number offirms Importing from Total Any of the 4
countries
Czech Republic
Slovakia Romania Russia
1993 50,982 1810 753 758 563 509
1994 63,592 2702 1175 1225 754 675
1995 74,516 3514 1642 1599 956 822
1996 86,702 4197 2029 1905 1127 937
1997 99,858 4885 2489 2185 1381 1025
1998 113,366 5530 2916 2410 1631 1137
1999 122,407 6064 3304 2588 1786 1231
2000 133,031 6578 3683 2784 2018 1292
2001 142,433 6989 3948 2955 2211 1338
2002 148,574 7305 4207 3095 2382 1365
2003 153,941 7696 4506 3311 2620 1386
Notes: Sample includesfirms with headquarters in Budapest, 1993–2003. Afirm is defined to be importing from a country if it has imported at least once from that country by the given year.
Table 3
Number of peers in various networks.
Number of peers Percent offirms in 2003 with n peers in Same
building Neighbor building
Cross-street building
Person network
Ownership network
0 22.3 31.0 49.7 86.7 48.4
1 13.3 13.7 12.4 8.2 19.5
2 9.0 8.5 6.9 2.5 10.3
3 7.4 6.2 4.7 1.1 5.9
4 6.1 5.3 3.7 0.5 3.6
5 or more 41.9 35.3 22.6 1.0 12.3
Average number of peers
8.4 5.2 3.3 0.3 4.7
Notes: Same building is the building of thefirm (street number denotedn). Neighbor building: buildings in the same street with numbersn+ 2 andn−2. Cross-street build- ing: buildings in the same street with numbersn+ 1 andn−1. Person network:firms in which a current manager of thefirm previously had signing right. Ownership network:
firms having a common ultimate owner with thefirm.
Table 4
Share of importers with experienced peers.
Firm has peers with import experience Share offirms starting to import Only from country C From any other country Peers in same building
Only from country C 44% 18%
From any other country 48% 78%
Peers in neighbor building
Only from country C 34% 21%
From any other country 61% 75%
Peers in person network
Only from country C 45% 18%
From any other country 44% 76%
Peers in ownership network
Only from country C 55% 14%
From any other country 41% 82%
Notes: Each value in each panel is the share offirms specified by the row of the panel rel- ative to the sample offirms specified by the column of the panel. Weighted average across the four countries, with the number of observations in a country as weights. Sample con- tainsfirms starting to import from at least one of the four countries. Percentages in a col- umn do not add up to 100% as we excludefirms which start to import both from country C and from another country.
11Section O1 of the Online Appendix contains additional descriptive statistics about net- works and imports. Figures O1-O3 and Table O1 show that importers are fairly similar across source countries. Table O2 shows that the majority of importers imports only from one of the four countries. Table O3 shows that patterns of experienced peers have wide variation acrossfirms.
12 Percentages do not add to 100 as we excludefirms which start to import from bothc and another country.
3.2. Research design 1: Peers'country-specific import experience
Our main specification is the following linear hazard regression equation:
Yict¼X
n
βnXnic;t−1þαitþμctþεict: ð1Þ
Hereiindexesfirms,cindexes source countries andtindexes years, thus each observation is a (firm, source country, year) triplet. We esti- mate the regression in our analysis sample, which contains observations wherefirmihasnot yet imported from country cbefore yeart. The left- hand-side variableYictis an indicator foriimporting from countrycin yeart. Given that the sample excludes prior importers fromc,Yictmea- sures entry into importing fromc. On the right-hand side we include in- dicators for the presence of country-specific import experience in various peer groupsn. Specifically,Xnic,t−1is and indicator which equals one if there is at least onefirm infirmi‘s peer groupnin yeart−1 which has import experience from countrycat timet−1, that is, which imported fromcint−1 or earlier.13We use lagged peer experi- ence because we expect information diffusion to take time. We consider thefive different peer groups (n) defined inSection 2.3above: (1)firms in the same building; (2)firms in the two neighboring buildings, (3) firms in the two cross-street buildings; (4) person-connected peers;
and (5)firms in the same ownership network. Finally,αitdenotes firm-yearfixed effects,μctdenotes country-yearfixed effects, andεict
represents other sources of variation in importing.
Our main hypothesis is that, due to knowledge spillovers,βnN0 for the spatial and managerial networks. We also expectβnN0 for the own- ership network, but in that network the mechanism need not be a spill- over: it is also possible that the common owner's knowledge causes firms in the network to import from the same country.
Because they play an important role in identifying our key coeffi- cients, it is useful to discuss thefixed effects in Eq.(1). Thefirm- yearfixed effectsαitcontrol for any omitted variable driving import behavior which is specific to the givenfirm in the given year. This is a rich set offixed effects, and the only reason it can be included is be- cause the data have an additional panel dimension: multiple source countries. In particular, estimating Eq.(1)in the absence of data on source countries, or with a single source country, would not be feasi- ble because thefirm-yearfixed effects would soak up all the variation in the dependent variable. In this sense the keyβncoefficients are identified from source country variation. An implication is that stan- dardfirm controls, such as sales, employment, ownership status, or other balance sheet variables need not be included in the regression, since they are already picked up by thefirm-year effects. In turn, the second set offixed effectsμctpick up country-year specific variation, for example business cycle fluctuations in a source country that might affect the supply of imports. Due to their presence, we do not need to include country-specific controls such as the exchange rate or GDP of the source country.
Beyond import spillovers, slightly modified versions of Eq.(1)can also be used to estimate other kinds of spillovers. We will look at cross-activity spillovers where on the right-hand side of the equation we measure peerfirms'country-specific experience in a different do- main, such as exporting to or having a foreign owner from the country;
and (in Appendix A.2) we will also use a variant to present evidence on export spillovers.
3.2.1. Identification
Since Eq. (1)is essentially a peer effects regression, the main threats to identification are those highlighted by Manski (1993):
endogenous peer groups and correlated omitted variables.14Endoge- nous peer groups might arise because of clustering or because of peer choice. An example in the spatial network is whenfirms from one industry, or “high-type” firms, tend to both co-locate and make similar import decisions, creating spurious correlation between Xnic,t−1andεict. An example in the managerial network is when a firm hires a manager because of her or his import knowledge. And an example of correlated omitted variables is when particular physical locations are better for importing from a countryc, perhaps because they are close toc.
Our first research design addresses these concerns in three main ways. (1) Source-country variation. By using this variation we address the basic concern that importers tend to be connected to other importers. As discussed above, if we were to estimate Eq.
(1)ignoring the source of imports, thefirm-yearfixed effectsαit
would soak up all the variation. The implication is that remaining threats to identification must be based on country variation: for example, if certain types of firms tend to import from certain countries and co-locate with each other. (2) Sample definition.
We use comparable source countries;firms based in Budapest;
and we omit ownership-based links from the spatial and manage- rial networks. Our sample choices mitigate several concerns.
Because the source countries are similar, it is less likely that
“high-type”firms import from one, while“low-type”firms import from another. Because allfirms are in Budapest, omitted variables based on distance from a country are muted. And by removing ownership links we address the concern that correlated decisions may be driven by a common owner. In addition, by focusing on imports we limit the concern of endogenous manager choice as knowledge of importing seems less likely to be a driver of hires than for example knowledge of exporting would be. (3) Placebo spatial peers. Perhaps the most convincing component of our de- sign is that by exploiting thefine spatial structure we can compare same-building and neighbor-building spillovers with a cross- street“placebo spillover”. As long as spillovers are more spatially concentrated than the omitted variables—an assumption consis- tent with the results ofArzaghi and Henderson (2008)—estimat- ing higherβcoefficients for the closer spatial peers is evidence for knowledge diffusion.
For the above reasons we feel that the most plausible confounds are accounted for by our current research design. Still, a possible concern is that, because the design does not make explicit the source of variation in peerfirms' experience, it may be subject to some remaining—highly spatially concentrated—omitted variable. In the next subsection we ad- dress this concern by combining the current design with plausibly exog- enous variation in peerfirms' experience due tofirm moves. Although that approach requires weaker identification assumptions, it can only be used to estimate spillovers in spatial networks. We therefore begin the analysis with the current design to demonstrate that knowledge spillovers about imports are present quite broadly across different types of networks.
3.2.2. Results
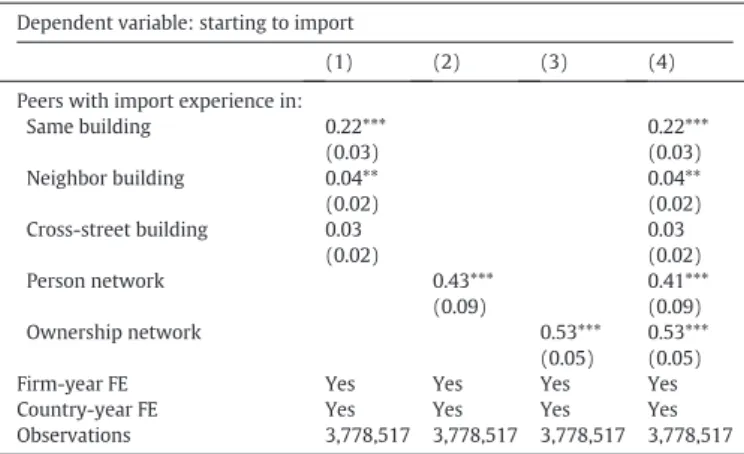
Table 5reports estimates ofregression (1). In this and all subsequent tables reporting regression results, coefficients are measured in per- centage points. To account for spatial correlation in the error term, in all specifications we cluster standard errors by building.
Column 1 focuses on spatial spillovers. The estimated effect of hav- ing a same-building peer with country-specific import experience is a significant 0.22. Intuitively, having a peer with experience importing from a particular country, e.g., Slovakia, increases the probability that thefirm starts to import from that country by 0.22 percentage points.
For comparison, the baseline probability that afirm starts to import
13Subsequent specifications will reuse the notation for variablesY,X, and coefficientβ with slightly different meaning. To minimize the risk of confusion, we will explain the no- tation of each estimating equation directly after it is introduced.
14The reflection problem is less relevant for us because we focus on the effect of peers'pastimport experience on thefirm's import decision.
from a specific country is 0.19%; thus having a peer with experience importing from a country more than doubles the probability of entering that import market. Column 1 also reports that the estimated effect of having a peer with country-specific import experience in a neighboring building is a significant 0.04. This is afifth as large as the same-building effect, and shows that while spillovers to neighboring buildings are also present, their intensity declines rapidly with distance. The cross-street spillover effect is an even smaller and insignificant 0.03. This result lends support to our identification strategy: if a spatially correlated omitted variable was driving our estimates, we would expect that vari- able to also affectfirms in buildings across the street. Taken together, these estimates strongly support the presence of spatial spillovers in importing.
Column 2 reports the analogous estimate for the person-connected networks. Having afirm official who had prior experience importing from a country increases the probability of importing by a significant 0.43, or almost half a percentage point. This estimate is twice as large as the same-building spillover effect. The larger magnitude seems intuitive: same-building diffusion is likely to be more limited because interactions between members of differentfirms are probably less common and less intense. In contrast, for person-connected spillovers, interactions are almost guaranteed since the manager now works for thefirm.
Column 3 shows the analogous estimates in the ownership-con- nected network. Here we estimate an even larger coefficient of 0.53. Importantly, this coefficient cannot be interpreted as a knowl- edge spillover because it is likely partly driven by a common owner making sequential import decisions for her or hisfirms. Indeed, the reason we include this specification is to show that controlling for the common ownership channel—which we do by excluding own- ership-connectedfirms from the other networks—is important to convincingly document knowledge spillovers in spatial and mana- gerial networks.
Column 4 shows that combining all three types of networks in the same specification leaves the estimates essentially unchanged, indicat- ing that the different networks represent genuinely different spillovers.
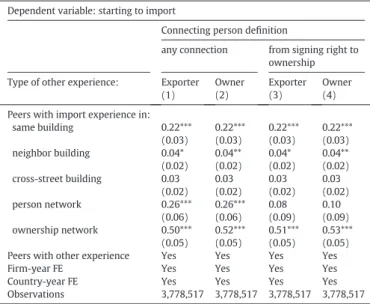
We conclude that there are significant import spillovers in both spatial and managerial networks. In Appendix A.1 we show that these results are also robust to a range of specification changes including various sub- samples (Table A1, A3), additional controls for the firms' or its peers'country-specific experiences (Table A1) and different measures of connections (Table A2).
3.3. Research design 2: peer moves
In our second research design we exploit a specific, plausibly exoge- nous source of variation in peer knowledge, which is created byfirm moves. Focusing on the same-building spillover, we explore the effect of a peer with particular import experience moving into the building on afirm's subsequent import decision. This design has power because moves are quite frequent, withN25% of thefirms in our main sample moving at least once.15As it is unlikely that the mover would internalize the effect of its import experience on otherfirms in the building when it chooses its location, we can plausibly assume that country-specific ex- perience brought by the mover is an exogenous shock for the local firms. Similarly, although the owner of the building might want to at- tract goodfirms, it is less plausible that she would want to attract firms with specific import experience.
We estimate the impact of moves using an event study, in which the event is when afirm moves from another address into a building. The sample consists of (i,c,t), that is, (firm, source country, year) observa- tions wherefirmiis located in a building in some yeartwhich is subse- quent to some otherfirmjmoving in the same building. The event is the earliest date at which anotherfirm moves into the building ofi. To limit the confounding effects of preexisting neighbors, we restrict the sample to observations in which no incumbentfirm in the building had import experience with the countrycprior to the event. We do not require that the moverfirmjhas import experience with the countryc. Buildings with movers having no import experience serve as controls.
Using this sample, we estimate the following regression equation:
Yict¼X5
τ¼1
βτDτitXicþX5
τ¼1
γτDτitþαitþμctþεict: ð2Þ
HereYictis an indicator forfirmihaving imported from countrycin some year up to and includingt.Ditτis an event-year indicator which equals one if the moverfirm came to the building ofiexactlyτyears be- foret; and theτ= 5 category also includes those observations in which the move occurredN5 years ago.Xicis an indicator for the moverfirm having had import experience with countrycby the time of the move.
As before,αitandμctdenotefirm-year and country-yearfixed effects andεictdenotes the error term.
In this specification the coefficientsγτmeasure the baseline dynam- ics of importing from a countrycfollowing a move by anyfirm. The co- efficients of interest are theβτwhich measure the additional gains in importing when the mover had prior experience with countryc. Be- cause of thefirm-yearfixed effects, similarly to the previous research design this regression is also identified from variation across source countries. BecauseYictindicates if thefirm has ever imported fromc byt, and because the sample definition ensures that theihas not imported fromcbefore the mover's arrival,Yicteffectively measures if afirm with no prior import experience starts to import fromcin the pe- riod between the arrival of the mover andt. Thusβτcaptures the prob- ability that thefirm learns how to import by yearτ, even if thatfirm does not import in every subsequent year.
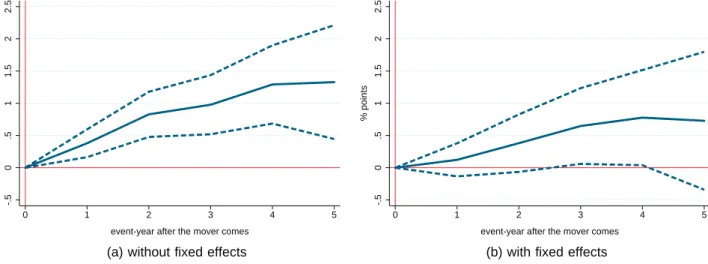
Fig. 1presents visual evidence from the event study by plotting the estimates ofβτtogether with their 95% confidence intervals. Panel (a) shows the results from the specification withoutfixed effects, while Panel (b) from one that includes the full set offixed effects. Although the point estimates in the second specification are somewhat lower and the standard errors wider because of the large increase in the num- ber of controls, both specifications show the same basic pattern: a grad- ual and eventually significant increase in the probability of importing from a country subsequent to a new neighbor with country-specific im- port experience moving in. The fact that the increase is gradual is consis- tent with the idea of knowledge diffusion.
Table 5
Effect of peer experience on same-country imports.
Dependent variable: starting to import
(1) (2) (3) (4)
Peers with import experience in:
Same building 0.22*** 0.22***
(0.03) (0.03)
Neighbor building 0.04** 0.04**
(0.02) (0.02)
Cross-street building 0.03 0.03
(0.02) (0.02)
Person network 0.43*** 0.41***
(0.09) (0.09)
Ownership network 0.53*** 0.53***
(0.05) (0.05)
Firm-year FE Yes Yes Yes Yes
Country-year FE Yes Yes Yes Yes
Observations 3,778,517 3,778,517 3,778,517 3,778,517
Notes: Sample includesfirm-country pairs in years in which thefirm has not imported from the country by the previous year. Dependent variable is an indicator for thefirm starting to import from the country in the given year. Right-hand side variables are indica- tors for specific types of peers with prior country-specific import experience. Standard er- rors in parentheses are clustered by building. Coefficients are multiplied by 100 to read as percentage point marginal effects. Significance levels: ***pb0.01, **pb0.05, *pb0.1.
15 We present descriptive statistics on moves inTable A4of Appendix A.2.
In the more conservativefixed effect specification of Panel (b), the insignificantfirst-year effect of 0.12 percentage points increases to a sig- nificant 0.78 percentage points after four years.16These estimates have the same order of magnitude as the estimated same-building effect of 0.22 percentage points in research design 1, but highlight the impor- tance of explicitly considering the dynamic response to moves. The pat- tern revealed here serves as one motivation for examining the dynamic response of further import entries to a new entry in the counterfactual analysis ofSection 5below, where we will also be able to compare ex- plicitly the dynamics implied by research designs 1 and 2.
In summary, our research designs 1 and 2, exploiting different sources of variation, different networks, as well as a placebo design, con- sistently yield evidence in support of the presence and economic rele- vance of the knowledge diffusion hypothesis. We conclude that knowledge spillovers in spatial and managerial networks play an im- portant role in shapingfirms' import decisions.
3.4. Benchmarking magnitudes
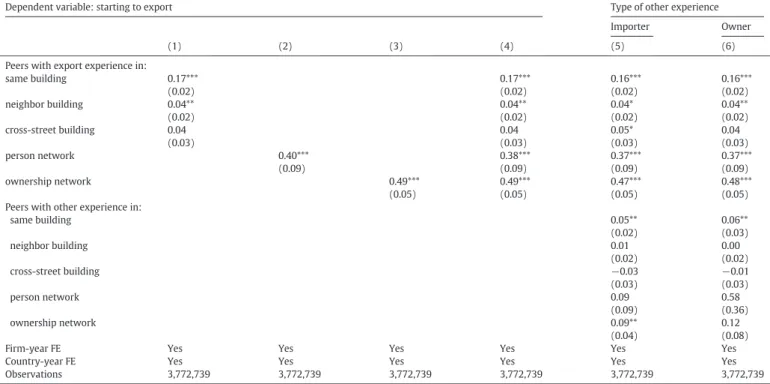
To get a better sense of the magnitude of the spillover effect here we compare it to three sets of benchmarks. As ourfirst benchmark we use export spillovers, the existence of which was documented byMion and Opromolla (2014),Fernandes and Tang (2014)andKamal and Sundaram (2016)among others. To make this comparison meaningful, we use the same data and empirical approach for both types of spill- overs: we employ our identification strategy 1 to also estimate export spillovers in Hungary.Table A6in Appendix A.2 presents the results.
Both the patterns and the magnitudes are similar to our import spillover results. For example, in the full model including other type of experi- ence as well the same-building effect is 0.16 percentage points, the neighbor-building effect is 0.04 percentage points and the managerial peer effect is 0.37 percentage points. Relative to the baseline hazard of starting to export, 0.21, these estimates correspond to an increase in ex- port probability of 76%, 19% and 176%, while the analogous numbers for the increase in import probability relative to its baseline of 0.19 are 116%, 21% and 216%. Export spillovers, like import spillovers, are also highly concentrated in space. We conclude that diffusion of knowledge about importing is about as strong as diffusion of knowledge about exporting.
As a second benchmark we ask what increase infirm productivity would predict the increase in the probability of importing created by knowledge spillovers. In our sample the probability of starting to import from a country is 0.19% for not-yet-importerfirms in the lowest produc- tivity quartile,170.28% in the second quartile, 0.47% in the third quartile and 0.58% in the highest quartile. Consequently, the estimated same- building import spillover effect of 0.21 percentage points is comparable to the predicted increase in the probability of starting to import as afirm moves from the second to the third productivity quartile. This result fur- ther confirms the economic significance of the estimated import spill- over effect.
In our third benchmark we look not at the strength of the spillover but at its speed of decay in space. In particular, we infer a parameter of spatial decay that can be explicitly compared to similar decay parame- ters in the literature. Our approach is to convert the same-building and neighbor-building estimates of research design 1 to a distance-based metric. We work with the decay functionβij=k⋅e−δ⋅distij, whereβijis the estimated spillover fromfirmjtoi,distijis the spatial distance be- tween the twofirms, andkandδare parameters. In the 65% of the sam- ple which we were able to geocode, wefind that the average distance between two neighboring buildings is 28.1 m. Assuming that distance is zero if twofirms are in the same building, calibratingδandkto the specification of column (4) inTable 5, we obtainδ= 0.0579/m. This im- plies that spillovers decline by 5.6% every meter.18This value is some- what higher than other estimates of within-city spatial decay. Indeed, the estimates ofArzaghi and Henderson (2008)on networking benefits among advertising agencies in Manhattan imply a decay of 0.3% per meter; those byRossi-Hansberg et al. (2010)on housing externalities in Richmond imply a decay of 0.2% per meter; and those byAhlfeldt et al. (2015)on production and residential externalities in Berlin imply de- cays of 0.4% respectively 1% per meter.19The main common feature of these results and ours is that they all represent fairly strong decay:
knowledge spillovers appear to be highly spatially concentrated. And the fact that our estimate is the highest suggests that in our context building boundaries are important barriers to diffusion. Our decay
-.50.511.522.5
% points
0 1 2 3 4 5
event-year after the mover comes
(a) without fixed effects
-.50.511.522.5
% points
0 1 2 3 4 5
event-year after the mover comes
(b) with fixed effects
Fig. 1.Effect of experienced peer moving into building on same-country imports. Notes: Sample includesfirm-country pairs with thefirm located in a building where a new mover arrives, and where nofirm has imported from the country before, observed in years after the move. The solid lines show the estimated difference in the number of importersτyears after the move in buildings with movers having country-specific import experience vs with inexperienced movers.τ= 5 includes 5 or more years. The dashed lines show the 95% confidence interval, with standard errors clustered by building. Panel (a) shows estimates withoutfixed effects and Panel (b) shows the same estimates includingfirm-year and country-yearfixed effects in the regression.
16We report the full set of coefficients inTable A5of Appendix A.2.
17Coincidence with the overall baseline is due to manyfirms with missing data on productivity.
18The formula to calculate it is 1−e−δ×distwhereδis the estimated decay parameter anddistdenotes distance in meters.
19To calculate these decay parameters, we use column 3 ofTable 4inArzaghi and Hen- derson (2008), the estimate on page 524 inRossi-Hansberg et al. (2010), and column 1 of Table V inAhlfeldt et al. (2015).