toxins
Article
Screening Mold Colonies by Using Two Toxicity Assays Revealed Indoor Strains of Aspergillus calidoustus Producing Ophiobolins G and K
Marja Johanna Salo1,*, Tamás Marik2, OttóBencsik2, Raimo Mikkola1 , LászlóKredics2, András Szekeres2 , Maria A. Andersson1, Heidi Salonen1and Jarek Kurnitski1,3
1 Department of Civil Engineering, Aalto University, Box 12100, FI-00076 Aalto, Finland;
raimo.mikkola@aalto.fi (R.M.); aino.andersson@aalto.fi (M.A.A.); heidi.salonen@aalto.fi (H.S.);
jarek.kurnitski@aalto.fi (J.K.)
2 Department of Microbiology, Faculty of Science and Informatics, University of Szeged, Közép fasor 52, 6727 Szeged, Hungary; mariktamas88@gmail.com (T.M.); bencsikotto@gmail.com (O.B.);
laszlo.kredics@gmail.com (L.K.); andras.j.szekeres@gmail.com (A.S.)
3 Department of Civil Engineering and Architecture, Tallinn University of Technology, Ehitajate tee 5, 19086 Tallinn, Estonia
* Correspondence: johanna.72salo@gmail.com; Tel.:+358-50-36-01-468
Received: 26 August 2019; Accepted: 19 November 2019; Published: 21 November 2019
Abstract:The occurrence and toxin production of the opportunistic pathogenAspergillus calidoustus in Finnish buildings is not well documented in the literature. We tracked and identified four A. calidoustuscolonies cultivated from indoor settled dusts and revealed the biological activities of crude biomass extracts. The toxic substances were identified as 6-epi-ophiobolin K, ophiobolin K, and ophiobolin G by high-performance liquid chromatography–mass spectrometry (HPLC-MS) based on chromatographic and mass spectrometry data (MS and MS/MS) on the crude extract ofA. calidoustus strain MH34. A total of 29 fungal colonies collected from settled dust in an office room reported for indoor-air-related illnesses were screened for toxins that inhibited boar sperm motility in the BSMI (boar sperm motility inhibiting) assay and cell proliferation in the ICP (inhibition of cell proliferation) assays with PK-15 cells. Out of the 27 colonies tested as toxic, 12 colonies exhibiting conidiophores representative of the generaChaetomium,Penicillium,and Paecilomyceswere excluded from the study, while 13 colonies exhibitedAspergillus-like conidiophores. Biomass suspensions of these colonies were divided into two categories: Category 1 colonies (n=4), toxic in the BSMI assay and the ICP assays, emitted blue fluorescence and grew at 37◦C; Category 2 colonies (n=9), only toxic in the ICP assay, emitted orange fluorescence and exhibited limited or no growth at 37◦C. Colonies in Category 1 were pure-cultured, and the strains were named as MH4, MH21, MH34, MH36. Strain MH34 was identified asA. calidoustusby the internal transcribed spacer (ITS) sequences. Ethanol-soluble dry substances extracted from the biomass of the pure cultures exhibited a toxicological profile in the BSMI assay, SMID (sperm membrane integrity damage) assay, and ICP assay similar to that exhibited by pure ophiobolin A. Overall, the viable conidia ofA. calidoustusin indoor settled dusts deserve attention when potentially hazardous mold species are monitored.
Keywords: Aspergillus calidoustus; ophiobolins; indoor mold; fluorescence
Key Contribution: This study describes detection methods for potentially pathogenic and toxin-producingA. calidoustusstrains in indoor dust.
Toxins2019,11, 683; doi:10.3390/toxins11120683 www.mdpi.com/journal/toxins
Toxins2019,11, 683 2 of 16
1. Introduction
Representatives ofAspergillussectionUstiare commonly reported in built environments in Europe and North America [1,2]. A previously documented polyphasic taxonomic approach, including molecular data, based on the internal transcribed spacer (ITS), calmodulin andβ-tubulin sequences, extrolite profiling, morphological criteria, and growth at 37◦C revealed that sectionUsticonsists of 21 species [3]. Members of sectionUstiproduce extrolites unique to the genusAspergillus, including ophiobolins known to be produced byAspergillus calidoustus[2].
A. calidoustus differs from A. ustus lat. ustus in its ability to grow at 37 ◦C and it being an opportunistic pathogen [2,3]. A. calidoustus strains have already been isolated from various environments, like indoor air in Germany, wooden construction materials in Finland as well as clinical and indoor samples from the Netherlands, Norwegian drinking water distribution systems, and built environments in Canada [2–4]. Moreover, building-derived strains ofAspergillussectionUsti, probably mostlyA. calidoustusstrains, isolated from chipboard and gypsum liner were suggested as producers of ophiobolin-type compounds [5,6]. Clinical strains ofA. calidoustusfrom Europe have been shown to produce ophiobolin G and H, and ophiobolin production has been suggested as a virulence factor [2].
A. calidoustusis considered a relatively rare human pathogen primarily causing cutaneous aspergillosis and eye infections but is also associated with high mortality rates due to its resistance to antifungal drugs [7].
A. calidoustus is therefore a novel, toxin-producing potential pathogen detected in indoor environments, and requires attention as an emerging hazardous indoor contaminant.
Secondary metabolites ophiobolins are sesterterpenoids produced by filamentous fungi belonging to the generaBipolaris, Drechslera,Cephalosporium,Ulocladium, andAspergillus. Most of the fungal secondary metabolites can help the fungus occupy its growth substratum as well as survive in natural environments, but they may also have toxic effects on humans and animals [8,9]. The toxic effects of ophiobolins in vitro and low acute toxicity in in vivo experiments have been extensively studied due to the suspected anticancerous activity of ophiobolins [9]. Additionally, ophiobolin A, 6-epi-ophiobolin K, and ophiobolin K pure compounds displayed in previous studies antifungal activity, antiprotozoal activity, and cytotoxic and mitochondriotoxic activity in human tumoral and continuous cell lines [10,11]. Ophiobolin A-induced calmodulin inhibitory effect and growth-inhibitory effects in mammalian cells and slowly proliferating mammalian cells are less sensitive to growth-inhibitory effects of ophiobolin A than their highly proliferative counterparts [10,11].
The in vivo toxicity of ophiobolins is not well documented in the literature, and ophiobolin-induced intoxications in humans have not ever been reported; however, the rapid release of inflammatory mediators and systemic inflammation promoted by exposure to ophiobolin A [12] and mitochondrial dysfunctions [7,8], recorded after prolonged exposure to ophiobolins. Ophiobolin family with many structurally similar analogues [13] could cause health effects in exposed humans.
Indoor strains ofA. calidoustusisolated from Canadian buildings did not produce ophiobolins under the conditions tested by Slack et al. [2,3]. The prevalence of ophiobolin producers among indoorA. calidoustusstrains, the indoor occurrence of this potential pathogen, and the identity of the different ophiobolins produced by indoor strains are currently unknown. Furthermore, ophiobolins produced by indoorAspergillusstrains and their toxic activities have gained little attention in the field as indoor hazards.
This study describes ophiobolin-producing indoorA. calidoustusstrains isolated from settled indoor dusts from an office room in a 1960s university building in Finland. It also describes a novel battery of methods enabling the tracking of ophiobolin-producingA. calidoustusstrains and their separation from otherAspergillusstrains growing similarly from the same dust samples. Furthermore, the biological activities of the crude biomass extracts containing ophiobolins are revealed in a battery of bioassays as well as the HPLC-MS-based identification of these compounds.
Toxins2019,11, 683 3 of 16
2. Results
2.1. Screening Single Colonies for Toxicity in Two Bioassays Divided Yellow–White Aspergillus Colonies in Two Categories Differing in Toxic Responses and Fluorescence Emission
Mold colonies (n=29) cultivated from settled indoor dust on malt extract plates (Figure1) were screened for toxicity via two bioassays. The colonies exhibited five responses based on toxicity of the assays and were divided into five categories: Category (1) colonies toxic in both assays, cytostatic to PK-15 cells (ICP, inhibition of cell proliferation assay), and inhibiting sperm motility after exposure for 30 min (BSMI, boar sperm motility inhibition assay); Category (2) colonies toxic only in the ICP assay, nontoxic to sperm cells; Category (3) colonies toxic in both assays but need one day for toxic response in the BSMI assay; Category (4) colonies toxic only in the BSMI assay after 30 min and/or one day of exposure, not cytostatic to the PK-15 cells in the ICP assay; and Category (5) colonies provoking no responses in the toxicity assays.
Toxins 2019, 11, 683 3 of 17
2. Results
2.1. Screening Single Colonies for Toxicity in Two Bioassays Divided Yellow–White Aspergillus Colonies in Two Categories Differing in Toxic Responses and Fluorescence Emission
Mold colonies (n = 29) cultivated from settled indoor dust on malt extract plates (Figure 1) were screened for toxicity via two bioassays. The colonies exhibited five responses based on toxicity of the assays and were divided into five categories: Category (1) colonies toxic in both assays, cytostatic to PK-15 cells (ICP, inhibition of cell proliferation assay), and inhibiting sperm motility after exposure for 30 min (BSMI, boar sperm motility inhibition assay); Category (2) colonies toxic only in the ICP assay, nontoxic to sperm cells; Category (3) colonies toxic in both assays but need one day for toxic response in the BSMI assay; Category (4) colonies toxic only in the BSMI assay after 30 min and/or one day of exposure, not cytostatic to the PK-15 cells in the ICP assay; and Category (5) colonies provoking no responses in the toxicity assays.
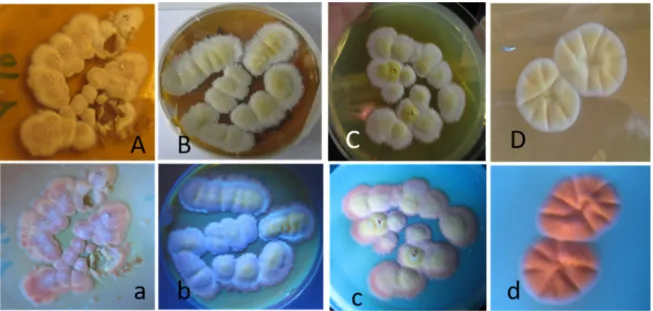
Figure 1. Indoor fungi grown for three weeks on malt extract agar from a swab wiped from an office in a university building in Finland. The office was abandoned by the occupant due to serious indoor air-related illness. Each of the numbered colonies on Panels (A–E) were separately tested for the presence of toxins. The reverse side of the plate in Panel (E) is shown in Panel (F) with the dark reverse of colonies 34 and 36 in contrast to colonies 31, 32, and 33.
The most toxic colonies representing Category 1, numbers 4, 21, 34, and 36 in Figure 1, were toxic in both the ICP and BSMI assays. Biomass suspensions of the colonies completely inhibited sperm motility and the proliferation of porcine kidney cells (PK-15 cells) after 30 min and 24 h of exposure, respectively. The biomass suspensions contained hyphae, conidia, and liquid vesicles picked from the surface of the plate-grown colonies shown in Figure 1. The four colonies were white and yellow with a dark reverse side (Figure 1) and exhibited the same Aspergillus-like morphology, which is represented by colony No. 34 in Figure 2A–C, and all four colonies grew at 37 °C.
D
B C
A
E F
Figure 1.Indoor fungi grown for three weeks on malt extract agar from a swab wiped from an office in a university building in Finland. The office was abandoned by the occupant due to serious indoor air-related illness. Each of the numbered colonies on Panels (A–E) were separately tested for the presence of toxins. The reverse side of the plate in Panel (E) is shown in Panel (F) with the dark reverse of colonies 34 and 36 in contrast to colonies 31, 32, and 33.
The most toxic colonies representing Category 1, numbers 4, 21, 34, and 36 in Figure1, were toxic in both the ICP and BSMI assays. Biomass suspensions of the colonies completely inhibited sperm motility and the proliferation of porcine kidney cells (PK-15 cells) after 30 min and 24 h of exposure, respectively. The biomass suspensions contained hyphae, conidia, and liquid vesicles picked from the surface of the plate-grown colonies shown in Figure1. The four colonies were white and yellow with a dark reverse side (Figure1) and exhibited the sameAspergillus-like morphology, which is represented by colony No. 34 in Figure2A–C, and all four colonies grew at 37◦C.
Toxins2019,11, 683 4 of 16
Toxins 2019, 11, 683 4 of 17
Figure 2. Micrographs showing the morphology of the Aspergillus conidiophores exhibited by colonies in Categories 1 and 2. Panels (A,B) show the conidiophore and Hülle cells of colony 34 and represent the morphology of colonies in Category 1 toxic to both sperm cells and PK-15 cells. Panel (C) shows the conidiophores of colony 31 and represents the colonies in Category 2, toxic only to PK- 15 cells.
The colonies in Category 2, the nine colonies numbered 10, 11, 12, 13, 25, 26, 32, 33, and 35 in Figure 1, which were also found to exhibit Aspergillus-like conidiophores (Figure 2), were very toxic in the ICP assay, provoked no response in the BSMI assay, and exhibited no or very weak growth at 37 °C. These colonies were also yellow or white, but their reverse side was pale (Figure 1). Colonies in Categories 3 to 5, exhibiting the morphology of conidiophores indicative of the genera Chaetomium, Penicillium, Paecilomyces, and Cladosporium, were excluded from this study.
The 13 yellow–white Aspergillus-like colonies in Categories 1 and 2 were pure-cultured on malt extract agar, named MH4, MH21, MH34, MH36 and MH10, MH13, MH25, MH26, MH32, MH33, MH35, and pictured in visible and UV light (360 nm). Representatives of the pure cultures are shown in Figure 3. All Aspergillus-like pure cultures were light white–yellow in visible light but differed in color in the fluorescence emissions. When excited with UV light, pure cultures in Category 1 (Figure 3A–C) emitted violet-blue emissions (Figure 3a–c), whereas pure cultures in Category 2 emitted strong orange fluorescence, as represented by MH10 in Figure 3D and 3d.
Figure 3. Pure cultures of Aspergillus-like strains pictured in visible light (upper row) and UV light (lower row). The cultures were grown on malt extract agar at 22 °C for 10 days. The picture shows the white–yellow colonies of the strains MH4, MH21, MH34 in Panels (A–C) (uppercase), respectively.
The same colonies emitting violet–blue fluorescence are shown in Panels (a–c) (lowercase). Panels (D) (uppercase) and (d) (lowercase) show the white–yellow colonies of strain MH10 in visible light and the colonies emitting orange fluorescence in UV light, respectively.
Figure 2.Micrographs showing the morphology of theAspergillusconidiophores exhibited by colonies in Categories 1 and 2. Panels (A,B) show the conidiophore and Hülle cells of colony 34 and represent the morphology of colonies in Category 1 toxic to both sperm cells and PK-15 cells. Panel (C) shows the conidiophores of colony 31 and represents the colonies in Category 2, toxic only to PK-15 cells.
The colonies in Category 2, the nine colonies numbered 10, 11, 12, 13, 25, 26, 32, 33, and 35 in Figure1, which were also found to exhibitAspergillus-like conidiophores (Figure2), were very toxic in the ICP assay, provoked no response in the BSMI assay, and exhibited no or very weak growth at 37◦C. These colonies were also yellow or white, but their reverse side was pale (Figure1). Colonies in Categories 3 to 5, exhibiting the morphology of conidiophores indicative of the generaChaetomium, Penicillium,Paecilomyces, andCladosporium, were excluded from this study.
The 13 yellow–whiteAspergillus-like colonies in Categories 1 and 2 were pure-cultured on malt extract agar, named MH4, MH21, MH34, MH36 and MH10, MH13, MH25, MH26, MH32, MH33, MH35, and pictured in visible and UV light (360 nm). Representatives of the pure cultures are shown in Figure3. AllAspergillus-like pure cultures were light white–yellow in visible light but differed in color in the fluorescence emissions. When excited with UV light, pure cultures in Category 1 (Figure3A–C) emitted violet-blue emissions (Figure3a–c), whereas pure cultures in Category 2 emitted strong orange fluorescence, as represented by MH10 in Figures3D and3d.
Toxins 2019, 11, 683 4 of 17
Figure 2. Micrographs showing the morphology of the Aspergillus conidiophores exhibited by colonies in Categories 1 and 2. Panels (A,B) show the conidiophore and Hülle cells of colony 34 and represent the morphology of colonies in Category 1 toxic to both sperm cells and PK-15 cells. Panel (C) shows the conidiophores of colony 31 and represents the colonies in Category 2, toxic only to PK- 15 cells.
The colonies in Category 2, the nine colonies numbered 10, 11, 12, 13, 25, 26, 32, 33, and 35 in Figure 1, which were also found to exhibit Aspergillus-like conidiophores (Figure 2), were very toxic in the ICP assay, provoked no response in the BSMI assay, and exhibited no or very weak growth at 37 °C. These colonies were also yellow or white, but their reverse side was pale (Figure 1). Colonies in Categories 3 to 5, exhibiting the morphology of conidiophores indicative of the genera Chaetomium, Penicillium, Paecilomyces, and Cladosporium, were excluded from this study.
The 13 yellow–white Aspergillus-like colonies in Categories 1 and 2 were pure-cultured on malt extract agar, named MH4, MH21, MH34, MH36 and MH10, MH13, MH25, MH26, MH32, MH33, MH35, and pictured in visible and UV light (360 nm). Representatives of the pure cultures are shown in Figure 3. All Aspergillus-like pure cultures were light white–yellow in visible light but differed in color in the fluorescence emissions. When excited with UV light, pure cultures in Category 1 (Figure 3A–C) emitted violet-blue emissions (Figure 3a–c), whereas pure cultures in Category 2 emitted strong orange fluorescence, as represented by MH10 in Figure 3D and 3d.
Figure 3. Pure cultures of Aspergillus-like strains pictured in visible light (upper row) and UV light (lower row). The cultures were grown on malt extract agar at 22 °C for 10 days. The picture shows the white–yellow colonies of the strains MH4, MH21, MH34 in Panels (A–C) (uppercase), respectively.
The same colonies emitting violet–blue fluorescence are shown in Panels (a–c) (lowercase). Panels (D) (uppercase) and (d) (lowercase) show the white–yellow colonies of strain MH10 in visible light and the colonies emitting orange fluorescence in UV light, respectively.
Figure 3. Pure cultures ofAspergillus-like strains pictured in visible light (upper row) and UV light (lower row). The cultures were grown on malt extract agar at 22◦C for 10 days. The picture shows the white–yellow colonies of the strains MH4, MH21, MH34 in Panels (A–C) (uppercase), respectively.
The same colonies emitting violet–blue fluorescence are shown in Panels (a–c) (lowercase). Panels (D) (uppercase) and (d) (lowercase) show the white–yellow colonies of strain MH10 in visible light and the colonies emitting orange fluorescence in UV light, respectively.
Toxins2019,11, 683 5 of 16
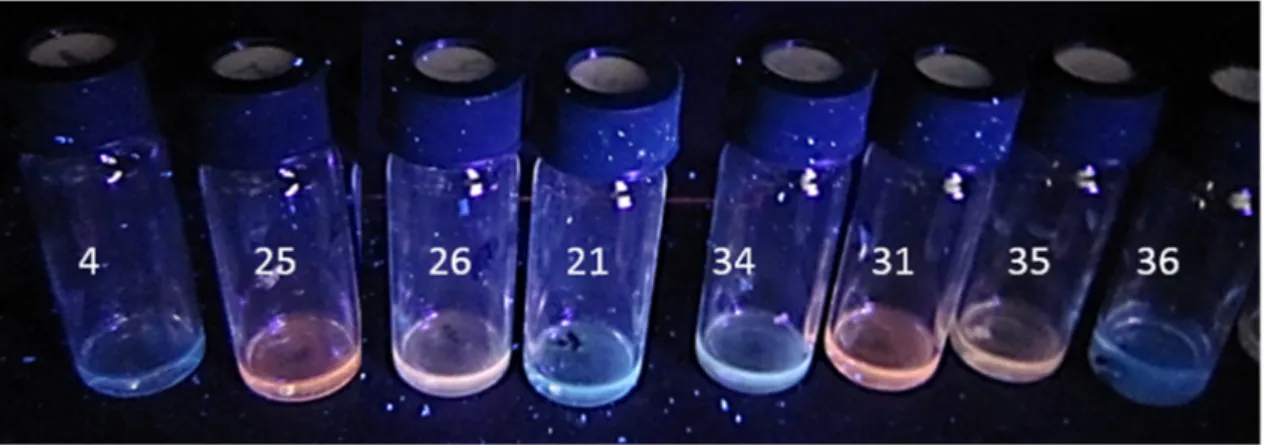
To test if fluorescence emission would speed up and confirm the division of theAspergilluscultures into two categories, the biomass suspensions of the single colonies as well as the pure cultures were inspected for fluorescence emissions when excited with UV light (360 nm). Biomass suspensions of the single colonies (No. 4, 21, 34, and 36 in Figure4) as well as the pure cultures obtained from them (MH4, MH21, MH34, and MH36) (data not shown) emitted blue fluorescence, whereas the colonies in Category 2 (25, 26, 31, and 35 in Figure4), toxic only to PK-15 cells in the ICP assay, emitted orange fluorescence. Biomass suspensions of the pure cultures, reference strain,A. versicolorSL/3, and pure sterigmatocystin emitted similar orange fluorescence (data not shown). Based on fluorescence emission and responses to the toxicity assays, theAspergillus-like colonies and biomass suspensions were divided into the blue-fluorescence-emitting colonies, which were toxic in both the BSMI and ICP assays, and the orange-fluorescence-emitting colonies, which were toxic only in the ICP assay against the PK-15 cells.
Toxins 2019, 11, 683 5 of 17
To test if fluorescence emission would speed up and confirm the division of the Aspergillus cultures into two categories, the biomass suspensions of the single colonies as well as the pure cultures were inspected for fluorescence emissions when excited with UV light (360 nm). Biomass suspensions of the single colonies (No. 4, 21, 34, and 36 in Figure 4) as well as the pure cultures obtained from them (MH4, MH21, MH34, and MH36) (data not shown) emitted blue fluorescence, whereas the colonies in Category 2 (25, 26, 31, and 35 in Figure 4), toxic only to PK-15 cells in the ICP assay, emitted orange fluorescence. Biomass suspensions of the pure cultures, reference strain, A.
versicolor SL/3, and pure sterigmatocystin emitted similar orange fluorescence (data not shown).
Based on fluorescence emission and responses to the toxicity assays, the Aspergillus-like colonies and biomass suspensions were divided into the blue-fluorescence-emitting colonies, which were toxic in both the BSMI and ICP assays, and the orange-fluorescence-emitting colonies, which were toxic only in the ICP assay against the PK-15 cells.
Figure 4. Biomass suspensions of single mold colonies photographed when excited with UV light (360 nm). The colonies toxic in both assays are Colonies 4, 21, 34, and 36, which emitted blue fluorescence.
Suspensions of the colonies toxic only to PK-15 cells emitted orange fluorescence (Colonies 25, 26, 31, and 35).
2.2. The Four Blue-Fluorescing Strains Exhibited a Uniform Toxicity Profile in Four Bioassays and Were Identified as Aspergillus calidoustus
Toxic compounds from the biomass of pure cultures (grown on malt extract agar) of the 13 Aspergillus-like strains were extracted with ethanol. The toxicological profiles of the ethanol-soluble dry substances were investigated via a set of four toxicity assays. Selected Aspergillus, Trichoderma, Chaetomium, and Bipolaris strains from our previous strain collection were investigated for toxic responses and mycotoxin production, and were used as reference strains. The toxic responses of the crude extracts of the reference strains were compared to the responses obtained from commercially available pure mycotoxins. The toxic responses in the four bioassays, expressed as EC50
concentrations of the dry substances in the crude extracts and of the pure mycotoxins, are summarized in Table 1.
Strain MH34, considered similar to strains MH4, MH21, and MH36 based on the toxicity pattern shown in Table 1, fluorescence, morphology of its colonies and conidiophores (Figures 1–4), and its ability to grow at 37 °C, was identified as A. calidoustus based on ITS sequence analysis. Extracts from the Aspergillus calidoustus strains MH4, MH21, and MH36, and from the ophiobolin A producing Bipolaris oryze SZMC 13003 as well as pure ophiobolin A were characterized by high toxicity (0.5–2 µg mL−1) in the BSMI assay after one day of exposure, a 10-fold decrease in toxic endpoint if the exposure of the sperm cells was prolonged from one hour to one to two days, and high toxicity (0.5–
1 µg mL−1) in the ICP assay. The other reference strains exhibited high toxicity in the BSMI compared to the toxicity in the ICP assay (T. atroviride Tri335, A. westerdijkiae PP2, Chaetomium globosum HS1) or high toxicity in the ICP assay compared to the toxicity in the BSMI assay (A. versicolor SL/3).
Figure 4. Biomass suspensions of single mold colonies photographed when excited with UV light (360 nm). The colonies toxic in both assays are Colonies 4, 21, 34, and 36, which emitted blue fluorescence.
Suspensions of the colonies toxic only to PK-15 cells emitted orange fluorescence (Colonies 25, 26, 31, and 35).
2.2. The Four Blue-Fluorescing Strains Exhibited a Uniform Toxicity Profile in Four Bioassays and Were Identified as Aspergillus calidoustus
Toxic compounds from the biomass of pure cultures (grown on malt extract agar) of the 13 Aspergillus-like strains were extracted with ethanol. The toxicological profiles of the ethanol-soluble dry substances were investigated via a set of four toxicity assays. SelectedAspergillus,Trichoderma, Chaetomium, and Bipolarisstrains from our previous strain collection were investigated for toxic responses and mycotoxin production, and were used as reference strains. The toxic responses of the crude extracts of the reference strains were compared to the responses obtained from commercially available pure mycotoxins. The toxic responses in the four bioassays, expressed as EC50concentrations of the dry substances in the crude extracts and of the pure mycotoxins, are summarized in Table1.
Strain MH34, considered similar to strains MH4, MH21, and MH36 based on the toxicity pattern shown in Table1, fluorescence, morphology of its colonies and conidiophores (Figures1–4), and its ability to grow at 37◦C, was identified asA. calidoustusbased on ITS sequence analysis. Extracts from the Aspergillus calidoustusstrains MH4, MH21, and MH36, and from the ophiobolin A producingBipolaris oryzeSZMC 13003 as well as pure ophiobolin A were characterized by high toxicity (0.5–2µg mL−1) in the BSMI assay after one day of exposure, a 10-fold decrease in toxic endpoint if the exposure of the sperm cells was prolonged from one hour to one to two days, and high toxicity (0.5–1µg mL−1) in the ICP assay. The other reference strains exhibited high toxicity in the BSMI compared to the toxicity in the ICP assay (T. atrovirideTri335,A. westerdijkiaePP2,Chaetomium globosumHS1) or high toxicity in the ICP assay compared to the toxicity in the BSMI assay (A. versicolorSL/3).
Toxins2019,11, 683 6 of 16
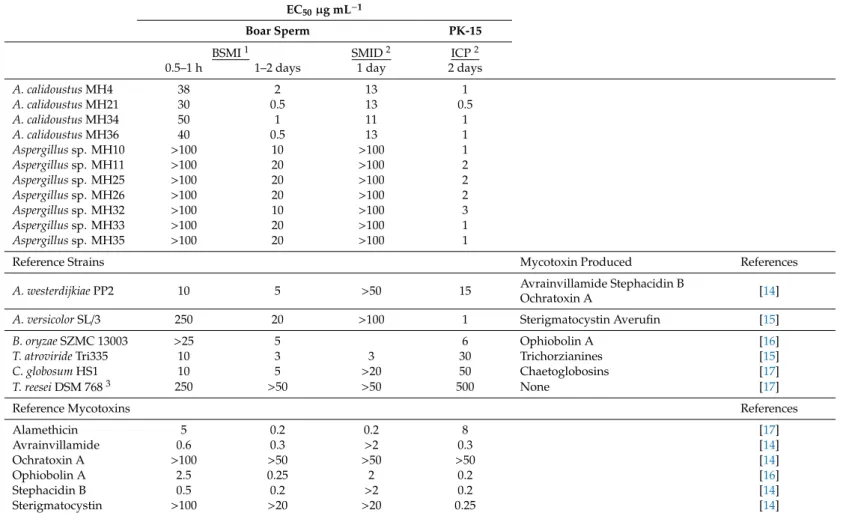
Table 1.Toxic endpoints for the crude extracts of indoorAspergillus calidoustusandAspergillussp. strains. The extracts were tested in twofold dilutions. The strains were compared to selected reference strains and selected pure reference mycotoxins in a set of toxicity assays exposing boar spermatozoa and porcine kidney PK-15 cells.
EC50µg mL−1
Boar Sperm PK-15
BSMI1 SMID2 ICP2
0.5–1 h 1–2 days 1 day 2 days
A. calidoustusMH4 38 2 13 1
A. calidoustusMH21 30 0.5 13 0.5
A. calidoustusMH34 50 1 11 1
A. calidoustusMH36 40 0.5 13 1
Aspergillussp. MH10 >100 10 >100 1
Aspergillussp. MH11 >100 20 >100 2
Aspergillussp. MH25 >100 20 >100 2
Aspergillussp. MH26 >100 20 >100 2
Aspergillussp. MH32 >100 10 >100 3
Aspergillussp. MH33 >100 20 >100 1
Aspergillussp. MH35 >100 20 >100 1
Reference Strains Mycotoxin Produced References
A. westerdijkiaePP2 10 5 >50 15 Avrainvillamide Stephacidin B
Ochratoxin A [14]
A. versicolorSL/3 250 20 >100 1 Sterigmatocystin Averufin [15]
B. oryzaeSZMC 13003 >25 5 6 Ophiobolin A [16]
T. atrovirideTri335 10 3 3 30 Trichorzianines [15]
C. globosumHS1 10 5 >20 50 Chaetoglobosins [17]
T. reeseiDSM 7683 250 >50 >50 500 None [17]
Reference Mycotoxins References
Alamethicin 5 0.2 0.2 8 [17]
Avrainvillamide 0.6 0.3 >2 0.3 [14]
Ochratoxin A >100 >50 >50 >50 [14]
Ophiobolin A 2.5 0.25 2 0.2 [16]
Stephacidin B 0.5 0.2 >2 0.2 [14]
Sterigmatocystin >100 >20 >20 0.25 [14]
1BSMI (boar sperm motility inhibition assay), the average difference between three measurements were within one dilution step.2SMID (sperm membrane integrity damage assay) and ICP (inhibition of cell proliferation assay), the SD between three measurements was<±35%.3Negative control representing the upper limit of the assay.
Toxins2019,11, 683 7 of 16
The results also indicated that the crude extracts of theA. calidoustusstrains may have contained substances with bioactivities similar to those of ophiobolin A. These substances expressed cytostatic activity in proliferating somatic cells and motility-inhibiting toxicity in exposed sperm cells at similar low concentrations to that of ophiobolin A. The motility-inhibiting activity recorded with the BSMI assay for theA. calidoustusextracts was caused by a sublethal effect, since the EC50concentrations of the motility inhibition in the BSMI assay was 10 times lower than the EC50concentrations in the SMID assay measuring lethal toxicity as a loss of plasma membrane integrity.
Crude extracts of the orange-fluorescence-emittingAspergillussp. strains MH10, MH12, MH25, MH26, MH32, MH33, and MH35 and the reference strainA. versicolorSL/3 provoked no response in the sperm assay (BSMI assay) after short-term exposure (≤1 h), but the extracts and pure sterigmatocystin were highly toxic to proliferating PK-15 cells in the ICP assay. These results indicated that the extracts from the blue-fluorescingA. calidoustusstrains contained different toxic substances than the extracts from the nine orange-fluorescingAspergillussp. strains.
2.3. Toxic Compounds in the Crude Extract of Aspergillus calidoustus Were Identified as Ophiobolins
The toxic compounds fromA. calidoustusstrain MH 34 provoking toxic response in the BSMI and ICP assays were identified using a bioactivity-guided approach, that is, bioassay-directed high-performance liquid chromatography (HPLC) fractionation which resulted in the isolation of the toxic compounds. The bioassays identified 2 HPLC fractions out of 26 fractions tested, which inhibited sperm motility and proliferation of PK-15 cells, respectively. Toxic compounds ofA. calidoustusstrain MH 34 were identified using high-performance liquid chromatography–mass spectrometry (HPLC-MS).
Compound1at retention time 4.2 min had a protonated mass ion [M+H]+atm/z385.5 and a sodiated mass ion [M+Na]+atm/z407.5 and dimer [2M+Na]+atm/z791.4. The MS/MS spectra of the precursor mass ion atm/z791.4 produced a sodiated mass ion atm/z407.5, indicating thatm/z791.4 mass ion was [2M+Na]+dimer. The MS/MS spectra of the precursor mass ion atm/z385.5 gave similarm/z 201, 307, 349 mass fragment ions as the published reference MS/MS spectra of the mass ionm/z385 of 6-epi-ophiobolin K [17]. Compound2at retention time 4.2 min had a protonated mass ion [M+H]+at m/z385.5, a sodiated mass ion [M+Na]+atm/z407.5, and [2M+Na]+dimer atm/z791.4. The MS/MS spectra of the precursor ion atm/z791.4 produced a sodiated mass ion atm/z407.5, indicating thatm/z 791.4 mass ion was [2M+Na]+dimer. The MS/MS spectra of the precursor mass ion atm/z385.5 gave similarm/z109, 201, 239, 331, 349 mass fragment ions as the published reference MS/MS spectra of the mass ionm/z385 of ophiobolin K [13]. Compound3at retention time 5.1 min had a protonated mass ion [M+H]+atm/z367.2 and a sodiated mass ion [M+Na]+atm/z389.2 and [2M+H]+and [2M+Na]+ dimers atm/z733.0 and 756.0, respectively. The MS/MS spectra of the precursor mass ions atm/z733.0 and 756.0 produced protonated mass ions atm/z367.2 and sodiatedm/z389.2, indicating that mass ions atm/z733.0 and 756.0 were [2M+H]+and [2M+Na]+dimers, respectively. The MS/MS spectra of the precursor mass ion atm/z367.2 gave similarm/z293.1, 307.2, 331.3, 349.2 mass fragment ions as the published reference MS/MS spectra of the corresponding mass ions of ophiobolins [13]. Based on retention times, MS and MS/MS mass spectrometric analysis, and the published mass spectrometric data of ophiobolins [13], compounds1,2, and3were identified as 6-epi-ophiobolin K, ophiobolin K, and ophiobolin G, respectively.
2.4. The Crude Extract of Aspergillus calidoustus Strain MH34 Provoked Sublethal Toxic Effects in Exposed Sperm Cells and Somatic Cells
The crude extract ofA. calidoustusstrain MH34 containing 6-epi-ophiobolin K, ophiobolin K, and ophiobolin G provoked fragmented nuclei in resting PK-15 cells. Cells exposed to the solvent only are shown in Figure5A,D,G. Fragmented nuclei visible in c. 50% of the cells (Figure5B) with intact, blebbing plasma membranes (Figure5E) were visible in fluorescence micrographs after exposure to concentrations of 13–26µg mL−1. Detailed pictures of fragmented nuclei and nuclear fragments in cells with intact plasma membranes are shown in Figure5H,I, respectively. Necrotic cell death, visible
Toxins2019,11, 683 8 of 16
as purple and red emissions in 100% of cells permeable to propidium iodide, occurred at exposure concentrations of 125 to 250µg mL−1(Figure5C,F). These results indicate that sublethal toxicity, visible as fragmentation of nuclei in PK-15 cells with intact plasma membranes, occurred at 10-fold smaller concentrations than the lethal toxicity indicated by necrotic cell death.
Toxins 2019, 11, 683 9 of 17
toxicity, visible as fragmentation of nuclei in PK-15 cells with intact plasma membranes, occurred at 10-fold smaller concentrations than the lethal toxicity indicated by necrotic cell death.
Figure 5. Fluorescence micrographs of porcine kidney cells (PK-15) exposed as resting cells in the monolayer to crude extracts (13 µg mL−1 and 200 µg mL−1) from A. calidoustus MH34. The cells were stained with the triple-stain Hoechst 33342 + calcein-AM + propidium iodide. The DNA stain Hoechst 33342 stains nuclei in both living and dead cells and emits blue fluorescence. Calcein-AM is cleaved by intracellular esterases to calcein, emitting green fluorescence in live cells with intact plasma membranes. The DNA stain propidium iodide permeates only dead cells, and nuclei in cells that have lost their plasma membrane integrity emit purple or red fluorescence. Panels in the first and third rows were inspected using filters to help see blue/purple emissions of Hoechst 33342 and propidium iodide (no green emission of calcein was visible), whereas the filters used for the panels in the second row helped to see green/red emissions of calcein-AM and propidium iodide, respectively (no blue emission was visible). The control cells in Panels (A) and (G) exposed to the ethanol solvent only exhibited blue fluorescence in intact nuclei in cells with plasma membranes impermeable to propidium iodide. The intactness of the plasma membrane integrity is indicated by the absence of purple emission in Panels (A) and (G) and confirmed by the green emission of the control cells in Panel (D). Cells in Panel (B) exposed to the crude extract at concentrations of 13 µg mL−1 exhibited fragmentation of blue nuclei in c. 50% of the cells, and a lack of purple emission indicated the intactness of the plasma membrane, confirmed by the green emission of the same cells pictured using the green/red filters, as shown in Panel (E). Details of the fragmented nuclei and nuclear fragments in cells with intact plasma membranes are shown in Panels (H) and (I) (no purple emissions visible).
Panels (C) and (F) show cells exposed to 200 µg mL−1 ofthe crude extract. The nuclei in 100% of the plasma-membrane-damaged necrotic cells stained with propidium iodide emitted purple and red fluorescence (no blue or green emissions visible).
Figure 5. Fluorescence micrographs of porcine kidney cells (PK-15) exposed as resting cells in the monolayer to crude extracts (13µg mL−1 and 200µg mL−1) fromA. calidoustusMH34. The cells were stained with the triple-stain Hoechst 33342+calcein-AM+propidium iodide. The DNA stain Hoechst 33342 stains nuclei in both living and dead cells and emits blue fluorescence. Calcein-AM is cleaved by intracellular esterases to calcein, emitting green fluorescence in live cells with intact plasma membranes. The DNA stain propidium iodide permeates only dead cells, and nuclei in cells that have lost their plasma membrane integrity emit purple or red fluorescence. Panels in the first and third rows were inspected using filters to help see blue/purple emissions of Hoechst 33342 and propidium iodide (no green emission of calcein was visible), whereas the filters used for the panels in the second row helped to see green/red emissions of calcein-AM and propidium iodide, respectively (no blue emission was visible). The control cells in Panels (A) and (G) exposed to the ethanol solvent only exhibited blue fluorescence in intact nuclei in cells with plasma membranes impermeable to propidium iodide. The intactness of the plasma membrane integrity is indicated by the absence of purple emission in Panels (A) and (G) and confirmed by the green emission of the control cells in Panel (D). Cells in Panel (B) exposed to the crude extract at concentrations of 13µg mL−1exhibited fragmentation of blue nuclei in c. 50% of the cells, and a lack of purple emission indicated the intactness of the plasma membrane, confirmed by the green emission of the same cells pictured using the green/red filters, as shown in Panel (E). Details of the fragmented nuclei and nuclear fragments in cells with intact plasma membranes are shown in Panels (H) and (I) (no purple emissions visible). Panels (C) and (F) show cells exposed to 200µg mL−1of the crude extract. The nuclei in 100% of the plasma-membrane-damaged necrotic cells stained with propidium iodide emitted purple and red fluorescence (no blue or green emissions visible).
Toxins2019,11, 683 9 of 16
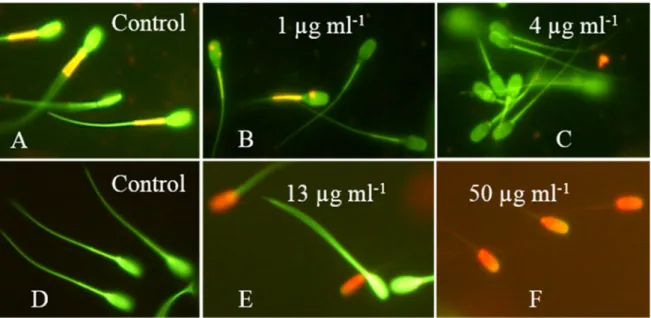
The sublethal effects of crude extracts fromA. calidoustusMH34 on exposed boar sperm are shown in Figure6. Sperm cells stained with the potentiometric dye JC-1 emit orange fluorescence in the mitochondrial sheath if the membrane potential∆Ψis high (≥−140 mV). Green fluorescence emitted by the mitochondrial sheath indicates low membrane potential (≤−100 mV) in sperm cells with intact plasma membranes. Active mitochondria in the mitochondrial sheath in the neck of the sperm cells emitted orange fluorescence, as shown in the control panel in Figure6A. The mitochondrial sheath in sperm cells exposed to 1–4µg mL−1of the crude extract emitted green fluorescence, as shown in Figure6B,C. The plasma membranes of these sperm cells were intact and impermeable to propidium iodide, which indicated the depletion of the mitochondrial∆Ψ. Figure6shows that the sublethal toxicity indicated by the depolarization of the mitochondria occurred at 10-fold lower concentrations than the lethal toxicity, indicated by the loss in plasma membrane integrity (Figure6D–F). Thus, the sublethal toxic effects recorded for the crude extract ofA. calidoustusMH34, depletion of mitochondrial
∆Ψ, and inhibition of motility occurred at the same concentrations (Figure6and Table1).
Toxins 2019, 11, 683 10 of 17
The sublethal effects of crude extracts from A. calidoustus MH34 on exposed boar sperm are shown in Figure 6. Sperm cells stained with the potentiometric dye JC-1 emit orange fluorescence in the mitochondrial sheath if the membrane potential ΔΨ is high (≥−140 mV). Green fluorescence emitted by the mitochondrial sheath indicates low membrane potential (≤−100 mV) in sperm cells with intact plasma membranes. Active mitochondria in the mitochondrial sheath in the neck of the sperm cells emitted orange fluorescence, as shown in the control panel in Figure 6A. The mitochondrial sheath in sperm cells exposed to 1–4 µg ml−1 ofthe crude extract emitted green fluorescence, as shown in Figure 6B,C. The plasma membranes of these sperm cells were intact and impermeable to propidium iodide, which indicated the depletion of the mitochondrial ΔΨ. Figure 6 shows that the sublethal toxicity indicated by the depolarization of the mitochondria occurred at 10- fold lower concentrations than the lethal toxicity, indicated by the loss in plasma membrane integrity (Figure 6D–F). Thus, the sublethal toxic effects recorded for the crude extract of A. calidoustus MH34, depletion of mitochondrial ΔΨ, and inhibition of motility occurred at the same concentrations (Figure 6 and Table 1).
Figure 6. Epifluorescence micrographs of boar sperm exposed to crude extract from A. calidoustus strain MH34. The sperm cells in the upper row were stained with the potentiometric dye JC-1, which stains membranes with high membrane potential ΔΨ orange and membranes with low ΔΨ green.
Sperm cells in the lower row were stained with the viability stain calcein-AM + propidium iodide.
Cells with intact plasma membranes are stained green, and cells with depleted plasma membrane integrity are stained red. Panel (A) shows sperm cells exposed to the solvent only exhibiting high ΔΨ in the mitochondrial sheath located in the midpiece of the sperm cells. Panels (B,C) show the concentrations for which 50% and 100% of sperm cells, respectively, exhibited depolarized mitochondria, as indicated by a decrease in orange emission from the mitochondrial sheath. Panel (D) shows control-exposed sperm cells with intact plasma membranes emitting green fluorescence.
Panels (E,F) show sperm cells exposed to concentrations causing 50% and 100% depletion of the plasma membrane integrity, respectively.
3. Discussion
This study first describes 6-epi-ophiobolin K-, ophiobolin K-, and ophiobolin G-producing A.
calidoustus strains isolated from an indoor environment in Finland. Indoor A. calidoustus strains have also been isolated in Canada, but, instead of ophiobolins, these strains were found to produce a novel sesquiterpene, drimane, and two isoquinoline alkaloids [2]. Additionally, infection-related A.
calidoustus strains have been shown to produce ophiobolin G and H in Europe [2].
This study described a battery of simple, rapid, and cost-effective methods for tracking the diversity of mycotoxin-producing indoor molds, focusing on the genus Aspergillus. The methods
Figure 6.Epifluorescence micrographs of boar sperm exposed to crude extract fromA. calidoustusstrain MH34. The sperm cells in the upper row were stained with the potentiometric dye JC-1, which stains membranes with high membrane potential∆Ψorange and membranes with low∆Ψgreen. Sperm cells in the lower row were stained with the viability stain calcein-AM+propidium iodide. Cells with intact plasma membranes are stained green, and cells with depleted plasma membrane integrity are stained red. Panel (A) shows sperm cells exposed to the solvent only exhibiting high∆Ψin the mitochondrial sheath located in the midpiece of the sperm cells. Panels (B,C) show the concentrations for which 50% and 100% of sperm cells, respectively, exhibited depolarized mitochondria, as indicated by a decrease in orange emission from the mitochondrial sheath. Panel (D) shows control-exposed sperm cells with intact plasma membranes emitting green fluorescence. Panels (E,F) show sperm cells exposed to concentrations causing 50% and 100% depletion of the plasma membrane integrity, respectively.
3. Discussion
This study first describes 6-epi-ophiobolin K-, ophiobolin K-, and ophiobolin G-producing A. calidoustusstrains isolated from an indoor environment in Finland. IndoorA. calidoustusstrains have also been isolated in Canada, but, instead of ophiobolins, these strains were found to produce a novel sesquiterpene, drimane, and two isoquinoline alkaloids [2]. Additionally, infection-related A. calidoustusstrains have been shown to produce ophiobolin G and H in Europe [2].
This study described a battery of simple, rapid, and cost-effective methods for tracking the diversity of mycotoxin-producing indoor molds, focusing on the genusAspergillus. The methods included: (a) screening biomass suspensions of single colonies for toxic responses using two toxicity
Toxins2019,11, 683 10 of 16
assays measuring different toxic mechanisms; (b) revealing the fluorescence of biomass suspensions when excited with UV light; (c) revealing growth at 37◦C; and (d) assigning the colony to the genus Aspergillusbased on the morphology of the conidiophores.
The two screening assays detected sublethal toxins disturbing cellular energy metabolism (BSMI) as well as toxins affecting cellular proliferation (ICP) [18]. Screening of the biomass suspensions from individual colonies separated the ophiobolin-producing colonies by exhibiting a low toxic response (EC50<2µg mL−1) in both toxicity assays. The same results were obtained for ophiobolin A by Bencsik et al. [16]. The toxic response and emission of blue fluorescence separated theAspergillus calidoustus colonies from the numerically dominantAspergilluscolonies growing on the same plate. These colonies were toxic only in one assay and emitted orange fluorescence.
The approach of using toxicity screening has been instrumental in tracking toxigenic species (especially new species producing novel toxins) from indoor environments and foods. Acremonium exuviarum produces the novel mitochondrial toxin acrebol [19]. Amylosin-producing Bacillus amyloliquefaciens from the indoor environment, paenilid-producing Paenibacillus tundrae, and antimycin-producing Streptomycetes from cereals were also found by toxicity assays [20–22]. In this approach, toxicity assays were used not to stress the health hazard connected to the occurrence of certain microbes in a building but for revealing the diversity of toxigenic indoor microbes by categorizing microbial colonies prior to final identification.
The toxic effects of the 6-epi-ophiobolin K-, ophiobolin K-, and ophiobolin G-containing crude extracts on exposed sperm cells and PK-15 cells were found to be similar to the toxic effects of the purified ophiobolin A. In other words, motility inhibition, mitochondrial depolarization, and cytostatic activity occurred at similar concentrations, whereas plasma membrane damage occurred at 10-fold higher concentrations [16]. Fragmentation of nuclei was detected in resting PK-15 cells after the exposure of the monolayer to 6-epi-ophiobolin K-, ophiobolin K-, and ophiobolin G-containing crude extract fromA. calidoustusMH34, which has also been described in relation to ophiobolin A in the L1210 cell line. An apoptosis-like cell death process was also observed inM. circinelloidesafter 1.6µg mL−1 ophiobolin A treatment and for ophiobolin O in MCF-7 cells [23–26]. Ophiobolin A was able to induce paraptosis-like cell death in human glioblastoma multiforme cells by decreasing the big/large conductance Ca2+-activated K+ channel activity [8,9]. The K+channel activity could explain the mitochondria-depolarizing and motility-inhibiting effects recorded for the boar sperm cells.
Exposure to ophiobolin A was shown to promote the rapid release of inflammatory mediators and promote systemic inflammation [12]. Infection-relatedA. calidoustusstrains have been shown to produce ophiobolin G [2]. Moreover, the ability to produce ophiobolin G may contribute to the virulence of infectiousA. calidoustusstrains [2]. It was hypothesized that viable ophiobolin-producing Aspergillus calidoustuscolonies in the indoor environment may represent a threat to human health because: a) exposure to ophiobolin emitted by indoor strains could modulate immune responses and contribute to symptoms experienced in moldy buildings and b) ophiobolin-producing strains could be virulent pathogens.
4. Conclusions
This study described a bioactivity-guided, bioassay-directed screening procedure for tracking the diversity of cultivated indoorAspergilluscolonies and enabling rapid recognition ofAspergillus calidoustuscolonies producing ophiobolins. The results indicated that crude extracts containing 6-epi-ophiobolin K, ophiobolin K, and ophiobolin G, crude extracts containing ophiobolin A, and pure ophiobolin A seem to have similarities in their biological activities. The occurrence of potentially pathogenic and toxin-producingA. calidoustusstrains could also be related to indoor air quality.
Toxins2019,11, 683 11 of 16
5. Materials and Methods
5.1. Experimental Design
Mold colonies were cultivated from settled dust and collected 1.5 to 2 m above the ground level at a university office, in which the occupants complained about indoor air-related problems. A total of 29 colonies displaying unique colony morphology in daylight were screened for toxicity using two complementary rapid screening tests. The tests measured (a) the toxins affecting cellular energy metabolism, mitochondria, and ion homeostasis as the inhibition of motility of boar spermatozoa (BSMI) [18,19,27] and (b) toxins affecting macromolecular synthesis and cytostatic activity as the inhibition of proliferation of a somatic cell line, PK-15 (ICP) [16]. The toxicity tests performed with the colonies from the primary isolation plates (Figure 1) were repeated with pure, single-spore cultures. The most toxic colonies (n=4) and the numerically dominant toxic colonies (n=9) were pure-cultured into single-spored fungal strains and their biomasses extracted for ethanol-soluble substances. The toxicity profiles in the four bioassays measuring sublethal, lethal, and cytostatic toxicity were elucidated. The assays measured sublethal toxicity in exposing resting boar sperm as BSMI after exposure for 30 min (rapid inhibition) and one day (slow inhibition), lethal toxicity as sperm membrane integrity damage (SMID), and cytostatic toxicity as ICP of PK-15 cells. The test protocols for the BSMI and SMID assays exposing the resting boar sperm cells are described in [17,18] and in [17] for the ICP assay. A randomly chosen colony, MH34, of the four most toxic colonies was identified at the species level, and the toxicity profiles were compared with the ethanol extracts of the selected indoor molds, commercial mycotoxins, and mycotoxins purified by the present authors. Toxic substances were purified with HPLC and identified by LC-MS.
5.2. Cultivation of Mold Colonies
The settled dust samples, c. 10 mg, were seeded on plates containing a malt extract medium (15 g malt extract from Sharlab, Barcelona, Spain and 12 g of agar from Amresco, Dallas, USA, in 500 mL of H2O) or a tryptic soy extract agar (Sharlab, Barcelona, Spain, 20 g L−1in 500 mL) medium without antibiotics or fungicides and were sealed at the site of sampling with gas-permeable adhesive tape.
Colonies were inspected and counted after one, two, and three weeks of culturing at 23±2◦C. After three weeks of incubation, the colonies on the primary isolation plates (not yet single-spored) were numbered and screened for toxicity.
The ability to grow at 37◦C was tested on malt extract agar plates sealed with gas-permeable tape, which were then incubated for five days. The strainsTrichoderma longibrachiatumTHG andT. atroviride H1/226 were used as positive and negative controls, respectively [17]
5.3. Rapid Screening Tests with Ex Vivo and In Vitro Assays
Rapid screening tests applied directly to the primary sampling plates where the dust had been cultivated were designed for mycotoxin-producing indoor molds. Settled dust samples were cultivated on malt extract agar without added antibiotics. The plates were sealed with gas-permeable tape and incubated for four weeks at room temperature. The biomass of 10 to 20 mg of the fungal colonies was dispersed in 0.2 mL ethanol in a sealed glass vial and heated in a water bath of 80◦C for 10 min.
The obtained biomass dispersals were used for exposing boar spermatozoa (BSMI assay) and porcine kidney cells PK-15 (ICP assay) in ex vivo and in vitro bioassays, respectively. A colony was considered exhibiting sublethal toxicity in the BSMI assay if≤2.5 mg mL−1of the biomass inhibited sperm motility after 30 min and/or one day of exposure. Cytostatic toxicity was indicated if≤5 mg mL−1 of the biomass inhibited the cell proliferation (ICP assay) of the PK-15 cells exposed for one to two days [13].
The toxicity assays performed with ethanol extract from pure fungal cultures were performed using porcine cells (sperms, somatic cell lines) as indicators according to [14–16,19,20].
Toxins2019,11, 683 12 of 16
5.4. Toxicity Assays for Ethanol-Soluble Dry Substances Extracted from a Plate-Grown Fungal Biomass and Pure Mycotoxins
The plate-grown biomass of the fungal pure cultures (100–300 mg) was extracted with ethanol, as described in [18]. The toxicity assays, the BSMI (boar sperm motility inhibition) assay after exposures of 30 min (rapid inhibition) and one day (slow inhibition), SMID (sperm membrane integrity damage) assay, and ICP (inhibition of cell proliferation) assay are all described in [17,18].
Cell death recorded in PK-15 cells grown as monolayers for 48 h was measured after 24 h of toxin exposure as the permeability to propidium iodide and the inhibition of glucose consumption according to [11,12].
5.5. Calculation of EC50, the Half Maximal Effective Concentrations for the Ethanol Dry Substances and Pure Mycotoxins in the BSMI, SMID, and ICP Assays
In the BSMI assay, the EC50concentration for motility inhibition was concluded to be the toxin concentration closest to that provoking a>50% decrease in the number of sperm cells exhibiting rapid tail beating (compared to the sperm cells in the solvent control as described in [16,17]). Rapid tail beating is visible under the microscope as an artefact; sperm cells with rapidly beating tails look like sperm cells having two tails, and these two-tailed cells may be counted and their proportion of the total number of sperm cells estimated [16].
The EC50was calculated from the equation of the straight line between EC50-40and EC80-90: Y= DY/DX 9 X+C where Y is the motility closest to 50% of the motility of the solvent control, X is the EC50concentration, and C is a constant between 100% and 60%. All tests were run in triplicate and differences between the replicate tests were within one dilution step (twofold). The sperm assays were calibrated with triclosan and valinomycin.
In the SMID assay, the EC50 (half maximal effective concentration) corresponded to the concentration causing a 50% decrease in mortality compared to the positive dead control (=100%
mortality). The lower the EC50value, the more toxic the substance. The assay was calibrated with triclosan in three parallel tests, and the EC50was 2µg mL−1(SD±30%). In the SMID assay, mortality (permeability to PI) in the exposed sperm cells samples was calculated using the following equation [17]:
Loss of viability of sample(%) = Fluorescence of sample − background
Fluorescence of dead control − background×100
In the ICP assay, the EC50was calculated as follows as described in [13]: The inhibition of cell proliferation was inspected with a phase contrast microscope. EC100for the inhibition of proliferation was easy to observe due to the absence of intact cells in the well. EC0was also easy to observe as there was an intact cell monolayer indistinguishable from the control. With the microscope, determining EC50was more difficult. To achieve a more exact value for EC50, the inhibition ability of resazurin reduction was investigated. Resazurin is a nontoxic, cell-permeable, redox-sensitive phenoxazine [28].
Therefore, after treatment, the plates were incubated for three days at 37◦C, 10µL resazurin (Sigma Chemical Co., St. Louis, MO, USA) (400µg mL−1in normal saline) was added to the wells, and the plates were incubated again for two hours under the same conditions. Then, the plates were analyzed by a microtiter plate reader (Fluoroskan Ascent, Thermo Scientific, Vantaa, Finland) at the excitation and emission wavelengths of 544 nm and 590 nm, respectively. The toxicity was expressed as the lowest concentrations in which the ratio of the living cells was less than 50% (EC50). The cell toxicity assays were repeated three times. This EC50fitted between EC100and EC0observed with the microscope;
the maximal difference between the two methods was one dilution step. The assay was calibrated with triclosan (Sigma Chemical Co., St. Louis, MO, USA), and the EC50in the 10 parallel tests was 9.4µg mL−1(SD±3.4).
Toxins2019,11, 683 13 of 16
5.6. Fluorescence Microscopy
PK-15 cells grown into a monolayer for 48 h were exposed for 18 h to the crude extract of MH 34, and then triple-stained with the viability stains Hoechst 33342+propidium iodide+calcein–AM, as described in [29–31] and inspected with a fluorescence microscope (Nikon Eclipse E600; Nikon Corporation, Tokyo Japan). The calcein-AM-stained cells with intact and/or blebbing plasma membranes exhibited green fluorescence, while the propidium-iodide-dyed cells with damaged plasma membranes exhibited red fluorescence after inspection with filters of 450 to 490 nm (excitation), band-pass and 520 nm emission, long-pass. The Hoechst-33342-stained, fragmented apoptotic nuclei were blue and the propidium-iodide-stained necrotic nuclei were red (dead) after inspection with filters of 330 to 380 (excitation) and 480 nm (emission).
5.7. Identification of the Fungal Strains
The reference strainsA. westerdijkiaePP2 andA. versicolorSL/3 were identified at DSMZ (Deutche Samlung vor Mikroorganismen und Zellkulturen) in 2004 and 2008, respectively. Aspergillus calidoustus MH34, Trichoderma atroviride Tri335, and Chaetomium globosum HS5 were identified based on the amplification of the internal transcribed spacer (ITS1–5.8S rDNA–ITS2) region of the ribosomal RNA gene cluster with primers ITS1 (50-TCCGTAGGTGAACCTGCGG-30) and ITS4 (50-TCCTCCGCTTATTGATATGC-30) [32] based on [33]. TheA. calidoustusMH34 ITS sequence is deposited in GenBank (KM853016.1). Although ITS sequence analysis alone is not able to discriminate between the speciesA. calidoustusandA. pseudodeflectus, the presence of Hülle cells clearly confirms the ITS-based diagnosis of strain MH34 asA. calidoustus, asA. pseudodeflectusis not forming any Hülle cells [33].
5.8. Purification of Ophiobolin A
The purification of ophiobolin A was carried out according to Bencsik et al. [13]. Bipolaris oryzaestrain SZMC 13003 was cultivated in a potato dextrose broth (PDB) medium at 28◦C. After 12 days of cultivation, fungal cultures were filtered using a cheese cloth filter, and the fermented broth was extracted with an equal volume of ethyl acetate. The crude extract was fractionated by a semipreparative normal-phase high-performance liquid chromatography (HPLC) system using (ethylacetate) EtOAc/n-hexane 1:1 at a flow rate of 2 mL min−1. Further purification was carried out with two consecutive semipreparative RP-HPLC separations. The applied mobile phases were (water:acetonitrile) H2O:MeCN 3:7 (3 mL min−1) and H2O:MeCN 5:5 (3 mL min−1). During the purification procedure, the purity of ophiobolin A was tested using analytical HPLC measurements at a wavelength of 230 nm.
5.9. HPLC-MS Analysis and Identification of Mycotoxins in the Fungal Extracts
The biomass (400 mg±50 mg) ofA. calidoustusMH34 was harvested from a malt extract agar plate grown at room temperature for 14 days. The fungal toxins were extracted from the collected biomass with ethanol, and the ethanolic extract was fractionated by high-performance liquid chromatography (HPLC). The columns used for the HPLC fractionation were reversed phase C18 column Atlantis T3 (100 Å, 3µm, 4.6 mm×150 mm), and for the HPLC-MS analysis, reversed phase C18 SunFire (100 Å, 2.5µm, 2.1 mm×50 mm) (Waters, Milford, MA, USA). The HPLC-electrospray ionization ion trap mass spectrometry analysis (ESI-IT-MS) was performed using an MSD-Trap-XCT plus ion trap mass spectrometer at a mass range ofm/z50–2000 equipped with an Agilent ESI source and Agilent 1100 series LC (Agilent Technologies, Wilmington, DE, USA). HPLC-MS analysis was performed using an isocratic elution. The eluents were 0.1% formic acid in water (A) and acetonitrile (B). The separation of the extract ofA. calidoustuswas performed using 75% B for 10 min at a flow rate of 0.2 mL min−1. The fractions were tested for toxicity as described in [34].
Toxins2019,11, 683 14 of 16
5.10. Reagents and Supplies
5,50,6,60-Tetrachloro-1,10,3,300-tetraethylbenzimidazolyl-carbocyanine iodide (JC-1, 3520-43-2, MW 65223), propidium iodide (PI, 25535-16-4, MW 66839), calcein-AM (148504-34-1, MW 99486), and Hoechst 33342 (23491-52-3, MW 61599) were from Invitrogen (Carlsbad, CA, USA). The purification of ophiobolin A, as well as stephacidin B and avrainvillamide, is described in [16] and [14], respectively.
Alamethicin A4665 (Trichoderma arundinaceum) (27061-78-5, a mixture of alamethicin F50 peptaibols, MW 1962, 1976, 1976, and 1990), sterigmatocystin, and ochratoxin A were obtained from the Sigma-Aldrich Corporation (St. Louis, MO, USA). Malt extract and tryptic soy agar were from Scharlab (Barcelona, Spain). The other chemicals were of an analytical grade and purchased from local suppliers.
Author Contributions:Conceptualization, M.J.S. and M.A.A.; Data curation, M.J.S., O.B., R.M., L.K., A.S. and M.A.A.; Formal analysis, M.J.S., R.M. and M.A.A.; Funding acquisition, H.S. and J.K.; Investigation, M.J.S., T.M., O.B., R.M., A.S. and M.A.A.; Methodology, M.J.S., R.M. and M.A.A.; Project administration, H.S. and J.K.;
Supervision, H.S. and J.K.; Validation, M.J.S., T.M., R.M., L.K. and M.A.A.; Visualization, M.J.S. and M.A.A.;
Writing–original draft, M.J.S., T.M., O.B., R.M., L.K., A.S. and M.A.A.; Writing–review & editing, M.J.S., T.M., O.B., R.M., L.K., A.S., M.A.A. and H.S.
Funding:This research was funded by the Academy of Finland (TOXICPM grant number 289161) and the Finnish Work Environmental Fund (grant number 117101). L.K. is grantee of the János Bolyai (Hungarian Academy of Science) and Bolyai Plus (New National Excellence Programme, Ministry of Human Resources, Hungary) research scholarships.
Acknowledgments:The authors warmly thank Maria Hautaniemi at the Finnish Food Safety Authority (EVIRA) for providing the porcine kidney cell line PK-15.
Conflicts of Interest: The authors declare no conflict of interest. The funders had no role in the design of the study; in the collection, analyses, or interpretation of data; in the writing of the manuscript, or in the decision to publish the result.
References
1. Samson, R.; Hoekstra, E.; Frisvad, J. (Eds.)Introduction to Food and Airborne Fungi, 7th ed.; CentraalbBureau voor Schimmelcultures: Utrecht, The Netherlands, 2004; pp. 483–484.
2. Slack, G.J.; Puniani, E.; Frisvad, J.C.; Samson, R.A.; Miller, J.D. Secondary metabolites fromEurotiumspecies, Aspergillus calidoustusandA. insuetuscommon in Canadian homes with a review of their chemistry and biological activity.Mycol. Res. 2009,113, 480–490. [CrossRef] [PubMed]
3. Samson, R.A.; Varga, J.; Meijer, M.; Frisvad, J.C. New taxa inAspergillussection Usti.Stud. Mycol.2011,69, 81–97. [CrossRef] [PubMed]
4. Hageskal, G.; Kristensen, R.; Fristad, R.F.; Skaar, I. Emerging pathogenAspergillus calidoustuscolonizes water distribution systems.Med. Mycol.2011,49, 588–593. [CrossRef] [PubMed]
5. Nielsen, K.F.; Gravesen, S.; Nielsen, P.A.; Andersen, B.; Thrane, U.; Frisvad, J.C. Production of mycotoxins on artificially and naturally infested building materials.Mycopathologia1999,145, 43–56. [CrossRef]
6. Nielsen, K.F.; Holm, G.; Uttrup, L.P.; Nielsen, P.A. Mold growth on building materials under low water activities. Influence of humidity and temperature on fungal growth and secondary metabolism. Int.
Biodeterior. Biodegrad.2004,54, 325–336. [CrossRef]
7. Varga, J.; Houbraken, J.; Van der Lee, H.A.L.; Verweij, P.E.; Samson, R.A.Aspergillus calidoustussp. nov., causative agent of human infections previously assigned toAspergillus ustus.Eukaryot. Cell2008,7, 630–638.
[CrossRef]
8. Wang, Q.X.; Yang, J.L.; Qi, Q.Y.; Bao, L.; Yang, X.L.; Liu, M.M.; Huang, P.; Zhang, L.X.; Chen, J.L.; Cai, L.;
et al. 3-Anhydro-6-hydroxy-ophiobolin A, a new sesterterpene inhibiting the growth of methicillin-resistant Staphylococcus aureusand inducing the cell death by apoptosis on K562, from the phytopathogenic fungus Bipolaris oryzae.Bioorg. Med. Chem. Lett.2013,23, 3547–3550. [CrossRef]
9. Wei, H.; Itoh, T.; Kinoshita, M.; Nakai, Y.; Kurotaki, M.; Kobayashi, M. Cytotoxic sesterterpenes, 6-epi-ophiobolin G and 6-epi-ophiobolin N, from marine derived fungusEmericella variecolorGF10.Tetrahedron 2004,60, 6015–6019. [CrossRef]