Komorowicz and Krasimir Kolev
Hoell, Attila Bóta, Zoltán Varga, Erzsébet László Szabó, Michael Krumrey, Armin Colin Longstaff, Imre Varjú, Péter Sótonyi,
DNA, and Histones
Resistance of Clots Containing Fibrin, Mechanical Stability and Fibrinolytic
doi: 10.1074/jbc.M112.404301 originally published online January 4, 2013 2013, 288:6946-6956.
J. Biol. Chem.
10.1074/jbc.M112.404301 Access the most updated version of this article at doi:
. JBC Affinity Sites Find articles, minireviews, Reflections and Classics on similar topics on the
Alerts:
When a correction for this article is posted
•
When this article is cited
•
to choose from all of JBC's e-mail alerts Click here
Supplemental material:
http://www.jbc.org/content/suppl/2013/01/04/M112.404301.DC1.html
http://www.jbc.org/content/288/10/6946.full.html#ref-list-1
This article cites 36 references, 9 of which can be accessed free at
at SEMMELWEIS UNIV OF MEDICINE on November 11, 2014http://www.jbc.org/Downloaded from at SEMMELWEIS UNIV OF MEDICINE on November 11, 2014http://www.jbc.org/Downloaded from
Mechanical Stability and Fibrinolytic Resistance of Clots Containing Fibrin, DNA, and Histones *□S
Received for publication, August 8, 2012, and in revised form, January 3, 2013Published, JBC Papers in Press, January 4, 2013, DOI 10.1074/jbc.M112.404301
Colin Longstaff‡1, Imre Varjú§, Péter Sótonyi¶, László Szabó储, Michael Krumrey**, Armin Hoell‡‡, Attila Bóta§§, Zoltán Varga§§, Erzsébet Komorowicz§, and Krasimir Kolev§
From‡Biotherapeutics, Haemostasis Section, National Institute for Biological Standards and Control, South Mimms, Potters Bar EN6 3QG, United Kingdom,§Department of Medical Biochemistry, Semmelweis University, 1094 Budapest, Hungary,¶Department of Vascular Surgery, Semmelweis University, 1122 Budapest, Hungary,储Institute of Materials and Environmental Chemistry and
§§Department of Biological Nanochemsitry, Institute of Molecular Pharmacology, Research Centre for Natural Sciences, Hungarian Academy of Sciences, 1025 Budapest, Hungary,**Physikalisch-Technische Bundesanstalt (PTB),
D-10587 Berlin, Germany, and‡‡Helmholtz-Zentrum Berlin (HZB), D-14109 Berlin, Germany
Background:Neutrophil extracellular traps (NETs) composed of DNA and proteins form a scaffold in thrombi, supple- menting the fibrin matrix.
Results:DNA and histones modify the structure of fibrin and render it resistant to mechanical and enzymatic destruction.
Conclusion:NET components are essential factors in thrombus stability.
Significance:Therapeutic strategies could be optimized to enhance fibrinolysis in clots containing DNA and histones.
Neutrophil extracellular traps are networks of DNA and asso- ciated proteins produced by nucleosome release from activated neutrophils in response to infection stimuli and have recently been identified as key mediators between innate immunity, inflammation, and hemostasis. The interaction of DNA and his- tones with a number of hemostatic factors has been shown to promote clotting and is associated with increased thrombosis, but little is known about the effects of DNA and histones on the regulation of fibrin stability and fibrinolysis. Here we demon- strate that the addition of histone-DNA complexes to fibrin results in thicker fibers (increase in median diameter from 84 to 123 nm according to scanning electron microscopy data) accompanied by improved stability and rigidity (the critical shear stress causing loss of fibrin viscosity increases from 150 to 376 Pa whereas the storage modulus of the gel increases from 62 to 82 pascals according to oscillation rheometric data). The effects of DNA and histones alone are subtle and suggest that histones affect clot structure whereas DNA changes the way clots are lysed. The combination of histones ⴙDNA signifi- cantly prolongs clot lysis. Isothermal titration and confocal microscopy studies suggest that histones and DNA bind large fibrin degradation products with 191 and 136 nMdissociation constants, respectively, interactions that inhibit clot lysis. Hep- arin, which is known to interfere with the formation of neutro- phil extracellular traps, appears to prolong lysis time at a con- centration favoring ternary histone-DNA-heparin complex formation, and DNase effectively promotes clot lysis in combi- nation with tissue plasminogen activator.
Neutrophil extracellular traps (NETs)2are networks of DNA decorated with histones and other proteins, proteases, and other antimicrobial factors (1). They are produced when neu- trophils, basophils, or mast cells release nucleosomes after stimulation by inflammatory cytokines or LPS for example (1) or by interaction with platelets after stimulation of platelet toll- like receptors 4 and 2 by microbial structures (2, 3). It is pro- posed that NET formation is the first line of defense of the innate immune system, providing an effective way of trapping pathogenic microbes and removing them from the circulation (4).
The DNA and histones of NETs provide a scaffold for cell localization (including neutrophils and red blood cells), platelet aggregation, and activation that serves to promote coagulation and thrombosis (5). Thus, NETs are a focus of significant cross- talk between innate immunity, inflammation, and hemostasis, and there are many points of contact including bidirectional interactions with platelets, inflammatory cytokines (IL-8), fibrinogen, fibronectin, von Willebrand factor, tissue factor pathway inhibitor, protein C, thrombomodulin, factor XII, and neutrophil-derived serine proteases (3– 6). Histones H3 and H4 have been identified as critical players and mediators of damage able to stimulate phosphatidylserine exposure and factor Va expression on platelets and interact with polyphosphates to promote clotting even in the absence of factor XII (3). Histones may come from NETs or dying cells and are implicated in the progression of sepsis. Stimulation of coagulation by NETs can result in unwanted thrombosis (7), and infection is a common event in the development of deep vein thrombosis (8, 9). Tar- geting the release of nucleosomes, development of NETs, and availability of circulating histones could be a strategy for pre-
*This work was supported by Wellcome Trust Grant 083174, Hungarian Sci- entific Research Fund Grants OTKA 75430 and 83023, and German Aca- demic Exchange Service Grant DAAD A/12/01760.
Author’s Choice—Final version full access.
□S This article contains asupplemental table and Videos 1 and 2.
1To whom correspondence should be addressed: Biotherapeutics Group, National Inst. for Biological Standards and Control, South Mimms, Herts EN6 3QG, UK. E-mail: colin.longstaff@nibsc.hpa.org.uk.
2The abbreviations used are: NET, neutrophil extracellular trap; tPA, tissue plasminogen activator; SEM, scanning electron microscope; ITC, isother- mal titration calorimetry; FDP, fibrin degradation product; SAXS, small angle x-ray scattering.
at SEMMELWEIS UNIV OF MEDICINE on November 11, 2014http://www.jbc.org/Downloaded from
vention or therapeutic intervention for venous thromboembo- lism, sepsis, and other diseases involving cell death and lysis.
However, although there are extensive studies on the inter- action between NET components and coagulation, little is known about the effects of DNA and histones on fibrinolysis.
Bacterial infection byStreptococcusandStaphylococcusspp. is accompanied by secretion of plasminogen-binding and activat- ing proteins as the bacteria hijack the host fibrinolytic system (10, 11). Streptokinase is a classic example of a plasminogen activator from streptococci, and staphylokinase is produced by staphylococci. Interestingly, streptococci also release a DNase, streptodornase, which is linked to bacterial virulence (12), suggesting that streptokinase and streptodornase can work together to break down fibrin clots and NETs and promote bacterial dissemination. DNases have been shown to degrade NETs and prevent platelet adhesion and activation (5) and to prevent thrombosis inin vivomodels (2, 13).
Systemic infection triggers coagulation and an immune response involving neutrophils and NETs that work together to restrict the movement of microorganisms within the vascula- ture and at the same time promote thrombin generation and thrombosis. As suggested previously (5), it is important to understand the effects that DNA and histones might have on fibrin structure and mechanical properties and the implications for fibrinolysis, thrombus breakdown, and embolism. These topics are the subject of the current study with the main focus on the endogenous fibrinolysis system regulated by tissue plas- minogen activator (tPA).
EXPERIMENTAL PROCEDURES
Generation and Purification of tPA Variants and Other Activators—tPA was modified to express a C-terminal fusion of enhanced green fluorescent protein using pFastBac-tPA (and derivatives) as described previously (14).
Fibrinolysis Kinetics Methods—Plasminogen activation and fibrin lysis assays were performed as described previously (15) to measure the effect of DNA and histones on clot formation and lysis in microtiter plates by mixing equal volumes of solu- tions of (a) thrombin, tPA, and DNA (where present) with (b) fibrinogen, plasminogen, and histones (where present) to give a 100-l reaction mixture of 25 nMthrombin, 70 pMtPA, 8M fibrinogen, and ranges of DNA and histone concentrations.
Where heparin was present in reaction mixtures (over a range of concentrations shown under “Results”), it was added first to reaction wells followed by solution a and then solution b.
Fibrinogen and DNA (calf thymus) were from Calbiochem;
plasminogen was from Hyphen-Biomed, Neuville-sur-Oise, France; histones (calf thymus, type IIIS) were from Sigma-Al- drich; and␣-thrombin (01/580), tPA (98/714), and heparin (07/
328) were from the National Institute for Biological Standards and Control, South Mimms, UK. Selectable endpoints for anal- ysis (such as clotting maximum absorbance, time to clotting maximum absorbance, time to 50% lysis, time to 100% lysis, and time to 50% lysis from clotting maximum) were extracted from absorbanceversustime data and analyzed using bespoke soft- ware written using the free statistical software package R (16) (script available on request). tPA activity was also determined in tubes by mixing 200l of a solution of histones (50g/ml),
thrombin (30 nM), and tPA with 1.0 ml of fibrinogen (1.3 mg/ml), plasminogen (200 nM), and DNA (70g/ml) (final con- centrations given) and monitoring the collapse of clots by release of bubbles (17). tPA was present at 0.4, 0.2, and 0.1 nMso potency relative to conditions without DNA and histones and 95% confidence limits could be calculated using parallel line bioassay methods (17). Time lapse videos of lysis were prepared under the same conditions with 0.2 nMtPA by following the reactions for 2–3 h. DNase I was from Thermo Scientific, Rock- ford, IL.
Scanning Electron Microscope (SEM) Imaging of Thrombi and Fibrin—Immediately (within 5 min) after surgery or the preparation of fibrin, 5⫻5⫻10-mm pieces of thrombi or fibrin clots of 100-l volume were placed into 10 ml of 100 mM
sodium cacodylate, pH 7.2 buffer for 24 h at 4 °C. Following repeated washes with the same buffer, samples were fixed in 1%
(v/v) glutaraldehyde for 16 h. The fixed samples were dehy- drated in a series of ethanol dilutions (20 –96% (v/v)), a 1:1 mixture of 96% (v/v) ethanol/acetone, and pure acetone fol- lowed by critical point drying with CO2in an E3000 Critical Point Drying Apparatus (Quorum Technologies, Newhaven, UK). The specimens were mounted on adhesive carbon discs and sputter-coated with gold in an SC7620 Sputter Coater (Quorum Technologies), and images were taken with scanning electron microscope EVO40 (Carl Zeiss GmbH, Oberkochen, Germany).
Immunohistochemistry—After surgery, the removed throm- bus samples were frozen immediately at⫺70 °C and stored until examination. Cryosections (6-m thickness) of thrombi were attached to lysine-coated slides. Sections were fixed in acetone at 4 °C for 10 min and air-dried for 5 min at room temperature followed by incubation in 100 mMsodium phos- phate, 100 mMNaCl, pH 7.5 buffer (PBS) containing 5% (w/v) bovine serum albumin to eliminate nonspecific binding of anti- bodies. Subsequently, slides were washed in PBS three times, and DNA was stained with the dimeric cyanine nucleic acid dye TOTO-3威(T-3604, Invitrogen; excitation, 640 nm, emission, 660 nm) at 1:5000 dilution with PBS containing 10% glycerol and 0.02% Tween 20 for 15 min followed by three washes in 50 mMTris-HCl, 100 mMNaCl, 0.02% (w/v) NaN3, pH 7.4 buffer (TBS). For double immunostaining, the sections were incu- bated with 2g/ml mouse monoclonal anti-human fibrin anti- body (ADI313, American Diagnostica, Pfungstadt, Germany) and 2g/ml rabbit anti-human histone H1 antibody (Sigma- Aldrich) in TBS. Following washing with TBS, sections were treated with Alexa Fluor威488 (excitation, 495 nm; emission, 519 nm) goat anti-mouse immunoglobulin antibody (Invitro- gen) at 1:100 dilution and Alexa Fluor 546 (excitation, 556 nm;
emission, 573 nm) goat anti-rabbit immunoglobulin antibody (Invitrogen) at 1:100 dilution. Following three washes, glass coverslips were affixed over a drop of 50% (v/v) glycerol in TBS.
Confocal fluorescence images were taken using a Zeiss LSM510 confocal laser scanning microscope equipped with a 20⫻1.4 objective (Carl Zeiss GmbH, Jena, Germany) at 488-nm excita- tion laser line (20% intensity) and emission in the 500 –530-nm wavelength range, 543-nm excitation laser line (100% intensity) and emission in the 565– 615-nm wavelength range, 633-nm
at SEMMELWEIS UNIV OF MEDICINE on November 11, 2014http://www.jbc.org/Downloaded from
excitation laser line (100% intensity) and emission in the range over 650-nm wavelength.
Isothermal Titration Calorimetry (ITC)—Enthalpy changes accompanying the interaction of DNA and proteins (fibrin deg- radation products (FDPs), fibrinogen, histones, and plasmino- gen) were measured using an isothermal titration method on a VP-ITC microcalorimeter (MicroCal Inc., Northampton, MA).
The proteins were injected in a series of 25 aliquots (10l each) into the cell of the calorimeter containing DNA or protein, and the heat increment of each addition was recorded by the instru- ment. Dilutions of protein into buffer were carried out in a separate series of injections, and these heat increments were subtracted from the raw data. Heat data for the interactions were evaluated according to the single site algorithm with ITC Data Analysis version 7.0 software (MicroCal Inc.). For the cal- culation of equilibrium parameters, the mass concentration of DNA was converted to molar concentration of nucleotides using an average molecular mass of 500 Da. The molar concen- tration of the FDPs of 150 kDa or larger was estimated from the mass concentration and densitometric data of the polyacryl- amide gel electrophoretic (PAGE) pattern of the FDPs used for the binding experiments.
Preparation of FDPs—Clotting of fibrinogen (human, plas- minogen-depleted; Calbiochem) and fibrinolysis were initiated simultaneously with thrombin (90 nM) and plasmin (5 nM). The final concentration of fibrinogen was 6Mfor preparation of extensively degraded products of fibrin digestion and 12Mfor partial digestion and generation of large FDPs. Plasmin action was stopped by the addition of 4-(2-aminoethyl)benzenesulfo- nyl fluoride (Pefabloc威from Roche Applied Science) at a final concentration of 0.05 mMimmediately after a steel ball placed on the surface of the clot reached the bottom of the tube (⬃16 –18 h after the start of lysis). For more extensive degrada- tion Pefabloc was added 2– 4 h later when the visible fibrin gel had totally disappeared. The fluid phases were withdrawn from each of the tubes after centrifugation at 6000⫻gfor 5 min, and the total protein contents were determined from the values of absorbance of the supernatants at 280 nm (A280of 1.6 corre- sponds to 1 g/liter non-clottable fibrin degradation products measured under identical conditions (18)). The supernatant was subjected to SDS electrophoresis on a 4 –15% polyacryl- amide gel under non-reducing and reducing conditions and silver-stained. Concentrations of large degradation fragments (over 150 kDa) were calculated as a fraction of total protein based on quantitative gel analysis using SigmaGel software (Jandel Scientific, Erkrath, Germany).
Confocal Microscopy Imaging—Fibrin clots were prepared from 6Mfibrinogen, 2% of which was Alexa Fluor 546-conju- gated fibrinogen (Invitrogen), and 1.5Mplasminogen clotted with 16 nMthrombin for 30 min at room temperature in sterile, uncoated Ibidi VI 0.4-Slides (Ibidi GmbH, Martinsried, Ger- many). In certain cases, 50 or 100g/ml DNA (human; isolated from granulocytes) and/or 3.45Mhistone IIIS (from calf thy- mus; Sigma-Aldrich) was also added to the mixture. Thereafter, 4 g/ml tPA-GFP was added to the edge of the clot, and the fluorescence (excitation wavelength, 488 nm; emission wave- length, 525 nm for tPA-GFP detection; excitation wavelength, 543 nm; emission wavelength, 575 nm for Alexa Fluor 546-
fibrinogen detection) was monitored with Confocal Laser Scan- ning System LSM510 (Carl Zeiss GmbH, Jena, Germany) taking sequential images of the fluid-fibrin interface at a distance of
⬃50m from the glass surface with identical exposures and laser intensities using a Plan-Neofluar⫻20/0.5 objective.
Preparation of Neutrophil DNA—Neutrophil granulocytes were isolated from the buffy coat fraction of human blood (Hungarian Blood Supply Service, Budapest, Hungary) (19) according to a procedure described previously (20). Following cell lysis, DNA was extracted using 25:24:1 phorbol/chloro- form/isoamyl alcohol reagent (Sigma-Aldrich); precipitated out of the water phase in 0.3Msodium acetate, pH 5.2 buffer and 96% (v/v) ethanol; and resuspended in 25 mMNaH2PO4/ Na2HPO4, pH 7.4 buffer containing 75 mMNaCl. The ratio of absorbance at 260 and 280 nm was 1.88 –1.95 in the final prep- aration. The concentration of DNA was determined from absorbance at 260 nm using calf thymus DNA (Calbiochem) as a reference.
Evaluation of Fibrin Rigidity—140l of 10 mg/ml fibrinogen was premixed with 60 or 120l of 0.5 mg/ml DNA and supple- mented with 10 mMHEPES, pH 7.4 buffer containing 150 mM
NaCl to a 500-l final volume. Clotting was initiated with 50l of 100 nMthrombin added to 410l of fibrinogen solution, and 410l of the clotting mixture was transferred to the plate of the HAAKE RheoStress 1 oscillation rheometer (Thermo Scien- tific, Karlsruhe, Germany) thermostatted at 37 °C. The cone (titanium, 2° angle, 35-mm diameter) of the rheometer was brought to the gap position, and a shear strain (␥) of 0.015 was imposed exactly at 2 min after the addition of thrombin. Mea- surements of storage modulus (G⬘) and loss modulus (G⬙) were taken at 1 Hz in the course of 15 min with HAAKE RheoWin data manager software v. 3.50.0012 (Thermo Scientific, Karlsruhe, Germany) (21). Following this 15-min clotting phase, determination of the flow limit of fibrin gels was per- formed in the same samples by increasing the applied shear stress () from 0.01 to 500.0 pascals stepwise in 150 s, and the resulting strain measured was used for calculation of the viscos- ity modulus (the critical shear stress0determined by extrapo- lation of the decline in viscosity to 0 that was used as an indica- tor of the gel/fluid transition in the fibrin structure).
Structural Characterization of Fibrin by Small Angle X-ray Scattering (SAXS)—Fibrin samples with the same composition as those used for the evaluation of rigidity and additional sam- ples containing unfractionated heparin were also examined by SAXS measurements performed on the four-crystal mono- chromator beamline of Physikalisch-Technische Bundesanstalt (PTB) (Berlin, Germany) supplemented by the SAXS setup of Helmholtz-Zentrum Berlin (HZB German Patent DE 2006 029 449) at the synchrotron radiation facility BESSY II (HZB, Berlin, Germany) (22). The samples were filled into glass capillaries with 1.0-mm diameter. The energy of the incoming x-ray beam was 7 keV, and the two-dimensional scattering patterns were collected with a gas-filled area detector. Measurements were performed at sample-to-detector distances of 1.4 and 4 m to cover the range of momentum transfer ofq⫽0.7–3 nm⫺1(q⫽ 4/sinwhereis half the scattering angle andis the wave- length of the incident x-ray beam). All measurements were car- ried out at room temperature. The scattering curves were
at SEMMELWEIS UNIV OF MEDICINE on November 11, 2014http://www.jbc.org/Downloaded from
obtained by radial averaging of the two-dimensional patterns using SASREDTOOL program v. 1.2 (Sylvio Haas, Helmholtz- Zentrum, Berlin, Germany). For quantitative analysis of the scattering pattern, non-linear least square fitting of an empiri- cal model function to the scattering curves was performed using SASfit program v. 0.93.3 (Joachim Kohlbrecher and Ingo Bressler, Paul Scherrer Institute, Villigen, Switzerland) in which the peaks were approximated by Lorentzian functions and the decay trend was taken into account by different power law functions.
Statistical Procedures in Morphometric Analysis—The SEM images of fibrin were analyzed to determine the diameter of the fibrin fibers using self-designed scripts running under Image Processing Toolbox v. 7.0 of Matlab 7.10.0.499 (R2010a) (The Mathworks, Natick, MA) (23). For the diameter measurements, a grid was drawn over the image with 10 –15 equally spaced horizontal lines, and all fibers crossed by them were included in the analysis. The diameters were measured by manually placing the pointer of the Distance tool over the end points of trans- verse cross-sections of 300 fibers from each image (always per- pendicularly to the longitudinal axis of the fibers). Two images of two independent samples were analyzed in a single global procedure. The distribution of the data on fiber diameter was analyzed using an algorithm described in detail previously (23) where theoretical distributions were fitted to the empirical data sets and compared using the Kuiper test and Monte Carlo sim- ulation procedures.
RESULTS
Thrombi from Patients—Little is known about the distribu- tion of DNA and histones in thrombi found in patients. Fig. 1 shows staining for DNA and histones found in three represent- ative thrombi recovered from patients. There was variable but widespread staining for DNA. Histones were also present although not so widely dispersed and in some cases were coin- cident with fibrin aggregates. The thrombi rich in red blood cells (Fig. 1,TO) or in fibrin (GI) according to the SEM images
showed limited DNA- and histone-positive regions in contrast to the extensively stained areas in the leukocyte-rich (TJ) thrombus.
Fibrin Structure in Purified Systems—Further detailed anal- ysis of fibrin structure and the kinetics of clotting and lysis was performed using a simple model system of purified proteins.
When fibrinogen was clotted in the presence of DNA and/or histones, morphometric analysis of SEM images showed signif- icant changes in fibrin fiber diameter as summarized in Table 1.
Statistical analysis of fibrin fiber diameter was performed, and probability density distributions were calculated, for fibrin clots with no additions or with DNA and/or histones as indicated in Table 1. The general trend apparent from these studies was that DNA alone produced small effects on fibrin structure, whereas in the presence of histones or DNA⫹histones, the fibrin fiber thickness increased.
The SEM data characterize the protein content of individual fibrin fibers, but this technique cannot resolve nanometer-scale structure of fibrin in its natural hydrated state. Small angle x-ray and neutron scattering proved to be a powerful tool in the characterization of the longitudinal arrangement of the mono- mers in the protofibrils and the lateral alignment of protofibrils in fibers (24). The general decay trend of the scattering curves (Fig. 2) reflects the fractal structure of the fibrin clot, and its effect can be modeled as a background signal with empirical power law functions in the form ofC0⫹C4⫻q⫺␣for clots containing fibrin, DNA, and heparin or with an additional func- tion with a fixed exponent of⫺1 for samples with histones (supplemental table). The peaks arising above this background reflect the longitudinal and cross-sectional alignment of fibrin monomers. A small but sharp peak in pure fibrin at aqvalue of
⬃0.285 nm⫺1(Fig. 2 and supplemental table, Peak 2) corre- sponds to a longitudinal periodicity ofd ⫽2/q⬘ ⫽ 22 nm, which is in agreement with earlier SAXS studies (24) and a little bit lower than the values reported for dried samples in trans- mission electron microscopy investigations (25). This peak can- not be resolved in fibrin containing DNA or heparin, indicating that these additives disrupt the regular longitudinal alignment of the monomeric building blocks. In contrast, the addition of histone does not interfere with the longitudinal periodicity, and the related scattering peak is even more pronounced (Fig. 2 and supplemental table). In pure fibrin, two additional broad scat- tering peaks can be resolved, spanning over the q ranges of
⬃0.2– 0.5 and⬃0.6 –1.5 nm⫺1(supplemental table, Peak 1 and Peak 3, respectively). The first peak can be attributed to a peri- odicity of⬃12.5–31 nm in cluster units of the fibers, whereas FIGURE 1.Fibrin, histone, and DNA content of arterial thrombi.Following
thrombectomy, thrombus samples were either frozen for immunostaining or washed, fixed, and dehydrated for SEM processing as detailed under “Exper- imental Procedures.” Sections of frozen samples were doubly immuno- stained for fibrin (green) and histone 1 (red) as well as with a DNA dye, TOTO-3 (blue). Images were taken at an original magnification of⫻20 with a confocal laser microscope. SEM images were taken from the fixed samples of the same thrombi.TO, a thrombus from popliteal artery;GI, a thrombus from infrarenal aorta aneurysm;TJ, a thrombus from femoropopliteal graft.Scale bars, 2m inSEM panelsand 50m in all other panels.
TABLE 1
Effect of DNA and histones on fiber diameter in composite fibrin net- works
SEM images of fibrin clots prepared from 6Mfibrinogen and the indicated addi- tives and clotted with 30 nMthrombin were used for the measurement of fiber diameter as described previously (14). The fiber size is reported in nm as median and bottom-top quartile values (in parentheses) of the theoretical distributions fitted to the measured diameter values (data from four SEM images with 300 measured diameters in each). H1, histone 1.
No DNA
50g/ml DNA
100g/ml DNA
No H1 84 (64–110) 94 (74–120) 92 (76–111)
50g/ml H1 119 (91–154) 122 (97–153) 114 (92–140) 100g/ml H1 108 (88–132) 122 (93–157) 123 (98–149)
at SEMMELWEIS UNIV OF MEDICINE on November 11, 2014http://www.jbc.org/Downloaded from
the second peak corresponds to a periodicity of⬃4 –10 nm characteristic for the average protofibril-to-protofibril distance based on the structural models of Yanget al.(26) and Weisel (25). Both of these broad peaks are most profoundly affected by the presence of histone (a 10-fold decrease in the area of Peak 1 and complete loss of Peak 3;supplemental table), suggesting that this additive interferes with the lateral organization of protofibrils, resulting in lower protofibril density. Earlier stud- ies (27) have shown that lower protofibril density can corre- spond to thicker fiber diameter, which is in qualitative agree- ment with our SEM results (Table 1). The structure-modifying effects of histone are preserved in the presence of DNA, but these effects are completely reversed in the quaternary system of fibrin/DNA/histone/heparin (Fig. 2).
Further evidence that DNA and histones can affect the behavior of fibrin clots was obtained from rheology studies.
Fibrin clots were formed to contain pure fibrin or 50 or 100
g/ml DNA, and the effect of added histones (300g/ml) was also investigated. The most striking differences seen in rheol- ogy parameters were in the shear stress necessary to disassem- ble the fibrin as presented in Fig. 3 where two opposing effects are clearly demonstrated. In the presence of DNA alone, the curves can be interpreted as increased sensitivity of fibrin to mechanical shear so that the shear force needed to disassemble fibrin (where viscosity approaches 0) is reduced in comparison with the situation without DNA. However, when histones are added to fibrin and to a greater extent when histones are added
to fibrin⫹DNA, the clots become more stable and resistant to shear forces. Similarly, the softening of the fibrin caused by DNA (decrease in the storage modulusG⬘; see Table 2) was reversed by the addition of histones. The changes in the loss modulusG⬙followed the trend of the storage modulusG⬘, but DNA on its own did not alter their ratio, whereas the presence of histones resulted in a relatively greater increase in the loss modulus, indicating a fibrin structure that dissipates more energy during deformation (presumably due to more signifi- cant rearrangements in fibrin protofibrils or fibers (see Ref. 21).
Fibrinolysis—tPA-catalyzed fibrinolysis was monitored in several systems to investigate the effects of DNA and histones.
Fibrin turbidity was monitored in a microtiter plate format, providing information on clotting and lysis. In agreement with the morphometric analysis, adding a range of DNA concentra- tions alone to a clot resulted in small changes in clot turbidity with minor increases in lysis times (assessed as times to 50 and 100% lysis) as shown in Fig. 4A. The apparent potency of tPA when assessed over a range of tPA concentrations (5– 40 ng/ml) is reduced by 15–20% at an optimal DNA concentration of 0.25 mg/ml. When histones were incorporated into clotting fibrin, there appeared to be more significant changes in fibrin struc- ture as shown by maximum turbidity and fibrinolysis as shown in Fig. 4B. Time to maximum absorbance changed from 1400 to 1000 s at 0.04 – 0.1 mg/ml histones, and time to 50% lysis was apparently extended from around 2000 to 4000 s as histone concentration increased up to 1.0 mg/ml. The combination of both DNA and histones had a marked effect on clot lysis pro- files as can be seen in Fig. 4Cwhere curves for 0, 0.04, 0.33, and 1 mg/ml histones all in the presence of 0.03 mg/ml DNA are shown. The typically smooth, reproducible lysis curves seen without DNA or histones or with DNA or histones individually became highly variable when DNA and histones were added together. Clots could take many hours to be lysed completely. A different method that does not rely on clot turbidity was used to assess the apparent potency of tPA under similar conditions (17). Setting tPA activity in the absence of DNA or histones to 100%, the relative activity (and 95% confidence intervals) with additions was 85.4% (78.8 –92.6%) with 70 g/ml DNA and 146.8% (138.6 –155.5%) with 50g/ml histones. The potency of tPA in the presence of both DNA and histones could not be determined as this method relies on identifying the collapse of the fibrin clot and release of trapped bubbles, but this end point FIGURE 2.Small angle x-ray scattering of fibrin clots containing 100
g/ml DNA, 300g/ml histone, 10 IU/ml heparin, or their combinations at the same concentrations.Curves are shifted vertically by the factors indi- cated at theiroriginfor better visualization.Symbolsrepresent the measured intensity values, and solid lines show the fitted empirical functions as described in thesupplemental table. Thedashed vertical lineindicates the longitudinal periodicity of about 22 nm, and thesolid vertical linesshow the boundaries of the broad peaks that characterize the lateral structure of the fibrin fibers.
FIGURE 3.Rheology studies showing the effect of DNA, histones, and DNA-histone on the critical shear stress needed to disassemble fibrin.
Curves are shown for pure fibrin (red), fibrin containing 50g/ml DNA (green), and 100g/ml DNA (magenta). The addition of histones leads to increased clot stability under sheer stress shown in the presence of 300g/ml histone (blue) and 300g/ml histone⫹100g/ml DNA (black).Pa, pascals.
at SEMMELWEIS UNIV OF MEDICINE on November 11, 2014http://www.jbc.org/Downloaded from
was highly variable and subjective in the presence of both DNA and histones, mirroring the pattern seen in Fig. 4C.
The profound effect of DNA and histones on clot lysis in this system is illustrated in Fig. 5 and the accompanying time lapse videos (supplemental Videos 1 and 2). The consistent pattern observed was that clots were initially more opaque but were lysed more quickly in the presence of 50g/ml histones (tube 2); complete lysis was slightly delayed in the presence of 70
g/ml DNA (tube 3). However, the onset of observable changes within the clot was not delayed by the presence of DNA, but the fibrin structure held together longer. Tube 5 shows a much delayed lysis in the presence of DNA⫹histones accompanied by heterogeneous clot formation and lysis. Tube 6 demon- strates how 5 units/ml DNase I could reverse some of the effects of DNA⫹histones when mixed with the forming clot (Fig. 5A) or when DNA was pretreated with DNase I for 30 min before clotting (Fig. 5B). Control clots without tPA were stable for days, indicating that lysis was not affected by contaminating proteases in the DNA or histone preparations.
To focus on the microscopic behavior of tPA during clot lysis, we used confocal microscopy in conjunction with green fluorescent protein fusions of tPA (tPA-GFP) with fluores- cently modified fibrinogen (14). Results are summarized in Fig.
6. Thetop rowshows the typical pattern (14) in which fibrinol- ysis is accompanied by the generation of fibrin aggregates near the clot surface around the lysis front that strongly bind tPA- GFP. Thesecond rowwith the addition of DNA shows some fibrin aggregate formation but strikingly a diffuse clot structure that remains behind the advancing tPA-GFP front. Thelower two rows both containing histones show further changes in binding and fibrinolysis, primarily suggesting much poorer
binding of tPA-GFP even though there is fibrin aggregate for- mation. Nevertheless, measurements of the rates of movement of the tPA-GFP front through fibrin show that although DNA may impede clot lysis, histones with or without DNA speed up the advance of the lysis front.
Binding Studies on Fibrin Degradation Products and DNA—
Given the apparent widespread distribution of DNA in thrombi noted in Fig. 1 and the suggestion from Fig. 6 that fibrin clot structure and the behavior of aggregates formed from FDPs are affected by the presence of DNA and/or histones, further stud- ies were performed to investigate the interactions between TABLE 2
Rigidity and viscoelastic parameters of composite fibrin clots
Clots containing 2.5 mg/ml fibrin and the indicated additives were prepared, and their rigidity was evaluated in an oscillation rheometer as described under “Experimental Procedures.” The values of the storage modulus (G⬘), the loss modulus (G⬙), and the loss tangent (tan␦⫽G⬙/G⬘) were determined after 15 min of clotting when they reached a plateau, whereas the critical shear stress0was determined by extrapolation of the fall in viscosity to 0 as illustrated in Fig. 3. Mean and S.D. of three measurements are shown. Pa, pascals.
Additive None
50g/ml DNA
100g/ml DNA
300g/ml histone
300g/ml histoneⴙ 100g/ml DNA
G⬘(Pa) 61.79 (13.57) 41.07 (7.29)a 32.42 (2.53)a 67.13 (5.42) 82.06 (5.81)a
G⬙(Pa) 4.03 (1.12) 2.75 (0.42)a 2.06 (0.35)a 7.70 (0.21)a 9.46 (0.38)a
G⬙/G⬘ 0.063 (0.019) 0.065 (0.014) 0.063 (0.010) 0.115 (0.008)a 0.115 (0.008)a
0(Pa) 147.9 (15.8) 79.6 (16.2)a 51.9 (5.9)a 270.4 (15.5)a 370.8 (9.3)a
a p⬍0.05 according to Kolmogorov-Smirnov test in comparison with pure fibrin.
FIGURE 4.Effect of DNA and histones included within fibrin clots on clotting and lysis profiles.Ashows the effects of 0 (circles), 0.03 (squares), 0.13 (triangles), and 0.5 mg/ml (diamonds) DNA on clotting and lysis in the absence of histones.Bshows the effects of 0 (circles), 0.04 (squares), 0.33 (triangles), and 1 mg/ml histones (diamonds) in the absence of DNA.Cshows the same range of histones as inBbut in the presence of 0.03 mg/ml DNA. In all cases, only every tenth point is shown for clarity
FIGURE 5.Effects of DNA and histones on appearance of fibrin clots and rates of lysis.Clot lysis was monitored in the presence of (final concentra- tions) 1.4 mg/ml fibrinogen and 200 nMplasminogen clotted with 30 nM
thrombin in the presence of 0.2 nMtPA. Tubes in positions1–5have the fol- lowing additions: none, 50g/ml histones, 70g/ml DNA, DNA⫹histones, DNA⫹histones⫹5 units/ml DNase I, respectively. InA, the DNase was sep- arated from the DNA until clotting was initiated, and inB, the DNA solution was pretreated with DNase I for 30 min before clotting. The reaction was monitored for 3 h during which 2000 pictures were taken to form a time lapse video (supplemental Videos 1 and 2). The images shown here were selected at the times given to illustrate significant stages of the reaction.
at SEMMELWEIS UNIV OF MEDICINE on November 11, 2014http://www.jbc.org/Downloaded from
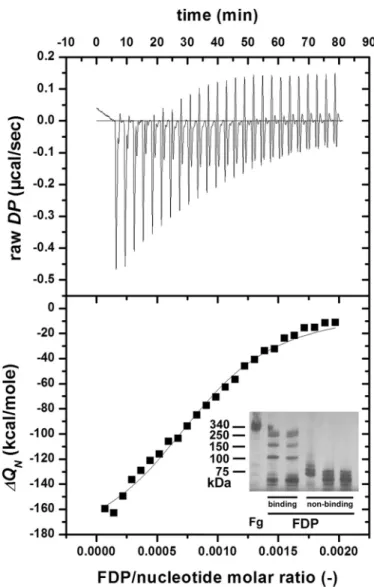
DNA and histones with fibrin degradation products using ITC.
These studies, summarized in Fig. 7, clearly showed that FDPs bind to both DNA (Kd⫽136.1 nM) and histones (Kd⫽190.7 nM) with higher affinity than with fibrinogen and plasminogen (Table 3). The size of the binding site in the DNA correlated with the size of the interacting ligand; fibrinogen required the largest binding site (2146 nucleotides), and plasminogen required the smallest binding site (682 nucleotides). Further studies (not shown) indicated that only larger FDPs with molec- ular masses⬎150 kDa demonstrated this high affinity binding, whereas smaller FDPs or fibrinogen did not.
Heparin is another highly negative charged molecule like DNA and may be able to disrupt DNA-histone complexes. The effects of adding heparin in the microtiter plate system used in Fig. 4 are shown in Fig. 8. Fig. 8Aconfirms that there is an effect of DNA and histones on fibrin structure where clots are formed with a range of histones with constant DNA because maximum absorbance (related to fibrin fiber thickness) increases with increasing histones in the presence of DNA. If heparin is pres- ent, maximum clot absorbance is reduced, and the effect of histones and DNA is nullified. The effect of heparin on fibrin lysis is more complicated in the presence of DNA and histones.
Although increasing heparin appears to have only a small effect on time to 50% lysis in the absence of histones, there is a major effect of heparin when DNA and histones are both present. The plots in Fig. 8,B–F, like those inA, are consistent with a pattern
where heparin can displace DNA from the complex with his- tones and higher concentrations of heparin are required as the histone concentration is increased. However, the obvious peak in lysis times seen at an optimum heparin concentration in Fig.
8,B–F, suggests that there is a heparin-histone-DNA ternary complex that has a major effect on clot structure and lysis.
DISCUSSION
Based on the demonstration of neutrophil elastase-specific fibrin degradation products, we have recently providedex vivo evidence for the proteolytic contribution of neutrophils to fibrinolysis in arterial thrombi (28). A different aspect of leuko- cyte functionality in thrombolysis is suggested by the presence of DNA and histones in clots from arteries revealed by the pres- ent study (Fig. 1). These observations on arterial clots add to previous work on the contribution of DNA and histones to the FIGURE 6.Confocal microscopy studies using tPA-GFP and red fluores-
cent fibrin after 25 min of fibrinolysis.Eachcolumnof micrographs from lefttorightshowsgreentPA-GFP fluorescence,redAlexa Fluor 546-conju- gated fibrin fluorescence, and the merged image. Thefirst rowshows the accumulation of fibrin aggregates that co-localize with tPA-GFP. Thesecond rowwith the addition of 70g/ml DNA shows less fibrin aggregate forma- tion but a diffuse fibrin clot that remains behind the advancing tPA-GFP front. Thelower two rowswhere clots contain 50g/ml histones and 50
g/ml histones⫹70g/ml DNA, respectively, demonstrate reduced for- mation of fibrin aggregates within fibrin and less binding of tPA-GFP. The numbersin thelast columnindicate the relative distance for penetration of tPA-GFP in the clot at 25 min (the mean value for pure fibrin is 1, mean and S.E.
from at least six samples,p⬍0.05 for all additives according to the Kolmogo- rov-Smirnov test in comparison with pure fibrin).Scale bars, 20m.
FIGURE 7.Binding of FDPs and DNA studied using ITC.The cell (1.43 ml) of the titration calorimeter was filled with 0.5 mg/ml DNA, 25 successive aliquots (10l each) of 6MFDPs were injected into the cell at 25 °C, and the heat increments of each addition (raw differential power (DP)) were measured (top panel). The base line-corrected, peak-integrated, and concentration-normal- ized enthalpy changes (⌬QN;bottom panel,squares) were evaluated accord- ing to the single site algorithm, and the best fitting binding isotherm is shown. Theinsetshows a non-reducing SDS-PAGE gel of typical FDP prepa- rations consisting of high molecular weight fibrin fragments (binding) and low molecular weight fibrin fragments (non-binding).
at SEMMELWEIS UNIV OF MEDICINE on November 11, 2014http://www.jbc.org/Downloaded from
pathogenesis of deep vein thrombosis in animal models, for example baboons (5) and mice (13), as well as other conditions such as sepsis (29) and inflammatory and autoimmune diseases (30). The influence of DNA and histones on arterial thrombi warranted further investigation, and our results presented above suggest that DNA, histones, DNA⫹histones, and hepa- rin can have different, sometimes opposing, effects, which are now considered below in turn.
Histones—Histones appear to have a significant effect on clot structure as shown in Table 1 and suggested in Figs. 2, 4, and 8.
The trend is for more opaque fibrin, correlating with thicker fibrin fibers. As illustrated in Fig. 3, the impact is to provide a more robust clot structure in line with earlier data from pure
fibrin clots (21) in which changes in fiber diameter had a signif- icant impact on the G⬙/G⬘ratio (dissipated/stored energy in deformation; Table 2). The fibrinolysis data for time to clot collapse (results summarized in Fig. 5) and confocal micros- copy studies in Fig. 6 suggest that the activity of tPA may be up to 50% higher in the presence of 50g/ml histones. The micro- titer plate system (Fig. 4) provided data that histones appear to delay lysis at the higher concentrations approaching 1 mg/ml.
However, at lower concentrations, the relative rate of fibrinol- ysis is higher in the presence of histones if we take into account the higher initial peak absorbance and time to lysis. These results agree with previous observations that thicker fibers pro- mote more rapid clot lysis (31). There is evidence from the ITC TABLE 3
Binding data from isothermal titration calorimetry
The intermolecular interactions of the indicated ligands were measured as described under “Experimental Procedures” and illustrated in Fig. 7. Fg, fibrinogen; Plg, plasminogen;N, size of binding site (in number of nucleotides when DNA is the binding partner or number of molecules when histone is used);Kd, dissociation equilibrium constant;⌬H, enthalpy change. Mean and S.D. of at least four measurements are shown.
FDP/DNA FDP/histone Fg/DNA Plg/DNA
Mean S.D. Mean S.D. Mean S.D. Mean S.D.
N 1315.8 136.3 1.6 0.5 2145.9 1903.0 682.0 110.9
Kd(nM) 136.1 111.7 190.7 91.7 534.3 52.8 524.1 72.7
⌬H(kcal/mol) ⫺239.5 28.8 ⫺12.8 2.9 ⫺1116.3 1874.4 ⫺153.0 135.6
FIGURE 8.Heparin displaces DNA in the histone-DNA complex.Ashows the effect ofunfractionatedheparin concentration on maximum clot absorbance for clots containing 0.015 mg/ml DNA and 0 (crosses), 0.02 (circles), 0.05 (diamonds), 0.1 (triangles), 0.25 (squares), and 0.3 mg/ml (inverted triangles) histone.B–F show the effects of increasing unfractionated heparin concentration on the times to 50% lysis (not with same ranges but all in seconds) in clots containing 0.015 mg/ml DNA and the same range of histone concentrations as inA. In all cases, thecrossesshow the effect of heparin alone (lysis times with DNA but no histones), and thex axisis heparin concentration (log scale IU/ml in reaction mixture).
at SEMMELWEIS UNIV OF MEDICINE on November 11, 2014http://www.jbc.org/Downloaded from
studies (Fig. 7) that histones can bind FDPs, and this may account for inhibition of lysis at higher histone concentrations (⬎110g/ml).
DNA—In contrast to histones, the effects of DNA on clot structure are minor (Table 1 and Figs. 2 and 4). However, rhe- ology data suggest that clots containing DNA were less stable in response to mechanical shear forces, had reduced stiffness (G⬘), and were more able to dissipate energy in response to deforma- tion (G⬙), suggesting “weak, floppy” clots (Table 2). The SAXS data (Fig. 2) reveal the structural background of these effects:
disrupted longitudinal alignment of the monomers (loss of Peak 2;supplemental table) and preserved protofibril-to-protofibril distance (no change in Peak 3;supplemental table). Fibrinolysis may also be inhibited in these clots according to data presented in Fig. 4 and from the clot collapse assay, but here it may be important to differentiate between fibrin lysis and plasminogen activation in clots that incorporate DNA. Previous work involv- ing binding studies and enzyme assays has shown that DNA and oligonucleotides can promote plasminogen activation by tPA and urokinase-type plasminogen activator with both Glu- and Lys-plasminogen (32). The mechanism of stimulation is pro- posed to be via template formation between plasminogen, acti- vator, and DNA such that the apparentKm for plasminogen reaction with tPA or to a lesser extent urokinase-type plasmin- ogen activator is reduced. Potentially significant increases up to 480- or 17-fold in stimulation ofkcat/Kmfor plasminogen acti- vation by tPA and urokinase-type plasminogen activator, respectively, were found, but the interaction was also found to be dependent on ionic strength. It was proposed that DNA and fibrin compete to bind plasminogen and activator (32). We have made similar observations using an assay system in which plasminogen activation is measured with a plasmin-specific chromogenic substrate in the presence of fibrin (33). However, fibrinolysis assays do not show any increased lysis due to DNA but rather delayed clot dissolution. Significantly, it appears from the confocal microscopy studies in Fig. 6 (second row) coupled with the ITC data shown in Fig. 7 and observations in Fig. 5 that DNA may bind to large FDPs and effectively hold the network together. Further digestion of large FDPs to lower molecular weight forms is then required to achieve complete clot dissolution.
DNA⫹Histones—The combination of DNA with histones provides effects that are greater than either component alone.
Structural changes seen with histones are retained with the addition of DNA as shown in Table 1 and SAXS studies (Fig. 2) for example. Clot rigidity is enhanced in rheology studies (Fig.
3) by the addition of DNA to histones as evidenced by improved stability, rigidity, an increase in loss modulus G⬙, and a signifi- cant impact on the G⬙/G⬘ratio (dissipated/stored energy in deformation; Table 2). Increased fiber diameter has been iden- tified as a significant factor in increasing clot stability and net- work stiffness (21), and it has also been proposed that clot rigid- ity might be a predisposing factor for increased myocardial infarction (34). The striking changes seen in Fig. 4Care imme- diately visually apparent in Fig. 5, tubes 4 and 5. Thus, the incor- poration of DNA and histones into fibrin clots extended the time to lysis by tPA by many hours. Nevertheless, close inspec- tion of these tubes suggests that the onset of fibrinolysis was
rapid, and the trapped bubbles monitored in Fig. 5 began to move early in the lysis process before those in the tubes con- taining DNA or histones alone, suggesting efficient plasmino- gen activation and fibrin breakdown. Furthermore, confocal studies (Fig. 6) also suggest that histones and DNA together do not hinder the rate of fibrin lysis, the background of which can be identified in the decreased fiber density (loss of Peak 3; Fig. 2 andsupplemental table). Taken together with the ITC data that indicate that both DNA and histones may bind FDPs, it may be proposed that the slow breakdown seen in Fig. 4Cand Fig. 5, tube 4, is due to a long lived network of DNA, FDPs, and his- tones. That DNA is critical in this proposed network is demon- strated by tube 5, which contained DNase I either added during clot formation (Fig. 5A) or mixed with DNA 30 min prior to clotting (Fig. 5B). Close inspection of lysis insupplemental Vid- eos 1 and 2shows that the DNase causes a different pattern of breakdown of the network in Fig. 5Awhereby large fragments of fibrin can be seen raining down (without DNase, the fibrin network simply fades). In Fig. 5B, tube 5, the DNase pretreat- ment prevents formation of the heterogeneous clot structure seen in tube 4, and lysis is efficient and only slightly prolonged relative to control clots with no DNA or histones. Thus, DNase is an effective fibrinolytic agent in this system in combination with tPA.
Heparin—Heparin has been suggested as a potential treat- ment for sepsis as it can potentially bind to and neutralize his- tones in circulation, and heparin is known to interfere with formation of NETs (5, 35). Non-anticoagulant heparins have been explored, and evidence has been presented that they act in more complex ways than simply binding positively charged his- tones (3, 36). In the current study, unfractionated heparin was included in clot lysis experiments to investigate its effects on clot structure and lysis. A summary of results is presented in Fig. 8. Both clotting and lysis were affected, indicating that hep- arin, histones, and DNA can modify fibrin formation and struc- ture. Over a range of heparin concentrations in a system con- taining DNA and histones, there was a pronounced peak in clot lysis time at a heparin concentration that was dependent on the histone concentration. This pattern of response where there is an optimum heparin concentration and a bell-shaped profile on a log heparin concentration scale suggests a template mecha- nism and formation of a heparin-histone-DNA trimeric com- plex, which has a profound impact on clot behavior. As the heparin concentration is increased, the data suggest that DNA is displaced, and the histone-heparin dimer complex predomi- nates. The displacement of DNA is supported by the SAXS data (Fig. 2). The nanostructural pattern of the quaternary fibrin- DNA-histone-heparin complex resembles that of the fibrin- DNA clots but not of the pure fibrin clots (supplemental table).
The proposition that the heparin-histone-DNA trimer may have distinct and significant effects on clot structure and lysis requires further investigation if heparin and heparin-like mol- ecules are to be used in the clinical setting of sepsis and other situations where DNA and histones are present in the circulation.
In Vivo Implications—The diverse methods utilized in the current work mostly require purified components in relatively simple systems, and obviously caution is required when extrap-
at SEMMELWEIS UNIV OF MEDICINE on November 11, 2014http://www.jbc.org/Downloaded from
olating to thein vivosituation. Nevertheless, these data add to previous work implicating DNA and histones in disturbances in coagulation and promotion of deep vein thrombosis (3, 5, 36).
We have extended these studies to include arterial clots and now focus on fibrinolysis. These earlier studies involved his- tones within the same concentration range used in the present study (around 40g/ml for example (3, 36)), and concentra- tions up to 70g/ml have been measured in baboon models of sepsis (29). It is difficult to estimate the amounts of DNA that might be found in venous or arterial blood clots, but very high local concentrations around dead cells are likely as observed previously (5). The heterogeneous distribution of DNA and his- tones observed in arterial clots shown in Fig. 1 suggests that it will be difficult to predict how they affect clot stability and lysis in vivo. In addition to situations where NET formation is likely, DNA and histones may accumulate in the vicinity of atheroscle- rotic plaques, which contain dead cells. Thrombosis is believed to occur here after necrotic core expansion causes weakening of the atheroma cap to generate thrombogenic debris (37).
Inflammatory signals may also recruit additional leukocytes to blood clots, providing an increased pool of DNA and histones (38). We propose that DNA release may result in weakened clots more prone to embolize, whereas histones might strengthen clot structure. DNA and histones may enhance plas- minogen activation, but the most important observation in the present study is the slow breakdown of fibrin clots containing DNA ⫹ histones, which appear to stabilize the network by binding large FDPs. We find that heparin can counter the effects of DNA in clot lysis, but further work is required to investigate the activity of DNA-histone-heparin complexes.
Prolonged clot lysis in the presence of histones⫹DNA may be reversed by DNase, providing a rationale for the secretion of streptodornase along with streptokinase by streptococci as mentioned above. If arterial clots do contain significant levels of histones and DNA derived from atheroma or released by apo- ptotic cells within the clots it raises the prospect that adding DNase to plasminogen activators used for thrombolytic treat- ment may lead to improved therapeutic outcomes.
Acknowledgments—We are grateful to Györgyi Oravecz for technical assistance and to Dr. András Kovács for immunostaining of thrombus sections. We are also grateful to Rizwan Yusuf and Paul Metcalfe for help with photography.
REFERENCES
1. Brinkmann, V., Reichard, U., Goosmann, C., Fauler, B., Uhlemann, Y., Weiss, D. S., Weinrauch, Y., and Zychlinsky, A. (2004) Neutrophil extra- cellular traps kill bacteria.Science303,1532–1535
2. Clark, S. R., Ma, A. C., Tavener, S. A., McDonald, B., Goodarzi, Z., Kelly, M. M., Patel, K. D., Chakrabarti, S., McAvoy, E., Sinclair, G. D., Keys, E. M., Allen-Vercoe, E., Devinney, R., Doig, C. J., Green, F. H., and Kubes, P.
(2007) Platelet TLR4 activates neutrophil extracellular traps to ensnare bacteria in septic blood.Nat. Med.13,463– 469
3. Semeraro, F., Ammollo, C. T., Morrissey, J. H., Dale, G. L., Friese, P., Esmon, N. L., and Esmon, C. T. (2011) Extracellular histones promote thrombin generation through platelet-dependent mechanisms: involve- ment of platelet TLR2 and TLR4.Blood118,1952–1961
4. Massberg, S., Grahl, L., von Bruehl, M. L., Manukyan, D., Pfeiler, S., Goos- mann, C., Brinkmann, V., Lorenz, M., Bidzhekov, K., Khandagale, A. B.,
Konrad, I., Kennerknecht, E., Reges, K., Holdenrieder, S., Braun, S., Rein- hardt, C., Spannagl, M., Preissner, K. T., and Engelmann, B. (2010) Recip- rocal coupling of coagulation and innate immunity via neutrophil serine proteases.Nat. Med.16,887– 896
5. Fuchs, T. A., Brill, A., Duerschmied, D., Schatzberg, D., Monestier, M., Myers, D. D., Jr., Wrobleski, S. K., Wakefield, T. W., Hartwig, J. H., and Wagner, D. D. (2010) Extracellular DNA traps promote thrombosis.Proc.
Natl. Acad. Sci. U.S.A.107,15880 –15885
6. Ruf, W., and Ruggeri, Z. M. (2010) Neutrophils release brakes of coagula- tion.Nat. Med.16,851– 852
7. Borissoff, J. I., and ten Cate, H. (2011) From neutrophil extracellular traps release to thrombosis: an overshooting host-defense mechanism? J.
Thromb. Haemost.9,1791–1794
8. Esmon, C. T. (2009) Basic mechanisms and pathogenesis of venous thrombosis.Blood Rev.23,225–229
9. Smeeth, L., Cook, C., Thomas, S., Hall, A. J., Hubbard, R., and Vallance, P.
(2006) Risk of deep vein thrombosis and pulmonary embolism after acute infection in a community setting.Lancet367,1075–1079
10. Gladysheva, I. P., Sazonova, I. Y., Chowdhry, S. A., Liu, L., Turner, R. B., and Reed, G. L. (2002) Chimerism reveals a role for the streptokinase
-domain in nonproteolytic active site formation, substrate, and inhibitor interactions.J. Biol. Chem.277,26846 –26851
11. Walker, M. J., McArthur, J. D., McKay, F., and Ranson, M. (2005) Is plas- minogen deployed as aStreptococcus pyogenesvirulence factor?Trends Microbiol.13,308 –313
12. Aziz, R. K., Ismail, S. A., Park, H. W., and Kotb, M. (2004) Post-proteomic identification of a novel phage-encoded streptodornase, Sda1, in invasive M1T1Streptococcus pyogenes.Mol. Microbiol.54,184 –197
13. Brill, A., Fuchs, T. A., Savchenko, A. S., Thomas, G. M., Martinod, K., De Meyer, S. F., Bhandari, A. A., and Wagner, D. D. (2012) Neutrophil extra- cellular traps promote deep vein thrombosis in mice.J. Thromb. Haemost.
10,136 –144
14. Longstaff, C., Thelwell, C., Williams, S. C., Silva, M. M., Szabó, L., and Kolev, K. (2011) The interplay between tissue plasminogen activator do- mains and fibrin structures in the regulation of fibrinolysis: kinetic and microscopic studies.Blood117,661– 668
15. Silva, M. M., Thelwell, C., Williams, S. C., and Longstaff, C. (2012) Regu- lation of fibrinolysis by C-terminal lysines operates through plasminogen and plasmin but not tissue plasminogen activator (tPA).J. Thromb. Hae- most.10,2354 –2360
16. R Development Core Team (2011)R, a Program for Statistical Computing, The R Foundation for Statistical Computing, Wien, Austria
17. Sands, D., Whitton, C. M., Merton, R. E., and Longstaff, C. (2002) A col- laborative study to establish the 3rd International Standard for tissue plas- minogen activator.Thromb. Haemost.88,294 –297
18. Komorowicz, E., Kolev, K., and Machovich, R. (1998) Fibrinolysis with des-kringle derivatives of plasmin and its modulation by plasma protease inhibitors.Biochemistry37,9112–9118
19. Ra´cz, Z., and Baro´ti, C. (1993) Technical aspects of buffy coat removal from whole blood and those of platelet production from single buffy coat units.Biomed. Tech.38,266 –269
20. Wohner, N., Keresztes, Z., Sótonyi, P., Szabó, L., Komorowicz, E., Macho- vich, R., and Kolev, K. (2010) Neutrophil granulocyte-dependent proteol- ysis enhances platelet adhesion to the arterial wall under high-shear flow.
J. Thromb. Haemost.8,1624 –1631
21. Ryan, E. A., Mockros, L. F., Weisel, J. W., and Lorand, L. (1999) Structural origins of fibrin clot rheology.Biophys. J.77,2813–2826
22. Gleber, G., Cibik, S., Haas, S., Hoell, A., Muller, P., and Krumrey, M. (2010) Traceable size determination of PMMA nanoparticles based on Small Angle X-ray Scattering (SAXS). J. Phys. Conf. Ser. 247, doi:10.1088/
1742– 6596/247/1/012027
23. Nikolova, N. D., Toneva-Zheynova, D., Kolev, K., and Tenekedjiev, K.
(2012) inTheory and Applications of Monte Carlo Simulations(Chan, W. K., ed) InTech, Rijeka,Croatia
24. Yeromonahos, C., Polack, B., and Caton, F. (2010) Nanostructure of the fibrin clot.Biophys. J.99,2018 –2027
25. Weisel, J. W. (1986) The electron microscope band pattern of human fibrin: various stains, lateral order, and carbohydrate localization.J. Ultra-
at SEMMELWEIS UNIV OF MEDICINE on November 11, 2014http://www.jbc.org/Downloaded from